Publication Information
ISSN 2691-8803
Frequency: Continuous
Format: PDF and HTML
Versions: Online (Open Access)
Year first Published: 2019
Language: English
| Journal Menu |
| Editorial Board |
| Reviewer Board |
| Articles |
| Open Access |
| Special Issue Proposals |
| Guidelines for Authors |
| Guidelines for Editors |
| Guidelines for Reviewers |
| Membership |
| Fee and Guidelines |
 |
Urban Flood Analysis and Early Warning Solution for Disaster Resilience
Prasoon Singh1, 2*, Vinay S P Sinha1, K Venkatramana2, Lu Li3
1TERI School of Advanced Studies, India
2The Energy and Resources Institute, India
3Norwegian Research Centre As, Norway
Received Date: March 24, 2024; Accepted Date: March 29, 2024; Published Date: April 10, 2024
*Corresponding author: Prasoon Singh; TERI School of Advanced Studies (TERI-SAS), India; The Energy and Resources Institute (TERI), India; Email: prasoon.singh@teri.res.in
Citation: Singh P, Sinha VSP, Venkatramana K, Li Lu (2024); Urban Flood Analysis and Early Warning Solution for Disaster Resilience, Enviro Sci Poll Res and Mang: ESPRM-143
DOI: 10.37722/ESPRAM.2024202
Abstract
The objective of this work is to present the experimental findings of an urban flood early warning system developed by combining a mesoscale numerical weather prediction model (WRF) forecast with a distributed hydrologic modelling system. Hydrodynamic models have been used in the simulation of intricate and interrelated dynamic systems, such as urban watersheds and urban water infrastructure. The use of these models in assessing the flood hazard, vulnerability, and risk is well-established. On the other hand, the Numerical weather prediction (NWP) such as WRF model output are crucial to increase the lead time for the flood forecasting. The Weather Research and Forecasting (WRF) model is employed for the purpose of generating precipitation forecasts, which are subsequently utilized to conduct hydrologic and hydrodynamic simulations. In accordance with the climatology of the study area, the WRF model forecast is juxtaposed with the observed rainfall data for days 1, 2, and 3. Statistical indicators of accuracy assessment suggest acceptable degree of correlation with the observed precipitation. The experiment successfully designed and implemented a comprehensive web-based urban flood forecast and early warning system. The system is able to predict possible inundation areas within the catchment due to projected rainfall. Additionally, the study develops a web-based Flood Management Information System (MIS) that is fully automated and disseminate early warning with a lead time of 72 hours.
Keywords: Weather Research Forecast Model, Urban Flooding; Flood Early Warning System; Inundation Forecast, Guwahati
Introduction
The flood early warning and forecasting system has traditionally placed significant emphasis on level-based forecasting for major river systems globally. In recent years, there have been significant advancements in model-based numerical weather forecasting, which have facilitated the progress of inundation forecasting. This progress has been achieved through the integration of rainfall prediction with hydrologic simulation models (Merkuryeva G. et al., 2015; Xuan et al., 2009).). The integrations have undergone rigorous testing and have been effectively implemented to fulfill the necessary function of flood forecasting and early warning across various scales and geographical regions. The majority of these advancements rely on the utilisation of the Weather Research and Forecasting (WRF) Model, which is a cutting-edge mesoscale numerical weather prediction (NWP) system specifically developed for atmospheric research and operational forecasting requirements (Kosovic B. et al., 2020). The Weather Research and Forecasting (WRF) system is a collection of software tools designed to support Numerical Weather Prediction (NWP) model simulations, specifically for the forecasting of atmospheric variables (Liu et al., 2021). However, the accuracy of these predictive models varies and is contingent upon various physical parameterization techniques (Nasrollahi et al., 2012).
The study conducted by Rogelis and Werner (2018) aimed to assess the efficacy of Numerical Weather Prediction (NWP) models in providing flood warnings in tropical mountainous watersheds. The findings indicated that the incorporation of flow estimates from a hydrological model had a positive impact on the effectiveness of flood early warning systems. A decision support system for flood early warning in Italian and Greek cities was developed by Abebe and Price (2005). They provided a range of flood threshold values and utilized the count of ensemble members exceeding each threshold to evaluate the severity and likelihood of flooding events. In another study, Yang et al. (2016) developed an early flood warning system in Taiwan. This system incorporates ensemble rainfall predictions, rainfall thresholds, and a real-time data assimilation mechanism to assess the effectiveness of flood warnings. Dietrich et al. (2009) utilized a portion of the super-ensemble and the quantile of the anticipated flow ensemble to make predictions regarding certain alert levels. Similarly, Li et al. (2017) utilised the WRF model in conjunction with a hydrological model to make predictions on floods in China. The findings of the study indicate that the simulated floods exhibited a high degree of plausibility, suggesting that the model accurately represents real-world flood scenarios.
The incorporation of atmospheric forecasts into flood forecasting systems necessitates the inclusion of their associated uncertainty. In order to address these difficulties, a number of operational flood forecasting systems have transitioned from relying solely on single deterministic forecasts to utilizing ensemble flood predictions (Cloke and Pappenberger, 2009). The utilization of ensemble forecasts for flood anticipation is progressively gaining prominence on a global scale. However, the need to accurately quantify the uncertainty associated with flood prediction is becoming increasingly crucial for practical applications (Komma et al., 2007). This project aims to create a flood forecasting and early warning system by utilizing ensemble Numerical Weather Prediction (NWP) models’ output for weather forecasting and use it for inundation forecasting.
Study area
The present study focuses on the city of Guwahati (Figure 1) as the chosen location for the development of an operational flood forecasting and early warning system. Dispur, the capital of the state of Assam, is situated within the city. The city is located along the banks of the Brahmaputra River, including a total land area of around 328 square kilometers. It is inhabited by a population of over one million (Hemani S. & Das, A. K., 2016). The urban area experiences the recurring issue of annual urban flooding. The municipality has observed a rise in the magnitude of precipitation in recent years, along with challenges related to inadequate waste management, insufficient drainage systems, the encroachment of low-lying areas, and uncontrolled and unplanned urban expansion.
Figure 1: Geographical location of the Study area within the model catchment
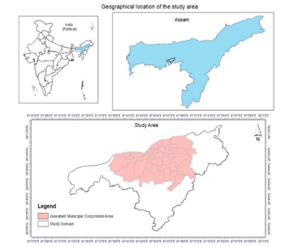
The city exhibits a number of tributaries of Brahmaputra River, as well as a network of minor streams traversing its terrain. The main river channels originate from the foothills of the Khasi hills in Meghalaya includes Bharalu, Mora Bharalu, and Bashistha along with some minor rivulets. Bharalu and Mora Bharalu traverses through the main city and ultimately meets Brahmaputra River. The Basistha River routed through the southern region of the city before discharging into the Dipor Lake. The mean sea level in the city is approximately 50-55 meters above mean sea level (Sarma et al. (2020). The landscape consists of a gently rolling plain characterized by the presence of marshes, small hills, clusters of forests, and wetlands.
Materials and method
Topographic data analysis
The CartoSat version-2 satellite DEM with a spatial resolution of 10 meters is used for extracting the topographic features and delineation of watershed, river networks and cross section information. The digital elevation model (DEM) data undergoes processing within the ArcGIS software in order to achieve hydrologically conditioned DEM, which enables the extraction of accurate flow paths and drainage networks. The Line and Polygon vector data representing building footprints, road networks, and Bridges, Culverts, etc. were digitized manually using google earth and open street maps.
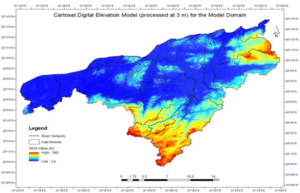
Prior to the rasterization process of the vector data, the building footprints were assigned a standardized height to be set as the boundary condition in the hydrodynamic simulations. At the time of flooding, road networks serve as the preferential path for the movement of water. Hence, the inclusion of precise road network data in the model holds significant importance. The city’s road network has been digitized into five distinct tiers, including highways, primary roads, secondary roads, streets, and service lanes. Subsequently, the rasterized representations of buildings, roads, river networks, and other physical infrastructure layers were incorporated into the digital elevation model (DEM), and resampled at a spatial resolution of 3 meters. This integration aimed to provide a digital surface model (Figure 2) that would accurately reflect the terrain for the purpose of conducting hydrological simulations. The topography data that has undergone processing is utilized to extract the drainage cross-section for the purpose of conducting hydrodynamic simulation in MIKE modelling software.
Figure 2: Processed topographic data at 3m spatial resolution
Rainfall analysis
The analysis of rainfall is conducted using the daily rainfall data obtained from the Indian Meteorological Department (IMD) spanning the years 1902 to 2016. The generalized extreme value (GEV) distribution is used in the analysis and assessment of extreme events. The Generalised Extreme Value (GEV) approach is commonly utilized for the purpose of modelling extreme occurrences in the field of meteorology and various other disciplines (Coles et al., 2003; Khaliq et al., 2006). The concept was initially introduced into the field of meteorology by Jenkinson in 1955 and has since been widely employed to simulate several natural severe occurrences, including precipitation (Gellens, 2002). The standardized variables for GEV distribution are:
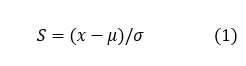
Where μ is the location parameter, and σ is the scale parameter. The probability distribution function (PDF) and cumulative distribution function (CDF) of the Generalised Extreme Value (GEV) distribution can be expressed as follows:
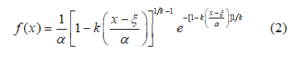
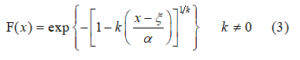
Where α, ξ, and k are the scale parameter, location parameter, and shape parameter, respectively.
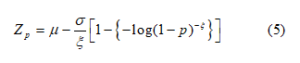
Estimates of the extreme quantiles, known as the return level Zp, corresponding to the return period.
Where, p is the probability of occurrence, can be obtained by
The observation stations at Guwahati have provided time series data over a period of 114 years. The Indian Meteorological Department (IMD) provides three distinct sets of station data, each of which is described in detail in Table 1.
Table 1: Information of observed rainfall stations in the Guwahati
| Stations | Information | Catchment Number | Latitude | Longitude | Period | Missing period | |
| 1 | AWS | 504 | 26N | 91E | 2012-2016 | 42 months missing | |
| 2 | Hydro | 504 | 26N | 91E | 1902-1962,2007 | ||
| 3 | Central | / | / | / | 1949-2016 | 1982,1984 | |
Figure 3: Daily rainfall time series from observation stations in Guwahati
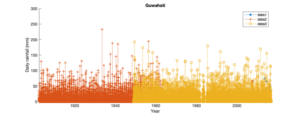
The time series depicting the daily rainfall is illustrated in Figure 3. The extreme precipitation indices were calculated for the data series (Table 2). Uncertainty is present in the context of extreme analysis. One of the primary sources of uncertainty arises from the data itself as the time series dataset contains instances of data errors and missing values. In order to ensure the reliability of the data, points with implausible values have been identified and excluded from consideration. After conducting data quality verification, a revised time series dataset is generated for the purpose of analysis.
Table 2: Definition of extreme precipitation indices
| Acronym | Definition | Units |
| P1d | Annual maximum 1-day precipitation | mm |
| P3d | Annual maximum consecutive 3-day precipitation | mm |
| P7d | Annual maximum consecutive 7-day precipitation | mm |
The probability distribution of rainfall (GEV) based on the corrected data series has been carried out to assess the different probabilities of rainfall in the study area. The findings are presented in Table 3 and the GEV distribution fitted curve with a 95% confidence interval of maximum 1-day precipitation (P1d), 3-day precipitation (P3d), and 7-day precipitation (P7d) with different return periods are depicted in Figure 4.
Figure 4: (A) Observed (red dot), GEV fitted curve (solid line) and 95% confidence interval (dash lines) of maximum 1-day precipitation (P1d), (B) (P3d) and (C) (P7d) with different return periods (Year) for Guwahati station (1902-2016)
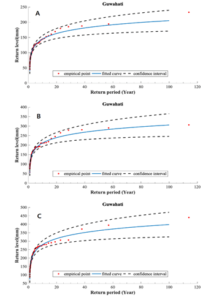
Table 3: Values of extreme precipitation indices for Guwahati station, unit: mm
| City | Details | Return levels | 5 year | 10 year | 50 year | 100 year | 500 year |
| Guwahati | All stations | P1d | 125.4 | 144.6 | 187.1 | 205.3 | 247.8 |
| P3d | 181.7 | 211.0 | 277.4 | 306.1 | 374.3 | ||
| P7d | 241.5 | 279.1 | 362.7 | 398.5 | 482.0 |
Figure 5: Annual extreme precipitation indices, including P1d, P2d, P3d, P4d, P5d, P6d and P7d for Guwahati (1902-2016)
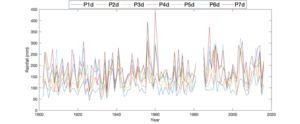
Annual extreme precipitation indices, including P1d, P2d, P3d, P4d, P5d, P6d and P7d are also presented in Figure 5. These values have been modelled in hydrodynamic simulations to understand the flood hazard profile and estimation of hydrologic parameters. This information is then used in further hydrodynamic and hydraulic modelling scenarios to develop flood hazard maps for identification of flood hotspots and validations of forecast.
Components of flood early warning system
The Flood Early Warning System (FEWS) developed in this study consists of five primary components. These components are designed to effectively and promptly distribute accurate information to both end users and nodal authorities. The component is comprised of two mainframes, which can be further subdivided. The first mainframe encompasses data integration and modelling, consisting of four distinct components: weather forecasting, data transfer through FTP, data pre-processing, and hydrologic modelling. The system employs hydrological and hydrodynamic models to simulate and generate flood information at regular hourly intervals based on WRF weather forecast. The flood data is presented in the form of spatial maps, which display the depth of flooding and the places that would be inundated. Additionally, a bulletin containing this information is to be distributed through the secondary mainframe, which serves as a platform for visualization and distribution. The results are shown on a web-based platform and FEWS Dashboard. The dissemination of flood warnings is facilitated via SMS and email channels to the recipient.
WRF precipitation forecast
The IMD-WRF is a cloud-resolving mesoscale model developed to provide forecast products with a lead time of five days for the entire Indian region. The model operates four times a day at a resolution of 3 km, making it an efficient and accurate tool for predicting weather-related events. The IMD-WRF model’s ability to accurately predict rainfall patterns is crucial for weather forecasting, especially in areas where precipitation patterns are skewed. The bias corrected weather prediction is generated from 3-day hourly rainfall forecast from the WRF model. The model outputs are based on high-resolution gridded rainfall data from a network of 6,955 rain gauge stations across India (Pai et al., 2014). This forecast is made available by the Indian Meteorological Department (IMD) through a data terminal that operates on the File Transfer Protocol (FTP). The data is downloaded into the system and subsequently processed according to the specified input format for utilization in hydrologic modelling and inundation mapping. The only post-processing of the WRF forecasts is the sampling of the grids to obtain the hourly weighted mean areal precipitation for each watershed to create hourly rainfall time series data.
Verification and accuracy assessment of WRF forecasts
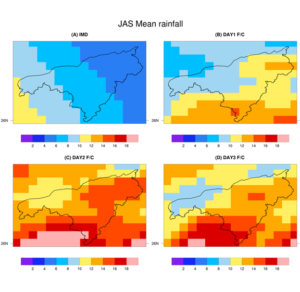
The evaluation of the accuracy of WRF forecasts is conducted by utilizing observed data from the India Meteorological Department (IMD) for the summer monsoon season in Guwahati, spanning July, August, and September (JAS). This evaluation involves a comparative analysis with the forecast data corresponding to the same timeframe. The comparative assessment presented in figure 6 depicts the observed rainfall data sourced from IMD (Figure 6a), illustrating a gradual increment in rainfall rates from the eastern (4 mm/day) to the western (10 mm/day) regions of Guwahati. Model outputs for 3-day forecasts (Figure 6b, 6c, and 6d) exhibited analogous patterns, manifesting approximately 12 mm/day of seasonal mean rainfall on the western side, while diminishing quantities were observed towards the eastern side for all day 1 forecasts throughout the three-month period. Notably, the forecasting accuracy concerning rainfall amount and magnitude on day 1 was higher on the eastern side. However, it was observed that the WRF model tended to overestimate rainfall in day 2 forecasts, highlighting the necessity for further refinement to enhance predictive precision. Nevertheless, the model’s predictions were consistent with observed patterns on the western side in day 3 forecasts, yet exhibited overestimation on the eastern side of Guwahati.
Figure 6: JAS Seasonal mean rainfall (a) IMD (b) Day 1 forecast (c) Day 2 forecast (d) Day 3 forecast
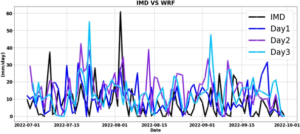
The computation of bias between observed precipitation levels and the WRF model forecasts, as illustrated in Figure 7 for a three-day period, underscores the variance in model performance across eastern and western regions. Furthermore, Figure 8 delineates the comparison of daily mean rainfall as predicted by the WRF model against the IMD observations for the specified season. The correlation between the forecasts for individual days and the IMD data was not markedly strong, with the area-averaged bias being the least for day 1, as detailed in Table 4, and subsequently increasing for days 3 and 2, respectively. The analysis of root mean square error (RMSE) revealed a consistent pattern, showcasing minimal error on the first day. However, the underlying causes for this specific model behaviour remained unclarified. These results indicate the potential of the WRF model as an effective instrument for day 1 weather forecasting within the Guwahati region. Nonetheless, additional research is requisite to ascertain its predictive reliability for the subsequent days.
Table 4: JAS seasonal statistics for three days forecast
| IMD vs WRF | Day1 | Day2 | Day3 |
| Bias | 2.7 | 6.2 | 4.8 |
| RMSE | 11.6 | 13.4 | 13.7 |
Figure 7: JAS Seasonal rainfall bias with IMD for (a) Day 1 forecast, (b) Day 2 forecast, and (c) Day 3 forecast
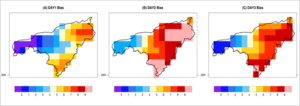
Figure 8: Area averaged daily mean rainfall during JAS
Hydrologic model setup and simulation
The modelling exercise is a combination of a hydrological model (MIKE 11 RR) which deals with the rainfall-runoff simulation and the hydrodynamic model (MIKE 11 HD) deals with the water flow in a channel. The third model deals with the overland flow in 2D simulation MIKE21 (DHI, M. P. B. 2018). The combination of these models provides comprehensive coverage and interaction of different systems in a complex urban setup. As an output, the system provides information on inundation extent and depth in the form of hourly time series data and spatial inundation maps. The project modelling sequence is provided in Figure 9.
Figure 9: Fully dynamic flood plain modelling process
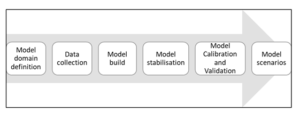
The modelling sequence facilitates the dynamic and complex urban hydrologic interactions as it exists in reality and models these interactions using a systematic approach that looks at urban hydrology as a large complex network of physical, natural, and anthropogenic interactions. The entire exercise is data intensive and requires multiple iterations, trials, and tests to be able to set up a realistic and operational modelling system.
Modelling approach
The modelling system as discussed consists of three modelling setups. The catchment runoff simulation, the routing of runoff through the channel and the overland flow model for flood simulation in an integrated manner for the entire catchment area.
Rainfall-Runoff Simulation
The MIKE (Nedbor-Afstromnings Model) NAM “Precipitation-runoff model” is a conceptual lumped model but can be used as a distributed catchment modelling approach and it is based on the continuity equation. The model operates by continually accounting for the moisture content in four different and mutually interrelated storages (above-surface storage, sub-surface storage, root zone storage, and Groundwater storage) which represent physical elements of the catchment. RR model uses precipitation, temperature, and evaporation as input data (DHI, M. P. B. 2018). The model was calibrated with longer observation datasets of 114 year taking 10 years as the training data for the model as per the standard practice and was excluded from the runoff analysis. However, the model needs continuous refinement because of the changes in catchment characteristics, meteorological parameters such as near real-time rainfall or forecasted rainfall, the addition of new observations, new LULC changes, etc.
Hydrodynamic Model
Once the RR model gives catchment runoff, it is routed through river channels using the hydrodynamic one-dimensional (1D) simulation model MIKE 11 HD. The model provides a fully dynamic solution to complete nonlinear 1-D Saint Venant equations, diffusive wave approximation, and kinematic wave approximation. The Muskingum method and Muskingum-Cunge method are used for simplified channel routing and are also known as hydrologic routing (DHI, M. P. B. 2018). Cross-sections of the river channels were obtained from the primary survey complemented by DEM-based cross-section extraction. The simulation provides travel time, discharge, and water level on river sections as outputs.
Inland flooding simulation
The third component of the modelling exercise is to simulate inland flooding situations. MIKE21 is used to simulate overland flooding. MIKE21 is a 2D overland hydrodynamic flow model which uses MIKE FLOOD that integrates flood plains, streets, rivers, coastal areas, and sewer/stormwater systems into one package. MIKE FLOOD is used for the dynamic integration of Mike 11 (RR), MIKE 11HD (1D), and MIKE 21 (2D). Integration of the 1D model with the MIKE 21 model generates a flood map due to river overflow as lateral flow, and the integration with MIKE 21 and MIKE river modules generates a comprehensive and all hydrologically inclusive flooding situation in the study area.
Results and Discussion
Model results
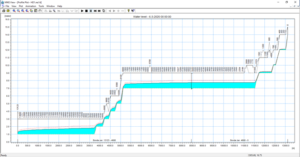
Rainfall-runoff simulation results provide the Catchment runoff (Figure 10) in addition to some intermediate results like soil moisture, actual evaporation, and runoff as overland flow, interflow, and base flow. The hydrodynamic model provides inflow and water levels along the river sections (Figure 11) for the selected simulation period (hindcast and forecast period). Additional input that can be derived from this result is the velocity of water along river sections.
Figure 10: Catchment Runoff from NAM Model
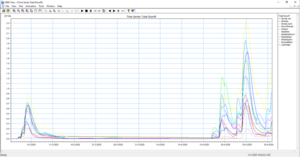
Figure 11: Water Level on L section in the River
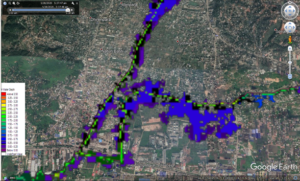
The flood inundation maps, which display both the depth and extent of the flood, are depicted in Figure 12. The flood maps provide a visual representation of the flood level and coverage, while also categorizing the affected regions according to the depth of flooding. The flood level seen in several areas inside the city can be categorized as flood hotspots, with depths ranging from around 0.75 to 1.25 meters. It is evident that areas characterized by river banks, low lying areas, and flat topography are particularly susceptible to flooding, resulting in inundation event at 1-in-5 year rainfall event. The regions that have experienced the highest impact are the northern and southern locations adjacent to the Bharalu River. The majority of the drainage systems were determined to be insufficient in handling rainfall events with a likelihood of occurrence greater than that of a 5-year event. This indicates that the city’s drainage infrastructure is inadequate in mitigating flooding, necessitating the enhancement of its capacity along with other mitigation and adaption interventions.
Figure 12: Flood extent at the confluence of the Rivers
Development of graphical user interface and FEWS dashboard
Model registry
MIKE Operation is the Software tool required to coordinate the exchange of data between the database and the model. It is an interface to view, edit, and save the data (model input and scenario results) in a selected Database Management System (DMS). Models developed during this project are registered in the DMS using MIKE operation software (DHI, M. P. B. 2018). The database management system used here is the PostgreSQL Relational Database with PostGIS as an extension. The DMS is the core component of the system – the place where all data related to ground-measured climatic and hydrological point data, special data, geometric data, weather forecasts, reports, etc. are stored. It satisfies requirements from online users, remote web users, and backend programs (accessed by users indirectly through an external application). It supports storing Geographical type of data. The system, backed by the database, ensures that all data are online and available to applications and users. Whenever a process requests data from the database the response will be based on a snapshot of the current state of the data. It allows multiple concurrent users and processes to inspect and create data in the system. User login-based data access and data in the system reflect the current state, for real-time data as well as configuration data.
Task scheduling and model simulation
Task scheduling is the process of automating the system. Here all the tasks are in a hierarchical manner to download input data to publish on the web applications. Each task is put in a set and creates a single entity called “Job”. The job configuration is done by defining the fixed time. After creating an input time series, the system simulates the model with the attached input time series for output like rainfall-runoff, discharge, water level, net rainfall, etc. Simulation is the background process run through the scheduler once a day. Their output is stored in the database as well as published over web applications. Simulation properties are set for 1-day hindcast and 3-day forecast data from the simulation date time.
Concurrency
Concurrency is managed through the task performed daily to download data for the last 5 days and simulate the model again for the same in the background. In case when the data is not pushed properly through FTP for the same days or sent partially to the server, it get replaced with the corrected file for the same day.
Notification
Notification is the main objective of the Flood Early Warning System. The system instantly notifies the registered users through mail or via SMS, when an alarming situation is captured in the system. User registration is done through the notification setting over the MIKE operation desktop. Here another notification is configured for the admin on a daily basis about the input and output data process status.
Web Portal and dashboard
The web architecture has components of the system and their interaction. The system consists of fetching data from the IMD server to DMS through FTP and sending it to the FEWS application server for input data processing terminal. The task scheduler starts the model simulation at the set time and generates model outputs. The outputs then get published in the browser through a web server. Simultaneously, as per the set threshold, the notifications in the form of SMS and Emails get generated and shared with the end users.
Figure 13: FEWS Web Portal
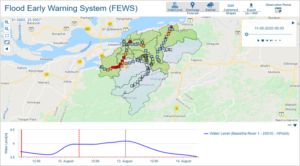
Based on the inputs provided by the MIKE Tools, a web-based dashboard has been developed (Figure 13). It provides holistic information regarding the Hydro River Model & Unban Flooding by capturing the forecasts. Features of the web application are as follows: Model forecast visualization over a map; Tracking the vulnerable area with a lead time of 72 hrs; viewing the trends for rainfall, water level, and discharge at any particular points, export output data for future reference and on the fly assessment of catchment wise rainfall and location-specific discharge.
Conclusion and the way forward
The implementation of the project in Guwahati city marks a significant milestone in the area of disaster risk management, particularly concerning flood-related hazards. Through initial observations, it has become evident that the project has replicability potential in multiple geographies. At its core, the development of an Early Warning System presents itself as a potent tool in managing risks at the city level. The potential of this system extends far beyond its initial implementation site. By strengthening resilience against flood-related hazards, it stands to make substantial contributions to disaster risk reduction efforts on a broader scale. The integration of Forecasting and Early Warning Systems into disaster management endeavors signifies a pivotal advancement in the field, poised to influence significant decision-making processes.
The characteristic of this system lies in its capacity to amalgamate real-time scientific data and present it through adept visualization techniques. This functionality empowers stakeholders with the information necessary for making informed decisions regarding adaptation and response strategies in the face of impending disasters.
As the project progresses, further development is essential to maximize its effectiveness and enhance the accuracy of predictions. This entails refining various input parameters, encompassing aspects such as topography, meteorological observations, real-time data, doppler radar forecasts, and telemetric data integration. By fine-tuning these elements, the system’s reliability and forecast accuracy can be substantially improved, thus fortifying its utility in mitigating the impact of flood-related disasters.
Acknowledgment
The work is undertaken with the support of the National Disaster Management Authority Govt. of India and The Royal Norwegian Embassy, New Delhi. We are thankful for the support provided by Assam State Disaster Management Authority, Indian Meteorological Department. We also acknowledge the support of the North Eastern Space Application Centre (NESAC) India.
References
- Abebe, A. J., & Price, R. K. (2005). Decision support system for urban flood management. Journal of Hydroinformatics, 7(1), 3-15.
- Cloke, H. L., & Pappenberger, F. (2009). Ensemble flood forecasting: A review. Journal of hydrology, 375(3-4), 613-626.
- Coles, S., & Pericchi, L. (2003). Anticipating catastrophes through extreme value modelling. Journal of the Royal Statistical Society: Series C (Applied Statistics), 52(4), 405-416.
- DHI, M. P. B. (2018). MIKE powered by DHI. Retrieved from MIKE Powered by DHI: https://www.mikepoweredbydhi.com.
- Dietrich, J., Schumann, A. H., Redetzky, M., Walther, J., Denhard, M., Wang, Y. & Büttner, U. (2009). Assessing uncertainties in flood forecasts for decision making: prototype of an operational flood management system integrating ensemble predictions. Natural Hazards and Earth System Sciences, 9(4), 1529-1540.
- Gellens, D. (2002). Combining regional approach and data extension procedure for assessing GEV distribution of extreme precipitation in Belgium. Journal of Hydrology, 268(1-4), 113-126.
- Hemani, S., & Das, A. K. (2016). City profile: Guwahati. Cities, 50, 137-157.
- Jenkinson, A. F. (1955). The frequency distribution of the annual maximum (or minimum) values of meteorological elements. Quarterly Journal of the Royal Meteorological Society, 81(348), 158-171.
- Khaliq, M. N., Ouarda, T. B., Ondo, J. C., Gachon, P., & Bobée, B. (2006). Frequency analysis of a sequence of dependent and/or non-stationary hydro-meteorological observations: A review. Journal of hydrology, 329(3-4), 534-552.
- Komma, J., Reszler, C., Blöschl, G., & Haiden, T. (2007). Ensemble prediction of floods–catchment non-linearity and forecast probabilities. Natural Hazards and Earth System Sciences, 7(4), 431-444.
- Kosovic, B., Haupt, S. E., Adriaansen, D., Alessandrini, S., Wiener, G., Delle Monache, L., & Prestopnik, P. (2020). A comprehensive wind power forecasting system integrating artificial intelligence and numerical weather prediction. Energies, 13(6), 1372.
- Li, L., Gochis, D. J., Sobolowski, S., & Mesquita, M. D. (2017). Evaluating the present annual water budget of a Himalayan headwater river basin using a high‐resolution atmosphere‐hydrology model. Journal of Geophysical Research: Atmospheres, 122(9), 4786-4807.
- Liu, Y., Liu, J., Li, C., Yu, F., Wang, W., & Qiu, Q. (2021). Parameter sensitivity analysis of the WRF-hydro modeling system for streamflow simulation: A case study in semi-humid and semi-arid Catchments of Northern China. Asia-Pacific Journal of Atmospheric Sciences, 57, 451-466.
- Merkuryeva, G., Merkuryev, Y., Sokolov, B. V., Potryasaev, S., Zelentsov, V. A., & Lektauers, A. (2015). Advanced river flood monitoring, modelling, and forecasting. Journal of computational science, 10, 77-85.
- Nasrollahi, N., AghaKouchak, A., Li, J., Gao, X., Hsu, K., & Sorooshian, S. (2012). Assessing the impacts of different WRF precipitation physics in hurricane simulations. Weather and Forecasting, 27(4), 1003-1016.
- Pai D.S., Latha Sridhar, Rajeevan M., Sreejith O.P., Satbhai N.S. and Mukhopadhyay B., (2014). Development of a new high spatial resolution (0.25° X 0.25°) Long period (1901-2010) daily gridded rainfall data set over India and its comparison with existing data sets over the region; MAUSAM, 65, 1-18.
- Rogelis, M. C., & Werner, M. (2018). Streamflow forecasts from WRF precipitation for flood early warning in mountain tropical areas. Hydrology and Earth System Sciences, 22(1), 853-870.
- Sarma, C. P., Dey, A., & Krishna, A. M. (2020). Influence of digital elevation models on the simulation of rainfall-induced landslides in the hillslopes of Guwahati, India. Engineering Geology, 268, 105523.
- Xuan, Y., Cluckie, I. D., and Wang, Y.: Uncertainty analysis of hydrological ensemble forecasts in a distributed model utilising short-range rainfall prediction, Hydrol. Earth Syst. Sci., 13, 293–303, https://doi.org/10.5194/hess-13-293-2009, 2009.
- Yang, T. H., Hwang, G. D., Tsai, C. C., & Ho, J. Y. (2016). Using rainfall thresholds and ensemble precipitation forecasts to issue and improve urban inundation alerts. Hydrology and Earth System Sciences, 20(12), 4731-4745.