ISSN: 2641-6816
Frequency: Continuous
Format: PDF and HTML
Versions: Online (Open Access)
Year first Published: 2018
Language: English
| Journal Menu |
| Editorial Board |
| Reviewer Board |
| Articles |
| Open Access |
| Special Issue Proposals |
| Guidelines for Authors |
| Guidelines for Editors |
| Guidelines for Reviewers |
| Membership |
| Fee and Guidelines |
 |
The Mind of Misbranding-An Exploratory Study
Howard R Moskowitz1 ,Aurora A Saulo2*, Ryan Zemel3, Yehoshua Deitel4, Attila Gere5
1Mind Genomics Associates, Inc.11 Sherman Ave., White Plains, NY 10605, USA
2Department of Tropical Plant & Soil Sciences, University of Hawaii at Manoa (UHM), USA
3LimbicReviews, 1329 Turvey Road, Downers Grove, IL 60515, USA
4Sifra Digital, 15 Mishol HaKoranit, Jerusalem, Israel
5Department of Postharvest Science and Sensory Evaluation, Szent István University, Hungary
Received Date: June 26, 2019; Accepted Date: July 24, 2019; Published Date: August 9, 2019
*Corresponding author:Aurora A Saulo, Department of Tropical Plant & Soil Sciences, University of Hawaii at Manoa (UHM), 3190 Maile Way, St John 102, Honolulu, HI 96822, USA. Tel: +18089566564;Email: aurora@hawaii.edu
Citation: Moskowitz HM; Saulo AA, Zemel R, Deitel Y, Gere A (2019) The Mind of Misbranding-An Exploratory Study. Adv Nutri and Food Sci: ANAFS-140.
Abstract
Mind Genomics, an advanced form of conjoint analysis, was applied to investigate how different statements on food labels with geographical indications are perceived to be truthful versus deceptive. Stimuli comprising typical combinations of messages or vignettes (as opposed to single messages) were combined by experimental design with each respondent evaluating different vignette on a bipolar scale of deceptive to truthful. Regression analysis revealed the degree to which each message drove the perception of both truthful and deceptive information on food labels. Respondents considered it truthful when the name or brand or vignette of the product is consistent with the manufacturer’s location declared on the package. Two mind-sets emerged with different interpretations of misbranding. Mindset 1 considered it deceiving (misbranded) when there is no relation between contents, name, brand, or vignette of the product and the manufacturer’s location. Mindset 2 considered labels misbranded when there are no sensible facts. Both mindsets agreed on the need for truthful and honest food labels with geographical indications.
Keywords: Misbranding; Mind Genomics; Geographical indications
Introduction/Background
In the United States, food package labels are regulated mostly by the Food and Drug Administration (FDA) and the United States Department of Agriculture (USDA). For the more numerous FDA-regulated products, a legal food label comprises the principal display panel (PDP) that is on the front panel of the package read by the consumer, along with the information panel situated immediately to the right of the PDP. The PDP identifies the food name and its net weight.
There have been modifications made to the product label over the years, the most recent one of which was in 2016, to improve the ease of its use in making food choices based on new scientific information. To this date, the responsibility statement is the only part of the food label that has remained unchanged; it declares the name of the manufacturer, distributor or packer and its street address or phone number if not easily available. The only requirement is that it be written in English. It is not uncommon to see food labels used as a marketing tool. For example, a geographical location, such as Hawaii, may be included in a product name as in “Hawaii pineapple” with a vignette depicting the iconic Waikiki beach scenes of tropical palm trees, outrigger canoe paddlers, hula dancers, and the profile of Diamond Head in the background. The product label markets the romance and mystique associated with foods from this geographical location. Unfortunately, some manufacturers have falsely associated product names with geographical indications and vignettes different from where the food originated as declared in the responsibility statement. This practice is a form of misbranding and is in violation of the Federal Food, Drug, and Cosmetic Act of 1938 that mandates food labels to be truthful and not misleading.
Literature Review
The product label helps consumers to make informed decisions on their health and wellness based on the food that they buy. The name of the food, net weight in the package, the ingredients used, any allergen statement, and the Nutrition Facts provide the information. In practice, the responsibility statement has been considered by the FDA as not having a direct relationship to people’s health and wellbeing.
Although misbranding is considered a serious business offense by the food industry, compliance has not been a priority of enforcement with the public health agency. A literature review of studies related to misbranding, responsibility statement, and country-of-origin labeling indicated that these issues clearly remain important to marketing or trade but not as clearly to public health.
Newman et al. (2014) [1] reviewed country-of-origin labeling (COOL) research studies from 1990 to 2010 relevant to the global food industry. They concluded that there was “little generalizable knowledge” about COOL because there was little testing of its “theoretical application and development.” The thorough review by Newman et al., failed to uncover studies on the responsibility statement. Foods originally affected by COOL included all meat, fish, fresh fruit and vegetables, chicken, goat meat, ginseng, peanuts, pecans, macadamia nuts, and other covered commodities. Although the importance of declaring food origin in these commodities was evident, it was relegated to being a marketing issue, relevant to global trade, and a non-tariff barrier by some countries. This interpretation resulted in the repeal of COOL in 2016 for muscle cuts of beef and pork, and its ground parts [2].
At the request of the Hawaii Food Manufacturers Association who maintained that misbranded foods seriously impacted marketing their products, Hodgson and Bruhn (1992) [3] conducted a nationwide mail study in the United States to address consumer attitudes toward misbranded foods. When presented with fictitious products labeled with a geographical indication, almost 75 percent of the respondents expected a relation between the product name and the food origin as declared in the responsibility statement. About 75 percent of the respondents considered it “inappropriate” when a product with a label naming a fictitious manufacturer from a specific geographical indication was not located in that specific location even though the package featured an illustration iconic of a scene from the geographical indication. For 80 percent of the respondents, “inappropriate” meant “misleading,” “deceptive,” “borders on fraud,” “lacks truth in advertising,” and a “lie.” Unfortunately, about half of the U.S. respondents expected manufacturers to practice misbranding.
New Food Magazine [4] reported that about 80 percent of consumers in Germany and the Netherlands do not trust food labels because they are misleading. This consumer perception was reinforced by a recent OnePoll study conducted for Crispy Green (Gervis, 2018) [5] that indicated about 43 percent of Americans believe that labels are intentionally misleading for marketing purposes. The study further reported that where the product was made and where it is from were top concerns in food purchase.
Hodgson and Bruhn (1993, 1992) [6] were cited in other publications which addressed a variety of aspects of the food label including encouraging a relationship between food labels and food safety [7], dealing with the varying definitions of the geographic location “local” [8], focusing on misbranding, labels, advertisement labeling [9], and how deceptive advertising may render advertisers responsible for consumer mistakes [10]. No other peer-reviewed scientific studies were uncovered on the consumer behavior and attitude toward the use of food labels involving geographical locations.
Misbranding is an important global business issue. It is often a contentious point in trade agreements where it is referred as geographical indication GI [11]. Gangjee (2012) [12] traced the history of geographical indications and pointed its differences from trademarks. In Europe and other places where GI protection is a priority for trade policy, their argument is that it is essential to curb fraud, promote fairness, and encourage economic development. The pragmatics of trade concern with consumer complaints may lead to better policing by the food industry and to preventing negative publicity in the popular press, trade publications, and similar sources.
The original intention of GI protection was to protect domestic manufacturers from competitors in an increasingly international marketplace and to prevent the names from becoming generic. In addition, certain GIs carry specific production standards. For example, the label Champagne may only be used on wines in Europe when the grapes are grown in the Champagne region and produced following specific practices stated in their law. In the U.S., trademarks are used to protect certain geographic brands if they clearly have meanings other than geographic origin, such as Philadelphia cream cheese and Amazon online shopping. Standards of identity are also used but the proliferation of innovative new products due to consumer demand has recently led the FDA to initiate modernizing certain standards of identity [13]. Such changes will allow product development of alternative foods based on their public health value and with accurate food information, such as Almond Milk.
Despite legal and trade efforts, the practice of misbranding has continued and continues even today. In November 1995, Wisconsin filed a lawsuit to prevent Fromageries Bel Inc. from continuing its use of the WisPride® trademark on their cheese manufactured in Kentucky because using the same trademark on cheese not from Wisconsin was tantamount to “false advertising.” In late 1996 to early 1997, WisPride® production was moved to Wisconsin for economic reasons and essentially halted the lawsuit [14].
A year later in November 1996, Michael Norton of Kona Kai Farms was indicted for money laundering and wire fraud. Mr. Norton used a front company to import coffee beans from Panama and Costa Rica, removed the beans from the original bags, and re-bagged the same beans into Kona Kai Farms bags labeled “Pure Kona Coffee” [15].
In July 2018, Aloha Holdings LLC based in Chicago issued cease-and-desist letters to businesses in Hawaii and on the Mainland U.S. for using the words “Aloha” and “Aloha Poke” that the company has trademarked. The immediate order was to stop the use of those words when selling food, products and services and “all packaging, marketing materials, advertising, photographs and Internet usage.”
In November 2018 [16], two consumers filed legal action against Washington State’s Pinnacle Foods Inc. that has registered the word “Hawaiian” and sells “Hawaiian®Kettle Style Potato Chips” made in Algona, Washington. The product packages feature tropical scenes unique to Hawaii, such as palm trees by the beach with hula dancers and Diamond Head, considered by the plaintiffs as “false and deceptive advertising” by a company practicing “fraudulent and unfair business practices.”
On the other side of the world, packets of counterfeit Starbucks instant coffee were found in Chinese supermarkets, some sold by unauthorized distributors [17].
The FDA considers the above as typical examples of cases that are not of public health concerns. These industry practices clearly do not align with consumer expectations of truthful and not misleading behavior. Misbranding also supports consumer contention that the food industry is neither honest nor trustworthy.
Recent foodborne illnesses might be conveying a new function for the responsibility statement. As of June 28, 2018, contaminated romaine lettuce caused 210 illnesses and five deaths in 36 states. When by early December 2018, another 59 reportedly fell ill across 15 states from another romaine lettuce outbreak, the FDA (2018) suggested to the industry to declare on the product label the harvest region and the date of harvest of the romaine lettuce. The FDA suggestion implied that not knowing where and when the romaine lettuce was harvested affected public health.
Recommendations made recently by Warner et al. (2019) [18] reinforced previous findings by Hodgson and Bruhn (1993, 1992) [3] and supported the FDA suggestion on romaine lettuce that the geographical origin of the food is important information and should be declared. Warner et al. (2019) [18] recommended that U.S. seafood traceability regulations be expanded to include detailed catch documentation for all seafood declaring where a fish was caught, by what means, and if farmed. They also discouraged the use of over-encompassing generic names that may not differentiate health risks in various specific species, conservation status, and environmental and economic impacts.
Methodology
This study focuses on measuring the response of consumers to honest branding (or truthful or not misleading branding) versus dishonest branding (or misbranding or deceiving branding). Most surveys used in research studies presented one question at a time to the respondent who was then instructed to answer the question. The answer depended on the respondent’s recollection of information, experience, and biases related to the question. Sometimes, the respondent attempted to guess what answer the interviewer expected (called interviewer bias) or might have crafted the answer to be politically correct. In addition, neither surveys nor focus groups defined the mindset of the individual regarding the practice of misbranding.
Mind Genomics and the BiMiLeap™ app
Mind Genomics is an emerging science that uses conjoint measurement to understand how people respond to ideas and make decisions. Instead of presenting the stimuli one at a time as is done in most surveys and focus groups, the stimuli are presented to the respondent in the form of combinations or mixtures of messages (vignettes). People react to the combinations in an intuitive way, without deep consideration, a feature which provides insight not ordinarily emerging from other consumer research forms. Interviewer bias and attempts by the respondent to game the researcher disappear when experimental design is used to create the test stimuli, as in the Mind Genomics procedure reported here [19] It has been used in a wide range of topics from marketing [20], consumer product goods [21], product design and development [19], consumer mindsets toward food safety messages [22], consumer mindsets regarding raw beverages [23], and professional caregiving [24].
For this study, an app to Mind Genomics called BiMiLeap™ (Zemel, 2018) [23] was used. The BiMiLeap™ app is set up as a Socratic tool to encourage the researcher to use critical thinking about a topic. Four silos (questions) were created, which when read sequentially suggested a story. Each question, in turn, was answered in four ways (elements). The silos were never presented to the respondents but rather used by the researcher to elicit the different answers. The elements were combined into vignettes, each telling a story. Each respondent received 24 vignettes created by experimental design with the property that all 16 elements appeared equally often and with statistical independence in the 24 vignettes evaluated by a respondent. Furthermore, each set of 24 vignettes was unique, so that the vignettes covered a wide range of combinations. The BimiLeap™ app presented the vignette, acquired the response, measured the response time, and at the end of the study, did all the analyses and delivered a full PowerPoint report in approximately one hour, including the full report created two minutes after the study closed. This would be the first time that the BiMiLeap™ app was used to study misbranding.
Recruiting Respondents
Mind Genomics studies work with a wide range of base sizes [25]. Since each respondent evaluates a totally unique set of vignettes, small base sizes can be used. It is not necessary to reduce the sampling error by repeating a fixed set of test stimuli many times with many panelists. Previous studies have shown that smaller sizes of 8-10 may be used because the resulting coefficients are stable [25]. For this study, a small, affordable yet meaningful (and now standard) base of 30 respondents was obtained by Limbic Reviews (Chicago, IL) from a commercial recruiting house and field service specializing in so-called e-panels. Standard guidelines for recruiting, such as the requirement that the respondent agree in two separate places to participate in internet-based interviews (double opt-in) were followed by the commercial company. The only qualifying requirement for a panelist was that she or he be the principal shopper in the home. The panel was to comprise approximately equal numbers of males and females, and equal numbers of four ethnic groups (White, Black/African American, Asian, and Hispanic).
An email invitation that listed only the topic of the project was sent to an undisclosed number of potential respondents and those who decided to continue with the study were given an embedded link for the actual study. The precise number of survey invitations, and thus the completion rate, was not disclosed because the percent of completed interviews as a function of invitations sent is considered a trade secret in the consumer research industry.
The Experimental Design
An experimental design of four-by-four (Table 1) was created by BiMiLeap™ to keep the study small, simple and cost-effective. Four questions (silos) representing different characteristics of misbranding were identified and written as broadly as possible in order to capture the different notions that the respondents might have for misbranding. The four questions chosen for this study began with direct claims about the product inside the package (Question A), proceeded to the congruence of package or label with the product inside (Question B), then to what the label did (Question C), and finally how the respondent felt when thinking about the product (Question D). The seriousness of the problems relative to misbranding was embedded in the answers to each question.
Design Number
Total Number of Elements
Number of Categories
Elements in Each Category
Elements in Each Concept (Min-Max)
Concepts Tested by Respondent
1
12
3
4
2-3
20
2
15
3
5
2-3
25
3
18
3
6
2-3
30
4
30
3
10
2-3
50
5
12
4
3
2-4
20
6
16
4
4
2-4
24
7
20
4
5
2-4
30
8
24
4
6
2-4
36
9
36
4
9
2-5
60
10
20
5
4
2-4
25
11
24
6
4
2-4
36
12
36
6
6
2-4
48
13
28
7
4
2-4
49
14
35
7
5
2-4
63
Four different answers (elements) that a person might realistically encounter in daily living and that made sense were selected for each question to form a structured manner of thinking about misbranding. The elements were derived from searches of publications-scientific or business, brainstorming, what might have been read on a food label or advertisements, or experience. The elements need not have happened, but could have happened in the past, or could happen in the future. A simple declarative statement is used for every element to couch as a fact.
Creating easily read, concise, and understandable questions (silos) and answers (elements) is critical to the Mind Genomics approach. The initial creation phase of this four-by-four matrix produces unstructured silos and elements. Several iterations are usually prepared until the silos and the elements per silo are logical, relevant, and make sense. Thus, a systematic way of thinking emerges with time and experience; i.e., it becomes increasingly easier to create the matrix of questions and answers. The final silos and elements appear in (Table 2).
Question A: (direct claim) How congruent are the claims about the product stated on the package and the actual facts regarding the product inside the package?
A1
All contents were grown, raised, harvested in the geographical location stated on the label
A2
Majority of contents were from the geographical location on the label
A3
Majority of contents were from a geographical location other than that stated on the label but cooked then packaged in the geographical location on the label
A4
Majority of contents were from a geographical location other than that stated on the label, not cooked but repackaged in the geographical location on the label into different packages and different package amounts
Question B: (implied claim) How congruent is the label or vignette with the terroir or with the product?
B1
Name or brand or vignette of the product is consistent with the manufacturer’s location declared on the package
B2
Name or brand or vignette of the product is consistent with the product contained in the package
B3
Name or brand or vignette of the product and the manufacturer’s location do not make sense
B4
Name or brand or vignette of the product and the product are not compatible
Question C: (label) – What does the label do?
C1
Label makes me think of certain geographical locations
C2
Label uses words implying where the product is made
C3
Label implies product is authentic
C4
Label makes me feel the product is of good quality
Question D: (tag lines and appeals to emotion) – What does the product signify?
D1
Product is special… not ordinary
D2
Product will make a nice gift to friends from a trip
D3
Product’s high price is justified
D4
Product is known as exotic
An experimental design mixed and matched the 16 elements and presented the combinations of messages to the respondents as vignettes in a web-based platform. Each vignette had one or often no element from each of the four silos. Each element appeared an equal number of times. No vignette comprised more than four elements and there were always silos absent from the vignette, allowing the elements to appear statistically independent of each other. The absolute coefficients could then be estimated; that is, the values of the coefficient were all relative to zero. A coefficient of 10 is twice as high as a coefficient of 5. In the absence of elements, a coefficient of 10 means that 10% of the responses will be strong (ratings of 7-9 in a 1-9 rating scale) whereas a coefficient of 5 means that 5% of the responses will be strong. The absolute value of the coefficient makes it comparable from study to study for different topics and different respondents.
A statistical algorithm ensures the uniqueness of vignettes for each respondent ([19, 26]). Each respondent evaluated a unique set of 24 vignettes but with the same 16 elements. A total of 720 sets of combinations (30×24) was created for 30 respondents. The basic experimental design was guaranteed by a permutation strategy which maintained the underlying mathematical structure but changed the actual combinations. The strategy of Mind Genomics is to look at various slices of the possible combinations of misbranding behavior, metaphorically similar to the Magnetic Resonance Imaging taking pictures of slices of the brain. This way, the meaning of the concept of misbranding is built by inductive means, i.e., what works in the mind of the respondents is deduced even when the respondent could not articulate it. Mind Genomics expands the depth of information obtained from surveys, focus groups and other commonly used consumer research forms.
Web-based Consumer Interview
The study began with an Orientation Page that gave a brief overview to the respondent, who chose to participate in the study, of what would be encountered. The topic was presented in one sentence and the respondents were told to evaluate a set of vignettes. They were instructed to consider all the elements presented in a vignette as a description of one food product. They were also told that the survey would take approximately 4-5 minutes.
Vignettes were presented in an easy-to-read fashion set up for a smartphone, a tablet, or a laptop. An introduction was at the top of the vignette followed by combination of the 2-4 answers (elements) in the center. The vignette had at most one element from each silo (one answer per question), but most vignettes comprised 2-3 elements instead of four. (Figure 1) shows an example of a vignette used in the study. No effort is made to connect the elements, based upon the assumption that most respondents graze for information rather than read the vignette.
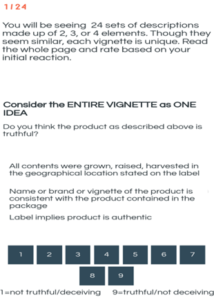
Figure 1: An example of vignette used in the study.
Towards the bottom of the same vignette was a typically bipolar Likert rating scale consisting of nine points, with the lowest (1=“not truthful/deceiving”) and the highest (9=“truthful/not deceiving”) scale points anchored with descriptors. The respondents were instructed to rate the entire vignette using that scale and their rating was recorded. When the respondent had chosen a rating, the next page was automatically presented without the respondent having to click a “next” button. This vignette layout prevented the respondent from connecting the different combinations.
After the respondent evaluated the 24 test vignettes, the respondent proceeded to a self-profiling classification that provided additional information regarding the respondent’s gender and age, and how frequently the respondent shopped for food or cooked.
Regression-based Data Analysis
Data from all 30 respondents were combined creating a database of 720 vignettes, many of which are different from each other. The responses on the 9-point rating scale were transformed to binary 0 (=no) and 100 (=yes), so that the metric information was converted to information about membership in a group. The binary scale of absent/present makes it possible to understand the part-worth contribution of each element. The ratings of 1-7 were transformed to 0 to signify the fact that the combination of elements denoted the respondent’s notion of less honest. The ratings of 8-9 were transformed to 100 to denote that the combination of elements represented the respondent’s notion of definitely honest. In later computations, this transformation is named as Top2 Box, referring to the top two ratings of the scale (8-9). A second binary scale converted the ratings of 1-2 to 100, signifying definitely dishonest (or misbranded or deceiving) whereas the ratings of 3-9 were converted to 0 for less dishonest branding. This transformation is referred in later computations as Bottom2 Box to signify the bottom two ratings of the scale (1-2). A small random number (<10-5) was added to every binary value to ensure that the regression model could be estimated. Since labels that are misbranded have economic and potentially public health impacts, most of the focus of our interpretation of our results are on misbranding or deceptive or dishonest elements.
Two ordinary least squares (OLS) regressions were used. The first created models (equations) to relate the presence or absence of the 16 elements to the binary transformed ratings and the second related to response times. The regression modeling is not influenced by the order of testing or which respondent is answering. The regression model tries to fit a simple linear equation of the form below, comprising an additive constant k0 and 16 coefficients k1 to k16, with one coefficient corresponding to each of the 16 answers (elements) in the study. A-D are the four questions (silos).
Binary Rating = k0 + k1(A1) + k2(A2)…k16(D4)
The additive constant, k0, is an estimated value or parameter of the binary response in the absence of elements. The additive constant gives us a baseline feeling in the absence of elements.
Results and Discussion of Results
Elements that resonated in the mind of the respondent as misbranding
OLS regression deconstructed the responses to the vignettes into separate contributions from each element in terms of the coefficients of honest (Top2 Box), coefficients of dishonest (Bottom2 Box), or response time. Detailed analysis was begun by looking at the statistical output for the OLS regression analysis for the ratings of misbranding or deceptive or dishonest branding. All three terms are used interchangeably. The regression data appear in (Table 3).
The analysis was based on the Grand Model that included all of the relevant data from the appropriate respondents in one overall regression analysis. The magnitude of their coefficients defined the key elements. (Table 3) shows the parameters of the full OLS regression for dishonest branding, i.e., the binary transformation of the ratings 1-2 on the 9-point scale to 100 (denoting Bottom2 Box, misbranding, deceptive, or dishonest branding) and ratings 3-9 to zero (denoting not misbranded, not deceptive, or not dishonest branding). (Table 3) presents the estimated coefficient, the t-test for the coefficient, and the p-value for each of the 16 elements.
Elements
Model relating elements to the binary transformation to Misbranding or Deceptive or
Dishonest Branding (Bottom2 Box)Coefficient
t-test
p-value
Additive Constant (Probability of saying misbranded or deceptive or dishonest or not truthful/deceiving in the absence of the elements)
6.11
0.95
0.34
A3
Majority of contents were from a geographical location other than that stated on the label but cooked then packaged in the geographical location on the label
6.95
1.78
0.08
B3
Name or brand or vignette of the product and the manufacturer’s location do not make sense
5.28
1.34
0.18
A1
All contents were grown, raised, harvested in the geographical location stated on the label
4.26
1.08
0.28
C3
Label implies product is authentic
3.97
1.01
0.31
A2
Majority of contents were from the geographical location on the label
3.51
0.91
0.37
D1
Product is special… not ordinary
3.27
0.84
0.40
A4
Majority of contents were from a geographical location other than that stated on the label, not cooked but repackaged in the geographical location on the label into different packages and different package amounts
2.79
0.71
0.48
C2
Label uses words implying where the product is made
0.08
0.02
0.98
B3
Name or brand or vignette of the product and the manufacturer’s location do not make sense
-0.21
-0.05
0.96
C4
Label makes me feel the product is of good quality
-0.19
-0.05
0.96
B2
Name or brand or vignette of the product is consistent with the product contained in the package
-0.82
-0.21
0.83
C1
Label makes me think of certain geographical locations
-0.83
-0.21
0.83
B1
Name or brand or vignette of the product is consistent with the manufacturer’s location declared on the package
-1.01
-0.26
0.80
D4
Product is known as exotic
-1.00
-0.26
0.80
D2
Product will make a nice gift to friends from a trip
-1.19
-0.31
0.76
D3
Product’s high price is justified
-2.13
-0.55
0.58
The coefficient for an element indicated the expected change in the conditional probability of a vignette being rated 1-2 (misbranded, deceptive, or dishonest branding) when the element is incorporated in the vignette. The additive constant represented the conditional probability of a vignette being rated 1-2 in the absence of any elements. The additive constant is an estimated parameter but is a useful indicator of the respondent’s predisposition to rate the vignette as definitely misbranded, deceptive, or dishonest branding.
Based upon observations of data from thousands of experiments and the knowledge gained about what actually happens in the world, Moskowitz [24] identified a set of qualitative rules of thumb about the values of the coefficients. That is, the higher the positive coefficient, the more important the corresponding element, but the observed patterns should also make sense.
Coefficient
Qualitative Significance
>15
Extremely important; a major signal
8 to 15
Important to very important
0 to 8
From irrelevant to almost important
0 to -6
From irrelevant to almost important
< -6
Important
To determine if the coefficients observed from this study on misbranding were important, t-statistic, which is the ratio of the observed coefficient to the standard error of the coefficient, was calculated. High t-test values of at least >1.60 (or preferably > 2.00) denoted that the coefficient was important. In this study, the result that indicated respondents who strongly considered a product with “majority of contents were from a geographical location other than that stated on the label but cooked then packaged in the geographical location on the label” (t-test=1.78) as dishonest or misbranded or deceiving, was important. This agreed with the results of Hodgson and Bruhn (1993, 1992) and was a pattern that made sense.
Mindsets about What Constitutes Misbranding
The name Mind Genomics is a metaphor of Genomics, the branch of biology that studies all genes and how they combine to influence the growth and development of different organisms. Mind Genomics identifies the different mindsets of people, operationally defined as individuals who have different responses when they evaluate the same things, usually the material from everyday life.
Mindsets are generated by statistical analysis, coupled with interpretation. For our data, each respondent generated 16 coefficients, one for each of the 16 elements. The coefficients emerged from the regression analysis for each respondent, after the ratings of 1-2 were converted to 100 (misbranded, deceptive, or dishonest) and the ratings of 3-9 were converted to 0 (not misbranded, not deceptive, or not dishonest). After the 30 sets of 16 coefficients were generated, the k-means clustering program identified two complementary and exhaustive groups of respondents, with the property that the patterns within a group or cluster were similar and the centroids of each group or cluster were different from each other. Clustering is a standard method in statistics that groups an array of stimuli into non-overlapping clusters.
In this study, the Mind Genomics system generated a two-cluster and a three-cluster solution. The ideal is to choose the least number of clusters while at the same time ensuring that the clusters are coherent and can be named. Thus, the two-segment mindset was chosen and, because parsimony made sense (i.e., the solution generated the fewest individual segments that were still interpretable), yielded clear descriptions of the segmented mindsets. The two-segment mindsets (Table 4) that emerged can be called “Terroir Reader” (Mindset 1) and “Suspicious of Puffery” (Mindset 2). The mindsets are named according to the elements that scored most highly in the scale of Bottom2 Box (misbranded, deceptive, or dishonest branding). Element
Coefficients from Model for Dishonest Branding defined as Bottom2 Box
(ratings 1-2 converted to 100)Total
DisSeg1
DisSeg2
Additive constant (probability of stating misbranding)
6
4
7
***
***
***
Mindset 1 – Terroir Reader
B3
Name or brand or vignette of the product and the manufacturer’s location do not make sense
5
12
-5
A3
Majority of contents were from a geographical location other than that stated on the label but cooked then packaged in the geographical location on the label
7
8
6
A4
Majority of contents were from a geographical location other than that stated on the label, not cooked but repackaged in the geographical location on the label into different packages and different package amounts
3
7
-4
Mindset 2 – Suspicious of Puffery
C3
Label implies product is authentic
4
-2
14
C4
Label makes me feel the product is of good quality
0
-5
9
C1
Label makes me think of certain geographical locations
-1
-6
8
D1
Product is special… not ordinary
3
0
8
D2
Product will make a nice gift to friends from a trip
-1
-6
7
Operationally defined as not misbranded, not deceptive, or not dishonest
A1
All contents were grown, raised, harvested in the geographical location stated on the label
4
5
3
C2
Label uses words implying where the product is made
0
-1
3
A2
Majority of contents were from the geographical location on the label
4
6
-1
B2
Name or brand or vignette of the product is consistent with the product contained in the package
-1
1
-1
D3
Product’s high price is justified
-2
-2
-2
D4
Product is known as exotic
-1
1
-3
B1
Name or brand or vignette of the product is consistent with the manufacturer’s location declared on the package
-1
2
-7
B4
Name or brand or vignette of the product and the product are not compatible
0
5
-7
The elements which scored highest (indicating misbranded or dishonest or deceiving branding) for Mindset 1 (Terroir Reader) were:
- Name or brand or vignette of the product and the manufacturer’s location do not make sense (coefficient=12).
- Majority of contents were from a geographical location other than that stated on the label but cooked then packaged in the geographical location on the label (coefficient=8).
- Majority of contents were from a geographical location other than that stated on the label, not cooked but repackaged in the geographical location on the label into different packages and different package amounts (coefficient=7)
The elements which scored highest (indicating misbranded or dishonest or deceiving branding) for Mindset 2 (Dislikes Puffery) did not make as much sense. It was as if the respondents were suspicious of labels and statements about the product. It was almost as if they went in with a negative attitude against anything that was implied. They felt that deceptive advertising was not about the facts but rather their feeling that advertising without facts was fraudulent:
- Label implies product is authentic (coefficient=14).
- Label makes me feel the product is of good quality (coefficient=9).
- Label makes me think of certain geographical locations (coefficient=8).
- Product is special… not ordinary (coefficient=8).
- Product will make a nice gift to friends from a trip (coefficient=7).
Conclusions
The application of Mind Genomics into understanding how statements on food labels with geographical indications are perceived indicated that food labels are truthful and honest when the “Name or brand or vignette of the product is consistent with the manufacturer’s location as declared on the package.”
Two mind-sets emerged with different interpretations of deceiving (misbranding). Mindset 1 (Terroir Readers) considered it misbranded when the “Name or brand or vignette of the product and the manufacturer’s location do not make sense,” or the “Majority of contents were from a geographical location other than that stated on the label but cooked then packaged in the geographical location on the label,” or the “Majority of contents were from a geographical location other than that stated on the label, not cooked but repackaged in the geographical location on the label into different packages and different package amounts.” Mindset 2 (Suspicious of Puffery) considered labels misbranded when they feel that advertising occurs without facts or is fraudulent. Results indicated that both mindsets agreed on the need for truthful and honest food labels with geographical indications. Consumer behavior towards misbranded foods had previously appeared in legal documents of trade negotiations. The application of Mind Genomics to other aspects of consumer behavior expands this field of scientific studies.
Sponsors and Grants: This research did not receive any specific grant from funding agencies in the public, commercial, or not-for-profit sectors.
Acknowledgement: The authors thank the partial support of Premium Postdoctoral Research Program of the Hungarian Academy of Sciences.
References
- Newman CL, Turri AM, Howlett E, Stokes A (2014) Twenty Years of Country-of-Origin Food Labeling Research: A Review of the Literature and Implications for Food Marketing Systems. Journal of Macromarketing 34: 505-519.
- Agricultural Marketing Service (AMS) (2016) Removal of Mandatory Country of Origin Labeling Requirements for Beef and Pork Muscle Cuts, Ground Beef, and Ground Pork. https://www.federalregister.gov/documents/2016/03/02/2016-04609/removal-of-mandatory-country-of-origin-labeling-requirements-for-beef-and-pork-muscle-cuts-ground
- Hodgson AS, Bruhn CM (1992) Geographical names on product labels: Consumer attitudes toward their use. Food Technology 46: 83-89.
- Smith G (2018) Consumer group unmasks the dirtiest tricks of food labeling.
- Gervis Z (2018) Most people think food labels are misleading. NewYorkPost. https://nypost.com/2018/06/07/most-people-think-food-labels-are-misleading/
- Hodgson AS, Bruhn CM (1993) Consumer attitudes toward the use of geographical product descriptors as a marketing technique for locally grown or manufactured foods. Journal of Food Quality 16:163-174.
- Caswell J (1998) How Labeling of Safety and Process Attributes Affects Markets for Food. Agricultural and Resource Economics Review, 27: 151-158.
- Dunne J, Chambers K, Giombolini K, Schlegel S (2011) What does ‘local’ mean in the grocery store? Multiplicity in food retailers’ perspectives on sourcing and marketing local foods. Renewable Agriculture and Food Systems 26: 46-59.
- Sanchez MC (2018) Misbranding. In Food Law and Regulation for Non-Lawyers, pp. 101-131. Springer International Publishing, New York.
- Shiffrin SV (2018) Deceptive Advertising and Taking Responsibility for Others. The Oxford Handbook of Food Ethics (edited by Barnhill, A., Budolfson, M. and Doggett, T.), Oxford University Press, 2018; Public Law & Legal Research Paper Series, UCLA School of Law Research Paper No 15-28: 470.
- Watson KW (2016) Reign of Terroir. How to Resist Europe’s Efforts to Control Common Food Names as Geographical Indications. CATO Institute Policy Analysis Series, Number 787.
- Gangjee D (2012) Part I – Part. In Relocating the Law of Geographical Indications. Cambridge Intellectual Property and Information Law 19-180.
- Watson E (2018) FDA to ‘modernize certain standards of identity’ as part of strategic policy roadmap. FoodNavigator-USA.com. January 13.
- Bel/Kaukauna USA – Company Profile, Information, Business Description, History, Background Information on Bel/Kaukauna USA. (N.D.). Referenceforbusiness.com.
- Fimrite P (1996) Scalding Affidavit on Coffee Fraud/Kona-gate grinds on, may spur regulation Chronical East Bay Bureau.
- HawaiiNewsNow (2018) Consumers sue potato chip maker over use of Hawaiian name. November 28.
- Paul P (2019) Sale of Fake Starbucks Coffee in Chinese Supermarkets Coming To An End. International Business Times, March 19.
- Warner KM, Roberts W, Mustain P, Lowell B, Swain M (2019) Casting a Wider Net: More Action Needed to Stop Seafood Fraud in the United States. Oceana March 2019.
- Moskowitz HR, Porretta S, Silcher M (2005) Concept Research in Food Product Design and Development. Hoboken, New Jersey: Wiley-Blackwell Publishing 612pp.
- Green PE, Rao VR (1971) Conjoint Measurement for Quantifying Judgmental Data. Journal of Marketing Research 8: 355-363.
- Green PE, Srinivasan V (1990) Conjoint Analysis in Marketing: New Developments with Implications for Research and Practice. Journal of Marketing 54:3-19.
- Saulo AA, Moskowitz HR (2011) Uncovering the mind-sets of consumers towards food safety messages. Food Quality and Preference 22: 422-432.
- Zemel R, Gere A, Papajorgji P, Zemel G, Moskowitz H (2018) Uncovering Consumer Mindsets Regarding Raw Beverages. In Food and Nutrition Sciences 9: 259-267.
- Gabay G, Ellis J, Frazier N, Agyemanj C, Gere A, Zemel R, Moskowitz H (2019) What Resonates about Professional Caregiving in the Mind of the Ordinary Person? Ageing Science and Mental Health Studies 3: 1-13.
- Moskowitz HR (2012) ‘Mind genomics’: The experimental inductive science of the ordinary, and its application to aspects of food and feeding. Physiology & Behavior 107: 606-613.
- Consillio K (2018) Chicago chain Aloha Poke threatens poke shops with similar names. Star Advertiser.
