Publication Information
ISSN: 2641-6859
Frequency: Continuous
Format: PDF and HTML
Versions: Online (Open Access)
Year first Published: 2018
Language: English
| Journal Menu |
| Editorial Board |
| Reviewer Board |
| Articles |
| Open Access |
| Special Issue Proposals |
| Guidelines for Authors |
| Guidelines for Editors |
| Guidelines for Reviewers |
| Membership |
| Fee and Guidelines |
 |
Territorial Model of Integrated Epidemical Control as a Functional Standard of a Practical Epidemiology
Armine Andryan*
National Center for Disease Control and Prevention, MOH, Shirak branch, Armenia
Received Date: July 22, 2022; Accepted Date: August 02, 2022; Published Date: September 09, 2022
*Corresponding author: Armine Andryan, National Center for Disease Control and Prevention, MOH, Shirak branch, Armenia. Email: anarmine@mail.ru
Citation: Andryan (2022) Territorial Model of Integrated Epidemical Control as a Functional Standard of a Practical Epidemiology. Adv Pub Health Com Trop Med: APCTM-164.
DOI: 10.37722/APHCTM.2022405
Introduction
Public healthcare programs must ensure an optimum distribution of tasks and an integrated analysis of incoming information. Improvement and expansion of standard formation and standardization process in Health system is an urgent and grown-up problem, which will enable to realize the problems and find ways to solve them. As a result, the quality of hygiene-epidemical control will be improved, which in fact, is an ultimate goal of every Health system.
Standard is a model, which is accepted as a starting point for evaluating objects or situations. Standardization is the definition and the use of a norm, criterion or rule for the assessment of the functions of a certain field.
Standards are not only stereotypes, but also very flexible models, which not only obligate the specialist – researcher’s mode of action, but also give opportunities for spreading alternative approach.
Model as a type of standard is a defined and established order of activity field, where functional regulated list, and analyzing and evaluating criteria of the situation are listed.
Goal
The work is aimed at the model of hygiene-epidemical control: creation of the informational database of epidemiology and related fields and integrated analysis and standardization of the assessment of the situations.
Materials and Methods
44 years old /1977–2021 / and informational material of epidemiological significance of Shirak region’s different services was used as research material, for processing of which current and retrospective epidemiological, regressive and correlative analysis’ statistics, Arc GIS geographic informational – analytical computer program methods were applied.
For development of the standards of the territorial model of integrated epidemiological control and diseases’ qualitative and quantitative possible predictions, local and international professionals’ perennial experience was taken into consideration.
The NCDCP in Shirak marz in Armenia (Figure 2) has tracked epizootic data since 1954 and human infectious diseas from 1977. All cases were analyzed by retrospective cohort epidemiological and statistical methods to determine correlation between disease severity and natural factors, including air temperature, humidity, and outbreak location, and carrier and vector prevalence. Correlation coefficients and odds ratios for risk factors for each disease were calculated, and “high risk” was defined by correlation coefficient (correlation >95%, p-value <0.05) and odds ratio (OR >1). Establishment of the database, assessment of geographical risks, and mapping were accomplished using Arc-GIS [1-5].
Discussion of the Results
Partial testing indexes for finding out the chronology of certain high inflectional diseases and for evaluating the diseases’ epidemical situation used in Shirak region for prediction of the risk of the rising intestinal infections as testing receptive are worked out by us. The components of epidemiology are also calculated for each infection proceeding from the size of the disease of that period and the part of disease, exceeding its normal degree of disease’s epidemical threshold level (Figure 1).
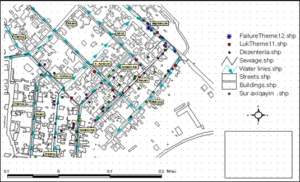
Figure 1: Map of outbreaks of waterborne enteric infection with prevalence of consecutive cases integrated with waterline flow direction.
These standards are at the same time receptive and give us the opportunity to seek and find the epidemiological link between the recorded cases and to determine the level of possible epidemical disease [5-8].
According to the data of integrated epidemiological analysis, in the frames of qualitative and quantitative predictions, epidemiological regularities were received and revealed for many times during the last five years with the help of statistic analysis based on the periodical կենսառիթմե of separate infections. These standards gave us the opportunity to asses the qualitative schedule of the occurrence risk of intestinal infections, which are the dates of the maximum diseases’ possible prevision of the given physiological pattern. Developed risk dates are regular and recurrently repeated. In Shirak region regularities of the risk date, as example is used to provide for years of high diseases and asses the epidemiological threshold of out braking diseases, based on the quantitative prevision indexes [9-10].
Outbreak records were integrated with veterinary, parasitological, entomological, meteorological, and geographical data; risk factors impacting infectious diseases; and demographic and household data. Changes in risk factors affected the odds ratio for disease emergence (OR=1, 5-3, 6). For example, though there were zero tularemia epizooties in the last ten years in Shirak Province, the integrated analysis predicted that the epidemiological threshold had been surpassed and pinpointed the at-risk population, based on increases in rodent and vector populations, warmer temperatures, and increases in agricultural field work (Figure 3). In 2017, four cases of tularemia were recorded in field workers, confirming the prediction. Similarly, risk factors for other infections were mapped against outbreak time and location to identify the dominant risk factor. In many cases, the same factors influenced multiple diseases (e.g. diseases transmitted by the same vector). Studies have been performed on anthrax, brucellosis, erysipeloid, leptospirosis, plague, tularemia and yersiniosis [10-15].
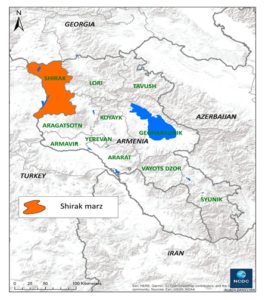
Figure 2: Study region, Shirak marz.
Aggregation and comparation of various data by geographical information system analysis gives us the opportunity to create new information material. In Shirak region risk areas with their risk groups are assessed by integration of the information material of different areas / mapping of the activity of water supply – drainage system, geographical picturing of topography of food supply and food trading buildings /places/, presentation of the distribution of organized collectives, geography of the activity of cattle-breeding, prevalence of the of especially dangerous infections, observing material of the activity of agricultural sector.
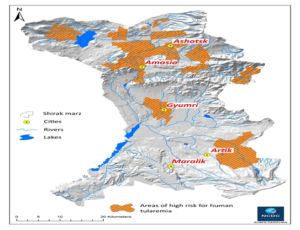
Figure 3: Areas of high risk for human tularemia in the Shirak marz.
In Shirak region, having the risk time, risk area and risk group of the separate infections, quantitative standards of the diseases were defined, based on the seasonal specifics of the infections, density of the distribution of different buildings of epidemiological importance in the area and data of the group isolation in organized collectives (Figure 4).
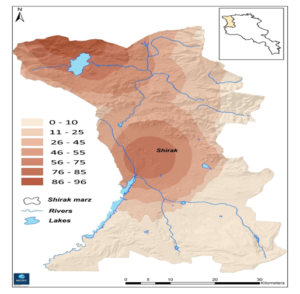
Figure 4: Areas of risk for human brucellosis in the Shirak region. Gradation of human cases (from 0 to 96).
The arrangement of the orientation data of epidemiological control and established order is formed with the help of the use of the opportunities of informational technologies. The system, i.e. the model of epidemiological control is formed as a result of the development of multiple voluminous informational material and integrated analysis. The functional system of integrated epidemiological control is the example of the territorial model, where the sequence /order/ and succession of distinct regulated actions.
Territorial model is a standard for any territory and with the help of its criterion the classification and stratification of database is formed in card-schedule of the computer program and integration of the data between different layers / making situational analysis and mapping/, it must be reshaped for other territories and coordinate with the epidemiological peculiarities and regularities of the given territory for realistic analyze and evaluation of the aggregation of the data. It is a standard and an assortment of indexes from the side of the principality of their development. Standard criteria or models should be formulated taking into account the regional and ethnic differences, providing the opportunity to make changes and additions in the local, national and regional level [10-16].
Conclusion
Thus, with the model principle, the percentage of the compliance of the proposed problem and results is high. There is a sensible steadiness between the difficulty of the problem and the effectiveness of the work in such systemic mode of action.
Realization of the compulsory requirements of the reports worked out by the model principle with stage by stage use of the functional model links, gives the opportunity to make valuable research with the evaluation of the completeness without omissions and errors. And the identification of the data under conditions of the standard model system functioning becomes an important reason for valuable analysis and effective assessment of the situations. The model contains the assessment of the accomplished results according to the completeness of the results.
Forty four years of data were analyzed to assess dominant risk factors and create a territorial model for integrated epidemiological surveillance. Based on risk factor, locality and timeframe characteristics of infection transmission pathways were determined, revealing cause-and-effect relationships. Aggregation and integration of long-term data identified high-risk regions where epidemiological surveillance must be strengthened by making it rational, operative, and targeted, and making the analysis comprehensive and multifunctional.
In emergency situations the amount of the martial and physical damages decreases, which is an important component of the quality of the hygienic-epidemiological service. The realizations of the functions with the help of Standard model detect and reduce the errors arising from the imperfection of the system [16-18].
References
- Vanyan AV, Andryan AA, Danielyan RR, Niazyan LG, Davidyanc VA (2018) Principles and application of working with ArcGIS geographic information system in the field of epidemiology. Methodical guide 172.
- Barnes S, Peck A (1994) Mapping the future of health care: GIS applications in Health care analysis. Geographic Information Systems 4: 31-33.
- Bregvadze TZ, Tabagai SI (2001) Geographic international systems for Public Health and Epidemiology. CDC // Morbid. Mortal. Wkly Rep 48: 1009-1012.
- Charke KC, Osieeb JR, Sherry JM, Meert JP, Larsson RW (1991) The use of remote sensing and geographic information systems in UHICEF’s dracunculiasis (Guinea worm) Eradication effort 11: 229-235.
- Chentsov SV, Krivshich DV (1998) An Information System “Public Health – The Environment” Geoinformation Systems (GIS) and GIS- technologies 8: 460.
- Clarke KC, Osleeb JR, Sherry JM, Meert JP, Larsson RW (1991) The use of remote sensing and Geographic Information Systems. Geographic Information Systems in UNICEF’s dracunculiasis (Guinea worm) eradication effort. Prew Vet 11: 229-235.
- Clarke KC (1995) Analytical and computer cartography. Englewood Cliffs Prentice-Hall, 1995, 88.
- Dangendorf F,Herbst S, Reintjes R, Kistemann T (2002) ‘Spatial patterns of diarrhoeal illnesses with regard to water supply structures – a GIS analysis. International Journal of Hygiene and Environmental Health 205: 183-191.
- Goodchild MF (1992) Geographic information science. International Journal of Geographic Information Systems 6: 56.
- Jones J, Lerdthusnee K, Nigro J, Kiang R (2004) Use of GIS to assess relative risk in different Vaccines for Enteric // Conference Papers 452.
- Green C, Krause D, Wylie J (2006) A real-time GIS for surveillance Spatial analysis of campylobacter infection in the Canadian province of Manitoba. International Journal of Health Geographics 447-449.
- Kelly T, McKee Jr, Timothy M, Pamela R, Jenkins J, Zenilman M, Gregory E (2000) Glass Application of a Geographic Information System to the Tracking and Control of an Outbreak of Shigellosis. Clinical Infectious Diseases 31: 728-733.
- Kistemann T, Zimmer S, Vagsholm I, Andersson Y (2004) GIS-supported investigation of human EHEC and cattle VTEC O157 infect. Epidemiology and Infection 225-227.
- Lebel G, Rivest S, Douville-Fradet M (2005) The Integrated System for Public Health Monitoring of West Nile Virus (ISPHM-WNV): a real-time GIS for surveillance and decision-making. Int J Health Geogr
- Tempalski BJ (1994) the case of Guinea worm: IS as a tool for the analysis of disease control policy. Geographic international Systems 4: 32-38.
- Weisdorf D, Snover D, Haake R, Miller J (1990) Acute upper gastrointestinal graft-versus-host disease: clinical significance and response to immunosuppressive therapy. Blood 76: 624-629.
- Kristen SK, Wilpen LG. GIS tutorial for Health ESRI press 2006-2007.
- Laura Lang GIS for Health organizations. ESRI Press 2006-2007.