Publication Information
ISSN: 2641-6859
Frequency: Continuous
Format: PDF and HTML
Versions: Online (Open Access)
Year first Published: 2018
Language: English
| Journal Menu |
| Editorial Board |
| Reviewer Board |
| Articles |
| Open Access |
| Special Issue Proposals |
| Guidelines for Authors |
| Guidelines for Editors |
| Guidelines for Reviewers |
| Membership |
| Fee and Guidelines |
 |
Spinal Muscular Atrophy Repair through Coordination Dynamics Therapy and Translation of Frog Neuromuscular Innervation Pattern Changes Caused by Neurotrophins to Human
Giselher Schalow*
(Non-Government-Organized-Medical-Research)
Received Date: March 19, 2022; Accepted Date: March 24, 2022; Published Date: April 22, 2022;
*Corresponding author: Giselher Schalow, NGOMR: Non-Government-Organized-Medical-Research. Email: g_schalow@hotmail.com
Citation: Schalow G (2022) Spinal Muscular Atrophy Repair through Coordination Dynamics Therapy and Translation of Frog Neuromuscular Innervation Pattern Changes Caused By Neurotrophins to Human. Adv Ortho and Sprts Med: AOASM- 160.
DOI: 10.37722/AOASM.2022024
Spinal Muscular Atrophy Repair through Coordination Dynamics Therapy and Translation of Frog Neuromuscular Innervation Pattern Changes Caused By Neurotrophins to Human
Chapter 1
Spinal muscular atrophy repair through Coordination dynamics therapy
Summary
This publication consists of 3 parts. In the first part an introduction to coordination dynamics therapy is given. It is shown in two patients with spinal muscular atrophy (SMA) that their nervous system could be improved in its functioning through 5 and 8 months of coordination dynamics therapy with the consequence that their muscle power increased and everyday life became easier. The improvement of nervous system functioning was measured by a single value, the coordination dynamics value, when the patients were exercising on a special coordination dynamics therapy device. Muscle power and muscle size increased, especially seen in the biceps muscle.
In the second part a frog model is used to show the complexity of cell communication between two kinds of muscle fibers and two kinds of motoneurons during development and repair. Motor endplate and membrane functions were analyzed by electrophysiological methods, contraction properties and morphometry. The correlation of motor endplate functions with the structure of innervating nerves and muscles of the two kinds of motoneurons and the two kinds of muscle fibers allowed an estimation on the distances of action of neurtrophins, which was in the range of 0.1µm.
Following denervation, the fast and slowly conducting motoneurons re-established their adult specific innervation pattern, namely that the fast-conducting axons innervate again the twitch muscle fibers and the slowly conducting axons innervate again the slow muscle fibers. But since the axons of faster conducting and regenerating motoneurons reach first the two kinds of muscle fibers, they re-innervate first non-selectively both kinds of muscle fibers, their own twitch muscle fibers and the wrong slow muscle fibers. When the slowly conducting and regenerating axons of the second kind of motoneurons reach eventually the two kinds of muscle fibers, they take control over their own slow muscle fibers and push the synapses of the fast-conducting axons away from the slow muscle fibers. The fight for their own twitch or slow muscle fiber of the fast or slowly conducting axons takes place by a close contact between the two kinds of motoneuron endplates, indicating that the distance of neurotrophin action is very short and less than 1µm. The correlation of single muscle fiber functions and different motor endplate structure of the two kinds of motoneurons during development and repair gave insight into this intricate four-cell communication through neurotrophins.
In the third part, the neurotrophin regulated innervation pattern is translated to human, where there are three kinds of motoneurons, namely α1-motoneurons, α2-motoneurons and α3-motoneurons, innervating three kinds of muscle fibers, namely the fast-fatigue, the fast-fatigue resistant and the slow muscle fibers, respectively. One neurotrophin molecule/protein alone would not be able to serve such a 6-cell communication for a proper neuromuscular innervation pattern with the loss of motoneurons due to SMA. Coordination dynamics therapy, on the other hand, has not that neurotrophin innervation problem. It stimulates the nervous system through movement-based learning, to repair itself as much as possible in a physiologic way. This repair through intensive movement-based learning will most likely stimulate the epigenetic mechanisms for repair including neurogenesis.
When translating the frog data to human patients it is tried to estimate the treatment possibilities of a gene therapy in comparison with the movement-based learning therapy. It turns out that the gene therapy is unlikely to work even though extremely expensive, whereas the coordination dynamics therapy can improve muscle power at least for some time. But over years, the building of new motoneurons would be needed. Neurogenesis of motoneurons is may be possible though movement-based learning for a few years when exercising at individual limits. But gene therapy, if really working, can only slow down the progressive SMA disease but cannot improve central nervous system (CNS) functioning, whereas coordination dynamics therapy can improve nervous system functioning in patients in the short-term and has a chance of a partial repair on the long-term. The problem with a movement-based learning therapy is that the patients have to fight for a longer better life, whereas a drug therapy is not connected to hard work.
Keywords: Spinal muscular atrophy (SMA) – Human repair-neurophysiology – Electrophysiology – Single-nerve fiber action potentials – Surface EMG – Oscillatory firing – Phase and frequency coordination – Coordination dynamics therapy – Translational medicine
1 Introduction
1.1 Central nervous system repair achieved through Coordination dynamics therapy
Coordination Dynamics Therapy (CDT) will be applied to spinal muscular atrophy (SMA). It has been shown that CDT was successful in different diseases (Figure 1). It may well be that it is also successful in genetic diseases.
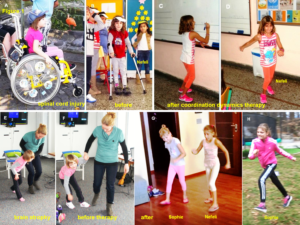
Figure 1: The spinal cord injury patient Nefeli relearned to walk and became continent again (A-D) [7, 13]. The cerebral palsy girl Sophie with atrophied cerebellum and pons could not stand, walk, run (E, F) or jump and was incontinent. She learned to walk, run (G, H) and jump, became continent and her higher mental functions improved [15].
Based on human repair-neurophysiology [1, 2], a movement-based learning therapy was developed, called Coordination Dynamics Therapy [3], with which it is possible to improve or repair central nervous system (CNS) functioning after stroke [4], traumatic brain injury [5, 6], spinal cord injury [7-13] (Figure 1, Nefeli), cerebellar injury/atrophy [14, 15] (Figure 1, Sophie), cerebral palsy [16], hypoxic brain injury [17], in Parkinson’s disease [18], spina bifida (myelomeningocele) [19] and scoliosis [20]. Speech had been induced and improved in a patient with severe cerebral palsy [1]. A permanent coma patient could be brought out-of-coma and relearned to speak and move [21, 26] and cancer grows could be inhibited through CDT [22, 23] by improving cardio-vascular performance [1, 21] and building of natural killer cells [24]. Urinary bladder functions [1] could be cured in cerebral palsy [1] and spinal cord injury [7, 12, 13]. There is indication that general health can be improved via CDT to live longer with a better quality of life [25] and euthanasia can be avoided in organ donation [26]. Basal ganglia injury can also be repaired [27].
CDT was designed for the repair of traumatic CNS injury through improving the impaired phase and frequency coordination of neuron firings [28] and plasticity, so that other parts of the brain can take function over. But Parkinson disease, hypoxic brain injury and CNS malformations could also be successfully treated. It may therefore be that CDT can also partly repair genetic diseases.
1.2 Spinal muscular atrophy (SMA) is caused by a genetic mutation in the SMN1 gene which CDT tries to repair
Spinal muscular atrophy is caused by a genetic mutation in the survival motor neuron (SMN)1 gene [29, 71].
The theory of SMA is that the human chromosome 5 contains two nearly identical genes at location 5q13: a telomeric copy SMN1 and a centromeric copy SMN2. In healthy individuals, the SMN1 gene codes the survival of motor neuron protein (SMN) which, as its name says, plays a crucial role in survival of motor neurons. The SMN2 gene, on the other hand – due to a variation in a single nucleotide (840.C→T) – undergoes alternative splicing at the junction of intron 6 to exon 8, with only 10–20% of SMN2 transcripts coding a fully functional survival of motor neuron protein (SMN-fl) and 80–90% of transcripts resulting in a truncated protein compound (SMNΔ7) which is rapidly degraded in the cell.
In individuals affected by SMA, the SMN1 gene is mutated in such a way that it is unable to correctly code the SMN protein – due to either a deletion occurring at exon 7 [30] or to other point mutations (frequently resulting in the functional conversion of the SMN1 sequence into SMN2). Almost all people, however, have at least one functional copy of the SMN2 gene (with most having 2–4 of them) which still codes 10–20% of the usual level of the SMN protein, allowing some neurons to survive. In the long run, however, the reduced availability of the SMN protein results in gradual death of motor neuron cells in the anterior horn of the spinal cord and brain. Skeletal muscles, which all depend on these motor neurons for neural input, now have decreased innervation (also called denervation), and therefore have decreased input from the CNS. Decreased impulse transmission through the motor neurons leads to decreased contractile activity of the denervated muscle. Consequently, denervated muscles undergo progressive atrophy (waste away). The denervation and repair mechanisms are complicated by the existence of three kinds of motoneurons and three kinds of muscle fibers.
The severity of SMA symptoms is broadly related to how well the remaining SMN2 genes can make up for the loss of function of SMN1. This partly depends on the number of copies of the SMN2 gene present on the chromosome. Whilst healthy individuals usually carry two SMN2 gene copies, people with SMA can have anything between 1 and 5 (or more) of them; the greater the number of SMN2 copies, the milder the disease severity. Thus, most SMA type I babies have one or two SMN2 copies; people with SMA II and III usually have at least three SMN2 copies; and people with SMA IV normally have at least four of them. However, the correlation between symptom severity and SMN2 copy number is not absolute and there seem to exist other factors affecting the disease phenotype [31].
Based on human repair neurophysiology, it will be shown in the Results that some repair can be achieved in SMA through CDT. In the Method the CDT will be displayed and in the Discussion an animal model will show how complicated the interplay between neurons and muscle fibers are. A pure gene therapy is unlikely to work apart from the placebo effect. The from mainstream medicine offered treatments is probably not be more successful than the stem cell therapy for brain and spinal cord injury repair. The idea of stem cell therapy was good, but the stem/progenitor cells were not integrated into the existing neural networks. The extreme expensive gene therapies are unlikely to work for similar reasons as will be analyzed in the Discussion.
A repair method must be specific and should not just consist of a substance to be administered. CDT is a specific repair method, which makes the CNS to understand that something is wrong and the body should find a way to repair the injury or gene mutation. Hippocrates had also the opinion that the true healer is the body itself.
2 Method
2.1 Human Neurophysiology
With the single-nerve fiber action potential recording method, single-nerve fiber action potentials can be recorded from sacral nerve roots, running in and out of the spinal cord (Figure 2) [32].
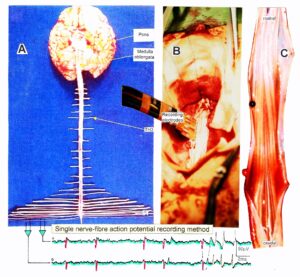 Figure 2: Layout of the recording of single-nerve fiber action potentials to analyze the self-organization of neuronal networks of the human CNS under physiologic and pathophysiologic conditions. A, B, C. By recording with two pairs of platinum wire electrodes (B) from sacral nerve roots (cauda equina, C) containing between 200 and 500 myelinated nerve fibers, records were obtained in which single nerve-fiber action potentials (APs) were identified from motoneurons (main AP phase downwards) and afferents (main AP phase upwards). A. Human CNS with the schematic illustration of the recording layout and an original record of single nerve-fiber action potentials. Note the time calibration of 2ms. B. Intraoperative recording layout (when implanting a bladder stimulator) with two pairs of wire electrodes and one temperature sensor. A thin nerve root is positioned over the platinum wire electrodes. C. Dissection of the human cauda equina. At the caudal end, the filum terminalia and thin nerve roots can be seen. Dissections of the Author apart from the laminectomy in B.
By measuring the conduction times and with the known electrode pair distance of 10 mm, conduction velocity distribution histograms were constructed in which the myelinated nerve fiber groups larger than 4mm could be characterized by group conduction velocity values (Figure 3). After the recording, morphometry was performed. Distributions of nerve fiber diameters were constructed and nerve fiber groups characterized by the peak values of asymmetrical distributions (Figure 3). By correlating the peak values of the conduction velocity distributions with those of the diameter distributions, obtained for the same root, a classification scheme was constructed of the human peripheral nervous system (Figure 4) [33, 34]; the only existing one for human peripheral nerve fibers.
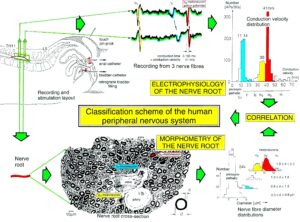
Figure 3: Development of a classification scheme for human peripheral nerve fibers. Conduction velocities (V) and nerve fiber diameters (Æ) of afferent (from receptors) and efferent (motor) nerve fiber groups in normal humans and in patients with a traumatic SCI for 0.5 to 6 years.
This classification and identification scheme represents a solid basis for classifying and identifying nerve fiber groups in the human peripheral nervous system (PNS) and analyzing CNS functions at the single-neuron level. It became thus possible to record natural impulse patterns simultaneously from identified single afferent and efferent nerve fibers and to analyze self-organizing mechanisms of the human CNS under physiologic and pathologic conditions.
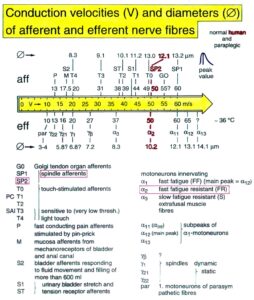
Figure 4: Classification scheme for human peripheral nerve fibers. Conduction velocities (V) and nerve fiber diameters (Æ) of afferent and efferent nerve fiber groups in normal humans and in patients with a traumatic spinal cord injury for 0.5 to 6 years. The splitting of the a1-motoneurons into the 3 subgroups, a11, a12, a13, has not yet been confirmed. This is the only existing classification scheme for human peripheral nerve fibers!
The most important finding with the single-nerve fiber action potential recording method was that nerve cells in the human CNS are organizing themselves through “Phase and Frequency coordination” [35, 36] (Figures 7). In nerve fibers, this phase and frequency coordination can easily be measured, because the three motoneuron types fire for high activation oscillatory [37] and offer in this way a structure for which the timed firing of neurons can be related to. Since the α2-motoneuron oscillations are most stable, firing phases of neurons can be related best to the α2-motoneuron firings.
Figure 5 shows schematically the oscillatory firing patterns of the three kinds of motoneurons and the muscle fiber types they innervate.

Figure 5: Correlation of muscle fiber types, motor nerve fiber types, and oscillatory firing spinal neuronal networks (oscillators), based on histochemical, morphological and neurophysiological properties. This figure provides a simplified correlation between muscle fiber, motoneuron and sacral oscillator types. No additional subtypes have been included. The existence of a1-motoneuron (FF) oscillators firing at 10 Hz has been predicted and they have been identified in paraplegics. a = motoneuron, g1, g2 = dynamic and static fusimotors, parasympathetic = parasympathetic preganglionic motoneuron. S1, ST, S2 = stretch, tension and flow receptor afferents.
By comparing CNS functioning in brain-dead humans (where the spinal cord is functioning rather physiologically) and patients with spinal cord injury, injury-induced changes of CNS functioning can be measured and partly repaired. Mainly the phase and frequency coordination of neuron firing becomes impaired following injury. This impaired coordination among neuron firings can efficiently be repaired through exercising on the special CDT device (Figure 21A).
The drawing back of the single-nerve fiber action potential recording method is that it is an invasive recording method. But with the surface electromyography (sEMG) [38] one can record non-invasively coordinated firing among motoneurons via their motor units if one records from suitable patients, like incomplete spinal cord injury patients, when a certain muscle is only innervated by a few motoneurons.
In Figure 6, the recordings from motoneurons and motor units are compared. The firing patterns of α1, α2 and α3-motoneurons can easily recorded with the single-nerve fiber action potential recording method but not with the sEMG. From spinal cord injury patients, on the other hand, single-motor unit APs can be easily recorded from α1 motor units but not from α2 and α3 motor units (Figure 6), because their AP ampl25itude seems to be too small. Clinical sEMG recordings therefore show mainly the activity of α1 motor units. The generation of motor patterns of α1-motoneuron firings with increasing load and the phase and frequency coordination among single-motor unit firings can be recorded with sEMG (Figure 7).
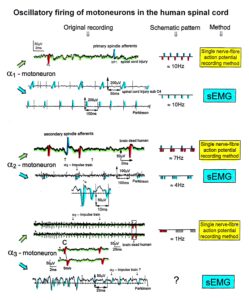
Figure 6: Oscillatory firing patterns of a1, a2, and a3-motoneurons recorded from motoneuron axons with the single-nerve fiber action potential recording method and by surface electromyography (sEMG) from FF, FR, and S-type motor units. The left panel shows original recordings, the middle panel the schematic patterns; the recording methods are indicated on the right side. The recordings were taken from patients with spinal cord injury and Parkinson’s disease and from brain-dead humans.
The neural networks of the human brain organize themselves by phase and frequency coordination among neuron firings and neural subnetworks as for example the network oscillators of which the motoneuron is a part. This coordination is achieved by the organization tendencies of the network, the descending impulse patterns from the brain and the spatiotemporal afferent impulse patterns from the periphery.
If the premotor spinal oscillators would not coordinate their firing and synchronize their firing for longer periods of time, tremor would occur. Such pathologic synchronization can be observed in patients with Parkinson’s disease [39]. If the neural networks are damaged by trauma, degeneration or malformation, the coordination between neuron firings becomes impaired and has to be repaired by movement-based learning (CDT). Drugs and operations cannot repair neural network functioning.
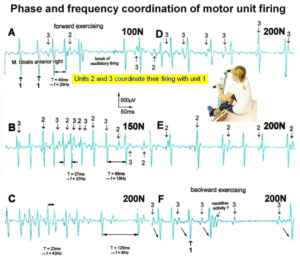
Figure 7: Phase and frequency coordination between oscillatory firing of 3 motor units (FF-type, motor units ‘2’ and ‘3’ are partly marked) during the generation of a motor program when exercising on the special coordination dynamics therapy device at loads increasing from 100 to 200N. Oscillation periods (T) and oscillation frequencies (f [Hz]) of oscillatory firing motor unit 1 (largest motor unit) are partly indicated. ‘C, F’ soleus electrodes shifted to gluteus muscles. In ‘F’, some coordination’s between motor unit ‘3’ and ‘1’ are marked.
2.2 Improvement of the stability and exactness of phase and frequency coordination to allow specific patterns formation and learning transfer (System Theory of Pattern Formation)
The importance of stable and exact phase and frequency coordination, to allow specific pattern formation and in consequence learning transfer [40] to other patterns, can be understood at the collective variable level (System Theory of Pattern formation [41-43]) and at the neuron level. The behavioural information Finf of the coordination pattern dynamics, characterized by equations of motion of collective variables, dX/dt = Fintr(X) + ∑cinfFinf(X,t), affect the whole coordination pattern dynamics, including stability, rather than only certain coordination patterns. If the behavioural information includes the exercising of extremely coordinated, integrative movements, like exercising on the special CDT device for turning, then the quality of CNS self-organization can be enhanced by improving the exactness of self-organization, namely the precision of phase and frequency coordination between neuron and neural assembly firings. By improving the precision of organization of the intrinsic dynamics Fintr(X), that is, the specific variability of the injured networks, certain patterns do then already reappear. In the patient Sophie (Figure 1E-H) with cerebellum and pons atrophy, the protection automatisms appeared with the improvement of CNS functioning, first time in her life.
Neurons often serve more than one network pattern at the same time by time sharing of neuron firing and, in this way, give rise to learning transfer among the activated patterns. If subnetworks are improved in the organization of one pattern, the organization of the other pattern will also improve. Neurons involved in the organization of breathing and activating intercostal muscles, for example, are also involved in the organization of trunk stability. By reducing the spasticity of the trunk (in patients with Parkinson’s disease), the breathing will also improve. Similarly, sphincteric motoneurons are involved in continence and pelvic floor weight bearing. If during pregnancy the pelvic floor is not trained, sometimes stress incontinence occurs. This stress incontinence after birth can be repaired by learning transfer from coordinated movements. By mainly exercising on the special CDT device and jumping on springboard, urinary bladder functions can be repaired by learning transfer in healthy women. Also the girl Sophie became continent in this way.
2.3 Measuring CNS functioning by the arrhythmicity of exercising (coordination dynamics value)
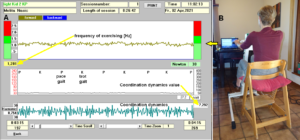
Figure 8: Coordination dynamics measurements. When exercising on a special CDT device (B), the arrhythmicity of turning (coordination dynamics (df/dt)) and the frequency of turning are displayed (A). The coordination dynamics value is the mean arrhythmicity value for 1min. P = pace gait, K = trot gait.
The impaired phase and frequency coordination at the single neuron level, the assembly level and the macroscopic level can be measured macroscopically when the patient is exercising on a special coordination dynamic therapy device (Figures 8B) on which arms and legs turn with a slightly different frequency (transmission 19 (arms) : 18 (legs)). The phase coordination between arms and legs is imposed by the device. The loss of phase and frequency coordination between arm and leg movements becomes visible and measurable by the arrhythmicity of turning. During a turning cycle the coordination between arms and legs changes between pace and trot gait and according to the difficulty of the coordination, the turning frequency increases and decreases. This frequency variation (df/dt; f = frequency) can be recorded, quantified and displayed on a computer screen (Figure 8A) and is called coordination dynamics value. CNS functioning is therefore measured though pattern change (continuous pattern change from trot gait to pace gait) according to the System Theory of Pattern Formation.
During the functional reorganization of the injured CNS of patients, the relative phase and frequency coordination among neuron firings has to be entrained as exactly as possible by the movement induced afferent impulse patterns from the receptors (learning through feedback information) to restore coordination in the range between 3 to 5 milliseconds (approximate lengths of postsynaptic potentials). The device has therefore to impose the exercising patient a coordination in the millisecond range for the different coordination’s of arm and leg movements between pace gait and trot gait. The easy pace and trot gait coordination’s, but not the difficult intermediate coordination’s, can often be performed by the patient easily. Therefore, the continuous change from the easy to the difficult coordination’s and backwards diagnoses the capability of the CNS to organize easy and difficult organizational states. If the movement states can be easily generated by the neuronal networks of the CNS, then the frequency variation of turning is small during the turning cycle, and if the movement state is difficult to be organized by the CNS, then the frequency variation is large (the coordination dynamics value is large).
2.4 Unique properties of special CDT devices
The special CDT device has three important properties.
First, the patient performs coordinated arm, leg and trunk movements when exercising on it. The training of integrative patterns take care of that the pathologic organization cannot escape from repair by shifting to another part of the CNS and the whole CNS, including the injured parts, is reorganized so that other CNS parts can take function over through plasticity. Figure 9 shows for the motor cortical fields that nearly the whole brain is activated, if the patient is performing simultaneously speech therapy or if the patient is counting or speaking in coordination with the turning movement.
Second, neurons are coordination detectors (Figure 10). Because the mechanical coordination between arm and leg pedals is extremely exact, the generated time-coordinated afferent input endplate potentials onto a neuron in the neural networks (approximately 5ms long) overlap more. The excitation threshold of the neuron is reached earlier. In this way, the efficiency of organization is improved. In spinal cord injury, for example, the transmission over the injury site will increase.

Figure 9: Relative sizes of cortical representations of different parts of the body which are activated when exercising on special CDT devices in coordination with instructions. Nearly the whole somatosensory (A) and motor cortical fields (B) are activated. When moving only the legs, as in case of a fitness bicycle, the activated areas are relatively small. Note, the cortical representation of the urinary bladder is close to the representation of the toes, and during jumping (Figure 12), the toes are activated. The patient Nefeli in ‘C’ suffered a spinal cord injury during a cancer removal by medical malpractice and had also the urinary bladder to be repaired. – This special CDT device for measuring and therapy (int.pat.) is produced by the firm: Giger Engineering, Martin Giger dipl.Ing.ETH/SIA, Herrenweg 1, 4500 Solothurn, Switzerland, www.g-medicals.ch.
 Figure 10: Neuron operating as a coincidence or coordination detector. A. Afferent input is reaching rather uncoordinated the cell soma. Only sometimes an action potential is generated, because the threshold of action potential generation is mostly not achieved. B. The action potentials in fibers 1 through 4 are reaching time-coordinated the dendrites or the cell soma. The postsynaptic potentials add up and the threshold is achieved at approximately –30mV, and action potentials are generated time-coordinated at the axon hillock. In the real CNS mostly, many more smaller postsynaptic potentials will contribute to the generation of an action potential and passive conduction from the dendrites to the cell soma has to be taken into account. Coordinated afferent input may thus induce or enhance (coordinated) communication between neuronal network parts following CNS injury.
Third, the coordination between arm and leg movements changes from pace to trot gait, imposed by the device. The intermediate coordination patterns between pace and trot gait are difficult to generate for the CNS neural networks. If the patients CNS learns to generate these intermediate patterns, imposed by the device, then the neural networks have learned to function better (more precise) in the deep complexity of CNS organization. The patient’s nervous system learns by turning from the device, to function more physiologic through improving especially the phase and frequency coordination among neuron firings. This phase and frequency coordination can be measured by single-motor unit surface electromyography non-invasively (Figure 7) and by the single-nerve fiber action potential recording method (Figures 11-14) invasively.
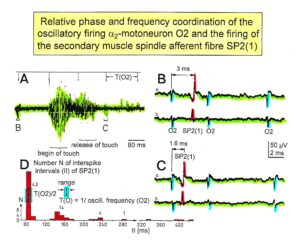 Figure 11: Time relation between the occurrence of the action potentials (APs) of the oscillatory firing a2-motoneuron O2 and the firing of the secondary muscle spindle afferent fiber SP2(1). Brain-dead human HT6. S4 dorsal root recording. A. Overall view of the used sweep piece; only trace “a” shown. Four oscillation cycle periods of the motoneuron O2 are indicated (T(O2)). The APs of the impulse trains can be recognized only partly, because of the slow time base and poor digitalization. One impulse train (dashed arrow) is lost in the touch stimulated activity, which consists of a touch (large overall activity) and a release part (lower overall amplitude). B, C. Sweep pieces from A, time stretched. In B, motoneuron impulse train APs are marked O2, spindle afferent APs are marked SP2(1). Note that the APs of the spindle afferent fiber are not time-locked to the first AP of the impulse train of the rhythmically firing motoneuron (relative phase coordination). D. Occurrence of interspike intervals of the secondary muscle spindle afferent fiber SP2(1). The numbers give the amount of IIs in each distribution peak. The oscillation period of motoneuron O2 (and the range of variation) and the half period are indicated by short dashed lines. Note that the IIs of fiber SP2(1) are very similar to the oscillation period (or the half of it) of a2-motoneuron O2 (relative frequency coordination).
In Figure 11 the coordinated firing between a motoneuron and spindle afferent fiber is recorded and measured. This spindle afferent fiber contributes to the drive of the motoneuron, because of a constant phase drive. In Figure 11B, C, the phase variation was 1.4ms (3-1.6ms). For a longer motoneuron drive, many spindle action potentials have to contribute; there have to be also frequency coordination. And this was really the case (Figure 11D). From Figure 12 it can be seen that from the point of frequency coordination, the SP2 (1) spindle afferent fiber was contributing most to the drive of the oscillatory firing motoneuron. The other spindle afferent fibers were contributing less. The recorded γ-motoneurons were only little correlated to the motoneuron firing. Figure 13 shows, from the point of frequency coordination, which spindle afferent fibers (SP2(6) till SP2(13)) and urinary bladder afferent fibers (S1 and S2) contributed to the drive of the oscillatory firing motoneurons innervating the external anal sphincter (TO2) and the external bladder sphincter (TO1).

Figure 12: Interspike interval distributions of single endings of four secondary muscle spindle afferents (SP2) and two g-motoneurons, recorded simultaneously. In A, the oscillation period TO2 (impulse train length = 3 APs) with its range of simultaneously recorded oscillatory firing a2-motoneuron O2 (see G) is drawn for comparison; also, the halves of the oscillation period TO2/2 are indicated. Note that the interspike interval distributions of spindle afferents and g-motoneurons have shortest interspike interval, nearly identical to the half of the oscillation period (relative frequency coordination). The schematic impulse pattern in A to F shows the procedure for measuring the interspike intervals. Original records of the firing patterns of a2-motoneuron O2 and the secondary muscle spindle afferents SP2(1), SP2(2), SP2(3) and SP2(5) are shown in G. Brain-dead human HT6, dS4 root.
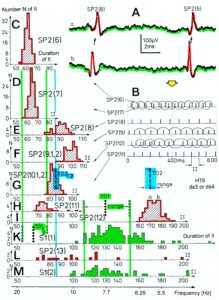
Figure 13: Measurements from brain-dead human HT6 from different spinal cord segments after retrograde bladder filling (700 to 800 ml), with the exception of “I,” which was obtained before filling. A. Sweep piece of a recording from a dorsal S3 or S2 root filament. It can be seen that the secondary muscle spindle afferent SP2(6) AP can be distinguished by the waveform on the two traces from the secondary spindle afferent fiber SP2(8) AP (different amplitude of the three phases of the triphasic APs). B. Simultaneously recorded impulse patterns of the six parent secondary spindle afferents SP2(6) through SP2(11) obtained from dS3 or dS2 root recordings. The impulse patterns of SP2(6) and SP2(7) fibers are not separated to show the similarity of the patterns. The impulse patterns of the parent spindle afferents SP2(9) and SP2(10) are split into patterns of the single endings (single ending activity partly connected by circle lines) with the assumption that single endings of parent secondary muscle spindle afferents should have interspike intervals of duration longer than 50 ms. C to H. Interspike interval distributions of six simultaneously recorded single secondary spindle afferent endings. F, G. Interspike interval distributions of parent fibers, which are the sums of the distributions from the two activated endings. I. Interspike interval distributions of a secondary spindle afferent fiber (SP2(12)) of a coccygeal root. K, L, M. Interspike interval distributions of single-fiber afferent activity from a lower sacral dorsal root. In L, most likely the activity from a secondary spindle afferent fiber is shown. In K and M, most likely the interspike intervals from afferents (S1(1) and S1(2)), innervating stretch receptors of the urinary bladder wall, are shown. In G, H and K, the durations of the oscillation periods (mean and range) of the oscillatory firing a2-motoneurons are indicated by thick dashed and dotted lines; the motoneurons innervate the external anal sphincter (TO2) and the external bladder sphincter (TO1). The sites of innervation of the oscillatory firing motoneurons are identified (and distinguished from each other) by anal reflex stimulation, bladder filling and catheter pulling. Note that the TO1 and TO2 ranges and their halves overlap with the interspike interval distributions of the secondary spindle and stretch receptor afferents (relative frequency coordination)
The innervation of the urinary bladder is very complex and only partly known with respect to the innervating nerves (Figure 14).
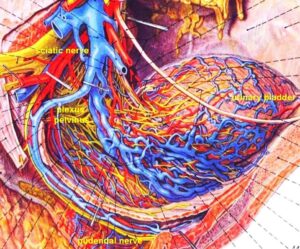
Figure 14: Anatomy of the innervation of the urinary bladder. The plexus pelvinus makes it very difficult to clarify further the innervation of the bladder; the Author tired it without success. Picture taken from Pernkopf (‘Topographische Anatomie des Menschen’, University Library Turku, Finland).
But when recording from sacral nerve roots with the single-nerve fiber action potential recording method, and using the classification scheme for human peripheral nerves (Figure 4), we can clearly identify continence functions and sites of receptors and motor units of continence muscles as Figures 12 and 13 indicate. In Figure 15, the sites of the urinary bladder afferents and the external anal sphincter (TO2) and the external bladder sphincter (TO1) are indicated. For further details see [34, 36].
If in muscular spinal atrophy the external bladder sphincter would atrophy, the patient would get stress incontinence. The normal bladder continence is achieved via the internal bladder sphincter, but when coughing, fluid would be lost, because the external bladder sphincter is not working because of the atrophy.
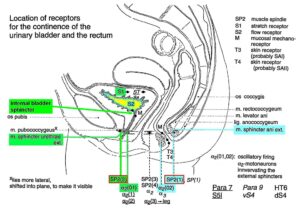
Figure 15: Schematic anatomy of the lower pelvis with the location of urinary bladder and rectum continence muscles and receptors from Figure 13 and 12. The external bladder and anal sphincters are skeletal muscles. The indicated internal bladder sphincter is a part of the detrusor (bladder) and is a smooth muscle innervated by the sympathetic nervous system.
Fourth, the exercising on the special CDT device repairs also urinary bladder functions. The mechanism is not fully clear. As Figures 11-15 indicate, it has something to do with the improvement of the phase and frequency organization of the neural networks of the sacral and pontine micturition centers (Figure 18A). Through learning transfer from movements, also the sympathetic and parasympathetic nervous system divisions are activated for better functioning and repair. Figure 16 shows the innervation of the different organs by the sympathetic and parasympathetic nervous system divisions. The site of recording single-nerve fibers is indicated.
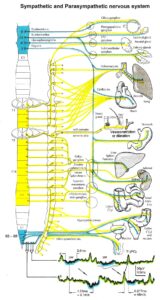
Figure 16: Schematic diagram of the sympathetic and parasympathetic nervous system. Yellow = sympathetic, blue = parasympathetic (it may be that the sacral parasympathetic division is also sympathetic). The recording of single-nerve fiber action potentials from preganglionic neurons (par) and a skin afferent fiber from a S5 sacral root is inserted.
2.5 Repair strategies at the neuron membrane and genetic level
The repair of functions/patterns in spinal muscular atrophy make it likely that excitation-neurogenesis coupling [44] contributed, stimulated through CDT.
1 Repair depends on learning and memory formation, mediated or supported by epigenetic mechanisms. Epigenetics is the interplay between genes and the environment resulting in phenotype and epigenetic landscape.
2 Epigenetic mechanisms, like DNA methylation, are probably sensors for movement-based learning and memory formation and fine modulators of neurogenesis though CDT (Figure 17).
3 The epigenome consists of non-coding RNA and chromatin, a proteinaceous matrix surrounding DNA. The dynamic interactions of post-translationally modified chromatin proteins, covalently modified cytosines inside DNA and non-coding RNA define the complex pattern of gene expression beyond the four bases of DNA.

Figure 17: Epigenetic regulation for repair by movement-based learning. CDT-induced stimulation of the pathways that regulate neural network repair is a proven therapeutic and preventive tool. Epigenetic mechanisms, stimulated by physiologic network activation, are likely key players within signaling networks, as DNA methylation, chromatin remodeling and small non-coding RNAs superfamilies’ are required for the fine-tuning and coordination of gene expression during neural network repair by learning.
4 The hippocampus plays an essential role in learning and memory. In the hippocampus there exists a specialized form of neural plasticity, which is the generation of new functional neurons from stem cells occurring throughout life. Adult hippocampal neurogenesis contributes to learning and memory formation.
5 New neurons are important for learning and memory formation (besides functional reorganization), i.e., for increasing the rate of repair, for the following reasons:
a The insertion of new neurons helps to store the memory of the same activity that led to the creation of the neuron.
b Activity-dependent neurogenesis enhances the learning of new memories and degradation and clearance of previously stored unwanted memories like spasticity, because the synapses, dendrites and axons can be devoted more fully to the newer memories. The old neurons with large and complex axon and dendritic trees are difficult to change. They can only be changed with sustained effort.
c New neurons seem to improve the accuracy of relearned patterns (from model study [44]). This means that new neurons help to improve phase and frequency coordination of neuron firing and pattern stability.
d The advantage of new neurons seems to be dramatically greater in networks that had been more active and had been required to store more memories [44]. The advantage of neurogenesis for memory storage in heavily active networks is that it provides an increased rate of repair if movement-based learning is administered aggressively and if different movements are trained.
6 Specific natural network activity is required for multiple aspects of repair. Specific activity is essential for correct migration of interneurons and it also controls the development and repair of their axons and dendrites. During repair there is a specific requirement of network activity in shaping the cortical integration of specific neural subtypes. Newly build neurons are likely electrically active shortly after their birth and participate in the early network activity that contribute to circuit maturation during repair by CDT.
7 Specific activity is required for migration and maturation at several stages of repair. A break in CDT may invalidate the whole chain of repair events. Specific interneuron subtypes require activity for migration and morphological maturation at two distinct stages of development [44]. Newly built neurons may even require specific activity for migration and maturation at several distinct stages of repair. During a break in CDT, the specific activity, required for neuron migration, maturation and network integration may not be supplied at one of these stages so that the chain of repair events is severed and the whole repair chain has to be started anew.
8 Drug application may undermine repair. Altering the level of neuronal excitability within genetically targeted neurons from drug application, for example antiepileptic drugs may have profound consequences on multiple aspects of the repair of select types of neurons within a population of neurons, as well as their associated gene expression. The pain-killer ‘Contergan’, taken during pregnancy, changed gene expression and the babies were born without arms.
9 Excitation-neurogenesis coupling [44]:
a Excitation increases or decreases neuron production directly by excitation-neurogenesis coupling.
b The excitation acts indirectly on the surrounding mature (hippocampal) cells through depolarization-induced release of growth factors.
c Adult neurogenesis is enhanced by excitatory stimuli and involves Ca2+ channels and NMDA receptors.
d The Ca2+ influx pathways are located on the proliferating stem/progenitor cells (NPCs), allowing them to directly sense and process excitatory stimuli. The Ca2+ signal in NPCs leads to rapid induction of a proneural gene expression pattern.
10 Integrative coordinated movements have to be trained to allow functional reorganization and new nerve cell integration across very large distances. CDT has to activate injured and uninjured networks to enhance physiologic CNS functioning and learning transfer.
11 Conclusion for optimal therapy according to the present stage of knowledge. If there is similarity between development and repair, animal (mice) data also hold in humans and the principles of neurogenesis of the hippocampus also hold in other parts of the brain, albeit to a much lesser extent, then the patient has to be trained at his limits (1) to induce substantial building of new nerve cells [45]. The treatment has to be continuously administered (2) to support all stages of repair at the progenitor level as migration, maturation and integration. The networks requiring repair have to be activated specifically (3) to generate repair-friendly, micro-environmental properties in the networks. No drugs should be administered that change neuron excitability (4). The exercises have to include coordinated arm, leg and trunk movements (if possible) to improve the impaired phase and frequency coordination for CNS self-organization (5). The performed movements have to be as integrative as possible to reconnect distant brain parts and to induce learning transfer.
2.6 It is movement-based learning that achieves repair
It is learning and not simply training that elicits the survival effects of new neurons in the hippocampus. Learning appears to promote the survival of newborn neurons in cognitively unimpaired aged rats [46]. Learning elicits different influences on neural precursors at different developmental stages. The regulation of sub granular zone neurogenesis by hippocampus-dependent learning is complicated and can be affected by factors such as the age of the newborn neurons, the stage of learning and specific learning protocols [47].
When the human patient is exercising on the special CDT device, he should not just turn, but should try to turn more smoothly. He should try to reduce the arrhythmicity of exercising. The patient should try to improve the performance of movements by learning. During learning, it is essential to concentrate and to be aware of what needs to be corrected. When the patient is well-practiced at exercising smoothly, the skill can be accomplished without conscious effort, much like in walking, swimming, cycling or skiing. Simply exercising will also improve CNS functioning. However, the rate of learning is significantly lower. This is the learning of automatic movements, in which the process is subconscious. A problem in some patients is that the cognitive functions are that much impaired that they cannot understand that they have to learn to improve their nervous system functioning. The hope in such cases is that the simple training improves their cognitive functions to a point that they can understand that they have to improve the performance of the trained movements to improve their CNS functioning. In older patients with spinal muscular atrophy the situation is different. They are intelligent and can understand that they have to perform movement-based learning. But according to their experience, they are not trusting the research and treatment systems any more.
2.7 Coordination dynamics therapy versus gene therapy to repair spinal muscular atrophy
CDT was able, so far, to improve CNS functioning in many patients with different diseases [1-27] (see above). For sure CDT is optimizing what is left following injury, malformation and degeneration. With the loss of motoneurons in spinal muscular atrophy, the impaired phase and frequency coordination has to be improved, because the motoneuron death ruined the phase and frequency coordination, and the movement patterns were lost or became impaired. Through improving the phase and frequency coordination, some patterns will re-appear spontaneously. But optimizing the CNS functioning is not sufficient for substantial repair. New motoneurons and other neurons are needed. The success of CDT makes it likely that the coordinated movements stimulate neurogenesis [45]. But can a sufficient number of motoneurons be build a new? Only CDT, administered to patients with spinal muscular atrophy, performed at limits over at least 2 years, can answer this question. An important question is, how much more efficient is the coordinated movement in comparison to uncoordinated movement in excitation-neurogenesis coupling.
In a gene therapy to produce a neurotrophin/SMN protein that will with its application make the motoneurons to living longer, is doubtful to succeed. The places of neurotrophin action below the endplates will probably not be reached. And further, without movement-based learning, CNS functioning will not be optimized.
In the Discussion it will be analyzed in detail, based on animal data, that the gene therapy it unlikely to work at all, because the systemically administered neurotrophin may not reach the places of action under the motor endplates. It is something like as in stem cell therapy. There, the systemically administered stem cells were too far from the sites where an integration of new cells is possible. The cells were not integrated and died. In spinal muscular atrophy, the neurotrophin(s) may also not reach the sites of action. The degeneration of the neuro-muscular units in spinal muscular atrophy is more complex than just the lack of a neurotrophin/SMN protein for a longer survival of motoneurons.
2.8 Anatomy of the CNS with location of motoneurons in the spinal cord
Figure 18 shows the human CNS, including brain, spinal cord and nerve roots. The motoneurons, located in the anterior horn of the spinal cord (Figure 19), are progressively lost in the spinal cord (Figure 20) due to the spinal muscular atrophy disease and cannot activate any more the corresponding muscles. The muscles will partly atrophy.

Figure 18: The human CNS. In A the intumescentia cervicalis and lumbosacralis are indicated, were probably most of the motoneurons are lost.
Through sprouting the motor unit can be increased may be up to 50% and compensate a bit for the loss of motoneurons. CDT can additionally optimize the system by improving mainly the phase and frequency coordination of neuron firing and motor unit firing. By increasing the coordinated of motor unit firing, muscle power will increase. With progressive loss of motoneurons, these compensating mechanisms are not sufficient and the patient will lose progressively muscle power at sites of motoneuron loss.
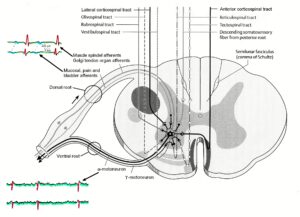 Figure 19: Synapses of the descending motor tracts onto anterior horn motoneurons. The motoneuron is a summing point. It is getting many inputs including those from the periphery (reflexes) and from many descending tracts. The simultaneous input from the reticulospinal tract could give rise to α- and γ-motoneuron co-activation. In difference to the picture, dorsal and ventral nerve roots fuse before the ganglion (Figure 18).
To stop the loss of motoneurons seems logic. But, as will be shown in an animal model in the Discussion, it is extremely difficult to achieve, because motoneurons react to the muscle atrophy and this atrophy may induce motoneuron loss in turn and the interaction between motoneurons and muscle fibers takes place subsynaptically. A systemic application of genetically derived neurotrophins/proteins is unlikely to work. Neurogenesis, including the building of new motoneurons, would help if it would be possible to induce substantially neurogenesis. A systemic application of stem cells was not successful.
But if it would be possible to stimulate the building of new motoneurons in the spinal cord, the efficient, aggressive CDT has to be performed for at least 2 years [13]. Motoneurons have to be build anew from stem/progenitor cells [45] and the axons of the motoneurons have to grow down to the muscles and build motor endplates there. An important question is, how many motoneurons die by the disease and how many can be built anew.
The patients of this article believed in CDT because they have seen that it worked at least in the patient Alen with hemiplegia and brain injury [27].
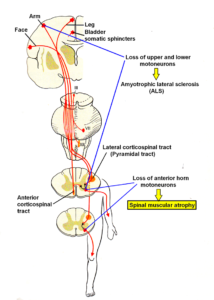
Figure 20: Sites of loss of motoneurons in spinal muscular atrophy (SMA) and amyotrophic lateral sclerosis (ALS). Also breathing, continence or cranial nerves can be affected in spinal muscular atrophy.
3 Results
3.1 Case report of SMA patient Melita
3.1,1 Repair achieved through 8 months of coordination dynamics therapy
Melita was diagnosed to have a spinal muscular atrophy (SMA) grade III (Kugelberg-Welander, Juvenile SMA).
At the beginning of CDT, the 42-year-old patient Melita could not walk freely any more, but could just manage at home alone. With a further progression of the SMA, she would need care at home.
For performing CDT, Melita needed a special CDT device, with an approximate price of between 3000 to 10000 USD, depending on the kind of the device. The insurance company refused to pay for it, but offered her a gene therapy which costs in the range of one million Dollar (factor 100 more expensive). Melita rejected the million Dollar therapy, because she did not believe in it and she thought it was a too expensive therapy for hopefully some disease improvement.
At the beginning of therapy, Melita was able to exercise on the special CDT device (Figure 21A) at very low load and her CNS functioning could be measured by the CDT value (Figures 8 and 22). She was able to move in the forward direction (Figure 21B), but the walking pattern was very pathologic. She was somehow throwing the legs in the foreword direction. She could just keep the crawling position, if support was given (Figure 21C). She was far away from being able to get down to the floor and up from it by herself. Sufficient power in arms and legs were missing.

Figure 21: The patient Melita with a spinal muscular atrophy. She was still able to exercise on the special CDT device (A), move in the forward direction (B) and keep the crawling position (C). Movements were assisted by the healthy sister.
Through 7 months of CDT, the coordination dynamics (arrhythmicity of exercising) value improved (reduced) in the forward direction by 47% from 7.29 to 3.87 (Figure 22A, B) and in the backward direction by 60% from 10.16 to 4.08 (Figure 22C, D). Also, the frequency of exercising increased from 1.28Hz to 1.57Hz and from 1.17 to 1.53 respectively (Figure 22), which is also an indication of the improvement of CNS functioning. The load, to which she could turn against, increased only little. This means, the muscle power improved only little. For sure she did not get further worse during these 7 months of therapy.
This minimal improvement of CNS functioning and muscle power allowed her to train a bit more movements. At the beginning of therapy, she could just keep the crawling position (Figure 21C). After 8 months of therapy, she became able to variate the crawling position. Up and down movements (Figure 23) were easy for her to perform and also the sidewards movements. Forward and backward movement were difficult because of missing muscle power. But she was not able so far to crawl.
The training of walking with support, like with the cervical spinal cord injury patient Kadri (Figure 47A), has not been done so far because of organizational reasons. The training and learning of different movements are important because it is mainly the learning which induces neurogenesis and new motoneurons and interneurons are needed for muscle power increase.
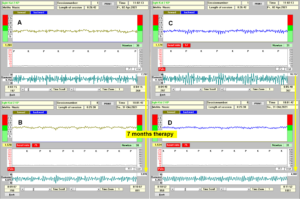 Figure 22: Coordination dynamics improvement within 7 months of CDT of the 42 years old patient Melita with a spinal muscular atrophy. The CD value reduced in the forward direction from 7.29 to 3.87 (A, B) and in the backward direction from 10.16 to 4.08 (C, D). The frequency of exercising increased from 1.28Hz to 1.57Hz and from 1.17 to 1.53 respectively. The load from the breaks were 30Newtons.
 Figure 23: Melita during training the variation of the crawling position (up and down).
3.1.2 Spinal muscular atrophy is inherited in an autosomal recessive pattern
Spinal muscular atrophy is inherited in an autosomal recessive pattern, which means that the defective gene is located on an autosome. Two copies of the defective gene – one from each parent – are required to inherit the disorder: the parents may be carriers and not personally affected (Figure 24). But SMA seems to appear also without any hereditary causes in around 2–4% of cases. Among three children, two of them, Melita and Vedad, were affected and only Jasmina was not affected. It would therefore be good to have a gene diagnostic done to be sure that the SMA was inherited.
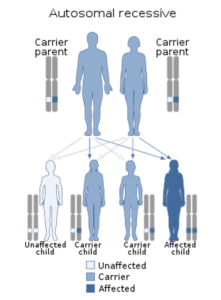
Figure 24: Spinal muscular atrophy has an autosomal recessive pattern of inheritance.
3.2 Case report of SMA patient Vedad
3.2.1 Improvement of nervous system functioning
The 35-years-old brother of Melita also inherited the spinal muscular atrophy disease (SMA grade III). He was less affected than Melita for the time being. At the beginning of therapy, he could walk with better performance than Melita and he was able to crawl with poor coordination (Figure 28E). When using a chair, he was able to get down to the floor and up by himself. He was still independent.
The patient Vedad could easily exercise on the special CDT device for low load (approximately 20Newton), even though he could not always keep the right leg in the straight position (Figure 25A). With support of the right leg (Figure 25B), he could exercise better. When exercising at higher loads, he had big problems in exercising smoothly, because of missing muscle power. The much bigger effort to exercise/move at higher loads can be seen in his facial expression (Figure 27). Exercising at low load, Vedad could laugh with his healthy sister (Figure 25A). When the sister increased the load, his facial expression changed to a strong looking, because a lot of effort was needed. As can be seen from the screen of the laptop, he had big problems to turn smoothly for the intermediate coordinations between pace and trot gait (Figure 25B). The arrhythmicity of exercising strongly increased between pace and trot gait, when a good phase and frequency coordination was needed in the deep complexity of CNS organization.
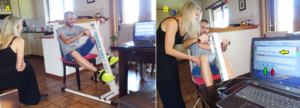 Figure 25: The 35-year-old patient with a spinal muscular atrophy during exercising on a special CDT device. A. At low load exercising, the patient is smiling, even though the right leg is not in a physiologic position. B. The sister increased the load of exercising. Even though she supported the right leg, the arrhythmicity of exercising increased rhythmically. For the easy pace and trot gait, the arrhythmicity is low (green arrow) and for the intermediate coordination’s, the arrhythmicity is high (red arrow). Also, the frequency of exercising reduced (yellow arrow) with increasing load (load escape).
During 4 months of suboptimal therapy, the low-load coordination dynamics values improved from by 51% from 8.8 to 4.3 for exercising in the forward direction (Figure 26A, B) and by 56% from 9.9 to 4.4 in the backward direction.
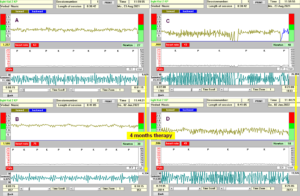 Figure 26: A, B. Coordination dynamics values of the 35 years old patient Vedad with spinal muscular atrophy improvement within 4 months. The CD value reduced by 50% (in the forward direction) from 8.8 to 4.3 and the frequency of exercising increased from 1.26Hz to 1.59Hz. C, D. When exercising at his highest load, the high-load CD values reduced by 26% from 27 (48N) to 20 (50N) for exercising in the forward direction. The frequency of exercising increased from 0.87 to 0.99Hz.
The main problem in spinal muscular atrophy is the loss of muscle power. With 4 months of therapy some muscle power increase could be measured. When exercising at his highest possible load of approximately 50Newton, the high-load CD values reduced (improved) by 50% from 27 to 20 (Figure 26C, D) after 4 months of therapy. When exercising on the special CDT device, he kept the knees in the normal (not abducted) position (Figure 27), whereas at the beginning of therapy, he had problems to keep the knees inside (Figure 25). When exercising against load, he had to fight, which could be seen in his face (Figure 27).
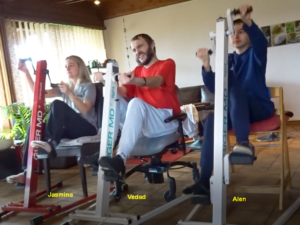
Figure 27: The patient Vedad during exercising on a special CDT device after 4 months of CDT. He became able to keep the knees in the proper position. For turning against some load, he had to fight because of missing muscle power, as can be seen in his face. For motivation, he was turning together with his healthy sister Jasmina and the son of her (Alen) with a hemiparesis and injured basal ganglia [27].
3.2.2 Deterioration of movement patterns with SMA
The loss of muscle power is not the only problem in SMA. Also the movement patterns become pathologic. The improvement of the exercise pattern in Figure 27 was therefore probably due to the gain of a bit more muscle power and an improvement of the movement pattern.
The deterioration of movement patterns with the disease can nicely be seen in this patient Vedad. The performance of normal walking was quite good (Figure 28F), apart from the mild overstretching of the knees (Figure 28G). But when walking on treadmill, the overstretching of the knees became more prominent, because the treadmill walking is more difficult than normal walking. The increase of overstretching of the knees on treadmill was caused by a lack of pattern adaptation. Therefore, in SMA we have not only a loss of muscle power but also a deterioration of neural network organization. The crawling pattern of Vedad was also not normal. As Figure 28E shows, the right leg was behind the left arm during trot gait crawling. If genetically derived molecules to protect the motoneurons against cell death would work, still the problem of not repaired neural networks would be present. CDT repairs the networks. But can it also increase the life time of neurons and can it substantially increase neurogenesis? Efficient successful treatment over 2 to 3 years will show it, if the patients have sufficient mental discipline to cooperate and train hard.
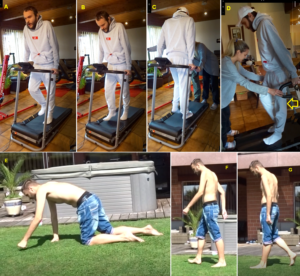 Figure 28: The patient Vedad with a spinal muscular atrophy during walking (F, G), crawling (E) and walking on treadmill in the forward (A, B, D) and backward direction (C). Note that the patient is overstretching the left knee especially in D (marked). The patient could not walk on treadmill without support.
3.2.3 Muscle power of the SMA patients Melita and Vedad in comparison to the healthy sister Jasmina and the Author
The lack of muscle power can also be measured via the coordination dynamics (CD) value. With increasing load in healthy humans and patients, the CD values increase (get worse). The increase depends on the available power and the quality of CNS organization. If the subject has sufficient power and the neural networks are working nicely, the CD values increase only little with increasing load. If there is a lack of power and/or the CNS is working badly, the CD values increase strongly with increasing load. In Figure 29 the increase of the CD value is measured and compared for the patient with SMA, the healthy sister Jasmina and the healthy Author.
As can be seen from Figure 29, when increasing the load in Newton, the CD value increased in the patient Vedad by 828% from 4.059 (A) to 37.666 (B) at the beginning of therapy and increased less by 360% from 4.334 (C) to 19.926 (D) after 4 months of therapy. In the healthy sister the CD value increased by 50% from 3.727 (E) to 5.602 (F) and in the healthy Author by 23% from 2.403 (G) to 2.960 (H). Even though the increase of the CD value with increasing load reduced in Vedad with therapy, his achieved value was still much higher (worse) (360%) than in the healthy sister (50%) and the Author (23%). The trained and fit Author had by far the littlest increase when increasing the load from 30 to 50N. The Author exercised most on the special CDT device, but was older.
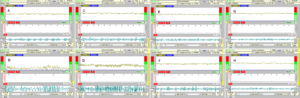 Figure 29: Comparison of coordination dynamics values increase with load increase from approximately 30N to 50N in the SMA patient Vedad (A, B), the healthy sister (E, F) and the healthy Author (G, H). For the patient (A, B) the increase was less (better) after 4 months of therapy (C, D).
The patient Vedad could only turn so far up to approximately 50N and for sure not at 100N. The healthy sister and the Author could turn up to 200N.The increase of the coordination dynamics value from approximately 30N to 100N was for the healthy sister Jasmina in the forward direction by 381% from 3.7 to 17.8 and in the Author by 108% from 2.4 to 5.0. This means, for patients and healthy subjects the coordination between arms and legs gets worse with increasing load, but in patients much more.
When turning at higher loads, the neural network organization in the deep complexity of CNS organization can be repaired through movement-based learning. But when the patients cannot exercise at higher loads anymore, then the efficiency of movement-based learning reduces. This means with respect to spinal muscular atrophy (SMA) and amyotrophic lateral sclerosis (ALS) the patients have to start therapy as early as possible and should not wait till the muscle power is mainly lost.
4 Discussion
It has been shown that coordination dynamics therapy (CDT) was very successful to repair the CNS in traumatic injury, degeneration and malformation (Introduction) [1-27]. The question is now, how successful would CDT be in progressive diseases like spinal muscular atrophy, multiple sclerosis or Parkinson. CDT was successful in stopping the Parkinson disease at least for some time [18, 28]. Here it is shown that patients with SMA benefited from CDT when training at limits.
But why is CDT that effective and why does it work in nearly all diseases. One argument is that CDT stimulates or supports the own repair mechanisms. By improving nervous system functioning through learning, nearly all body functions improve, because the improved nervous system is involved in nearly all body functions. Since genetics are involved in all adaptations and repairs, the coordinated movements will stimulate gene expression more efficiently via epigenetics.
It will be shown now in an animal model how complex the regulation is at the neuromuscular junction with respect to the functions of excitation traffic and trophic substances. Even though the frog model is far away from the human reality, it still shows how intricate the communication and function changes are between two kinds of motoneurons and two kinds of muscle fibers. The simple adding of a genetically derived neurotrophin/protein to make the motoneurons to live longer, is a too simple approach for SMA repair. The stem cell therapy was mainly not working, because the stem/progenitor cells were not integrated in the existing neural networks. One reason was that the stem cells could functionally not reach the neural networks for communication and integration. The distance for communication among neurons is very short. Most likely, also systemically administered neurotrophins will not reach the special places of action at the motoneuron as will be shown below.
Chapter 2
Frog Model To Study The Communication Between Two Kinds Of Motoneurons For The Innervation Of Two Types Of Muscle Fibers During Development And Repair
Abstract
During development and regeneration (repair), the neuromuscular innervation changes of slow muscle fibers from one motoneuron population to another one has been measured electrophysiological, morphologically and isometric power development in the common frog (rana temporaria). Target invasion, selection, and selection changes are discussed with respect to long- and short-range attraction and repulsion with respect to possible guidance molecules and receptors for guidance of axon grows cones and synapse profiles. The contact attraction and repulsion over a distance of 0.1μm and shorter is discussed with respect to competitive interactions and electromagnetic field guidance of the two types of motoneuron populations with respect to the specific innervation pattern of the two kinds of target muscle cells.
The invasion of a target muscle by two successive waves of two types of motoneuron axons and the recognition and specific selection of the two types of muscle fibers for innervation during development and regeneration in the frog are used to understand the repair of the human spinal cord following severe C5/6 spinal cord injury (SCI) and spinal muscular atrophy through movement-based learning. Based on the location of spinal cord tracts in the white matter and premotor networks in the grey matter and specific regeneration, it is found that the repair in human starts from the spared naturally activated nerve fibers and cell bodies at the injury site. The building of new motoneurons from endogenous stem cell reserves for the activation of the index finger and their functional integration started from the activated neural networks surrounding the injury site. It could well be that in spinal muscular atrophy new motoneurons are build anew when tract fibers and neural networks around the places of motoneuron cell death are activated. The survival time period of motoneurons in spinal muscular atrophy may depend also on the condition of the muscle fibers they innervate.
In spite of the progress in molecular biology, cell biology, and genetics, it will probably take at least another 100 years of faithful research to make a pure exogenous stem cell therapy or pure gene therapy work. To partly repeat neural development in humans may be as difficult as achieving eternal life. However, with a faithful translation of animal data to human and administration of movement-based learning therapy (CDT) to human patients, the injured or malfunctioning human CNS can already now partly be repaired.
Keywords: Frog – Development – Repair – Neuromuscular innervation – Translation medicine – Human – Spinal cord injury – Spinal muscular atrophy – Learning – Regeneration – Neurogenesis – Guidance cues
Data Summary
- The neural control of twitch and slow muscle fibers by two kinds of motoneurons in frog during development (metamorphosis) is quantified by electrical changes of membrane properties, changes of contractile properties and morphologic changes of axons and synapses, made visible by electron microscopy (EM). Twitch (similar to FF-type muscle fibers in human (Figure 5)) and slow muscle fibers (similar to S-type muscle fibers in human) are innervated in adult frogs by thick, fast conducting, and thin, slowly conducting, motor axons respectively. Slow conducting axons grow and regenerate slower than the thick fast conducting axons, causing neural control changes during development and regeneration (following injury) with competitive interactions between the two kinds of corresponding motoneurons for the innervation of the two kinds of muscle fibers. In a first wave, fast conducting axons invade the pyriformis muscle and successfully innervate twitch and slow muscle fibers non-selectively. In a second wave, slowly conducting axons invade the already innervated pyriformis muscle and innervate selectively the slow muscle fibers. The successfully established endplates of the fast-conducting axons on the (wrong) slow muscle fibers are repelled. This 4-cell-communication model for specific cell organization gives insight into the complexity of neuronal network organization during development and repair both in animals and humans.
- In the tadpole stage (tail length = 20mm), both slow and twitch muscle fibers are present, as can be seen from EM pictures. All muscle fibers are innervated by the same motoneuron population, namely those which innervate the twitch muscle fibers in adult frogs. Innervated by the wrong fast-conducting axons, as in the early stage of re-innervation after denervation, the slow muscle fibers are not able to respond with a sustained contracture but are capable of generating action potentials (APs).
- With the progress of metamorphosis (tail length = 10mm), before the slowly growing and slowly conducting axons have established neuromuscular transmission with their own slow muscle fibers, the slow muscle fibers respond to direct stimulation only with an AP of reduced size and acquired the ability to respond to acetylcholine application with a maintained contracture (indication of maybe long-range communication).
- With the nearly finished metamorphosis, the slow muscle fibers of the small frog (no tail remained) become electrically innervated by their own slowly conducting motor axons and show their adult characteristic properties: the ability to respond with a maintained contracture and the inability to generate APs. The neural control of the slow muscle fibers has fully been taken over by the small motoneurons with the thin, slowly conducting axons. The twitch muscle fibers kept their control by the large motoneurons with the thick, fast conducting axons, even though a transient reduced innervation indicates that the slowly conducting axons communicated also with the twitch muscle fibers, but could not take control over. This 4-cell-communication, including competitive interaction between motoneurons, indicates that attractive and repulsive factors are necessary to generate a specific neuromuscular innervation pattern.
- To clarify morphologically the generation of the adult innervation pattern and especially the distances of action of short-range attraction and repulsion, morphology was performed, mainly by electron microscopy. In spite of an over-innervation of the twitch muscle fibers during metamorphosis, no degenerating twitch fiber synapses were found. However, in the small frog stage, degenerating axons were found at the nerve entry to the muscle.
- Slow muscle fibers in the tadpole stage (20mm tail length), which had only electrical contact with fast conducting axons, showed two kinds of axon contact structures:
- Extended synapses with no synaptic folding, which were the synapses from fast conducting axons, transiently established on slow muscle fibers.
- Three kinds of axon endings, namely axons with dilatations, exploring looking like synapses with dilatations on slow muscle fibers, and pre-synaptic profiles containing sometimes synaptic vesicles. These axon profiles, making contact with the slow muscle fibers, seem to be the first occurrence of the slowly conducting axons during target invasion at that developmental stage. Here they start to exert a trophic influence onto the slow muscle fibers, but have not established synaptic transmission.
- In the small frog stage (just no tail remained), slow muscle fibers received contacts from different adjacent synaptic axon profiles. In some cases, one synaptic profile was a part of the already functioning synapse of a slowly conducting axon, whereas the other profile was the remained synapse of a fast-conducting axon.
- The morphology of target invasion and selection indicates that for the competitive interplay between the two kinds of motoneurons for their target cells, the two kinds of muscle fibers, contact attraction and repulsion took place between the axon endings of the two types of motoneurons and the target muscle fiber. The distance of action of attractive and repulsive factors was 0.1μm or less.
- If the human nervous system is as complex as the frog nervous system, we can expect that for a learning-based repair of injury sites, the human CNS needs some kind of scaffold along which growing fibers can extend. The effective short-range (contact) distances of action of growing and inhibiting substances are probably also in the range of 0.1μm. For the building of specific innervation patterns, precise geographical landscapes of concentrations of interacting substances are needed.
- A 17-year-old patient suffered a severe (motoric complete) cervical (C5/6) SCI. Upon 2.5 years of movement-based learning therapy (CDT), the sensitivity improved, some motor functions returned below injury level, and urinary bladder functions, breathing, and cardiovascular performance were cured. This indicates that some regeneration of the spinal cord had occurred. It also indicates that some propriospinal circuitry was repaired at the injury site, including the building of new motoneurons, since some finger functions returned upon 3.5 years of CDT [8, 45].
- Firstly, pressure and touch returned below the injury level, and later on pain and temperature. The later return of pain and temperature feeling can be understood on the basis of functional anatomy (Figure 49). The tractus spinothalamicus anterior, carrying pressure and touch information, was mainly spared by the injury. With regeneration, parts of the tractus spinothalamicus lateralis, carrying pain and temperature information and sited adjacent to the tractus spinothalamicus anterior, was partly repaired. It seems that the activated spared and newly regenerated fibers of the tractus spinothalamicus anterior (carrying pressure and touch information) attracted new fiber growth of the tractus spinothalamicus lateralis (pain and temperature). Target-derived growth factors seemed to have been released from the over-activated fibers and stimulated growth cones to extend along the surface of the axons of spared tract fibers (see below).
- Upon 3.5 years of optimal CDT, dorsal flexion of the index finger re-appeared indicating that some motoneurons were built anew. The dorsal flexion of the index finger is activated by the musculus extensor indicis, innervated by the radial nerve, ramus profundus, from the spinal segments C8-Th1, which were destroyed by the injury. According to the somatotopic ordering of the motoneurons in the ventral horn, in which the extensor motoneurons are sited ventrally, it seems that the activity in the tractus spinothalamicus anterior and lateralis, activated by CDT, attracted endogenous stem/progenitor cells for homing.
- First time in history, the regeneration of the human spinal cord of the 10-year-old Nefeli (Figure 1A-D) was measured by the re-innervation of segment-indicating muscles below the injury level of Th10 (Figure 30) [7]. It turned out that most of the approximate one-year lasting regeneration time was needed to cross the injury site. Then, the fastest nerve fibers regenerated with a speed of 1mm/day down to the muscles. Emphasis is put on the repair of the urinary bladder function, because its repair is most important for patients with SCI and may be spinal muscular atrophy. Unclear is whether mainly tract fibers regenerated in Nefeli or new neurons were built at the injury site and were used as a relay station. Anyhow, Nefeli ways able to learn to ride a bicycle (Figures 31, 32) besides walking and rudimentary running.
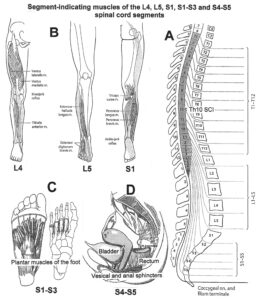
Figure 30: Segment-indicating muscles of the L4, L5, S1, S2/S3 and S4/S5 spinal cord segments for measuring the level of spinal cord regeneration. A. Relation between spinal cord and vertebra segments. B. The spinal cord segment L4 indicating muscle is for example the quadriceps. The extensor halluces longus is characteristic for the L5 segment. C. The plantar muscles of the foot represent S1 to S3 spinal cord segments. D. The vesical and anal sphincters are activated from the S4/S5 spinal cord segments. The skeletal muscles of the leg are innervated by α1, α2 and α3-motoneurons, but the external bladder and anal sphincters are innervated only by α2-motoneurons.
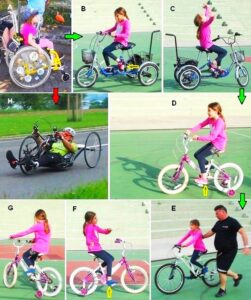
Figure 31: Relearning to ride a bicycle (A-G) instead of riding wheel instruments in the lying position (H) of patients with SCI. In B the feet are fixed. In C Nefeli is demonstrating the improvement of trunk stability. In D through G the feet are not fixed. E. With support of the father, Nefeli can manage a bit to ride a normal bicycle.
- It is important that the patient activates all spared and newly formed fibers and premotor networks, especially those circumferential to the injury or degenerating sites for contact attraction and repulsion. This aides in preparing the milieu for the integration of new cells and growing of axonal and dendritic arbors by performing all possible movements, especially the coordinated and integrative ones.
- Movement-based learning induced adult neurogenesis for repair in a human patient. It seems possible to assist endogenous stem cell reserves by exogenous stem cell.
 Figure 32: The SCI Nefeli just after learning to ride a normal bicycle at an age of 12.5 years (A). She manages also to ride curves (slalom) (B). She still has problems to keep the feet on the pedals, but when she slips from pedals, she has no problems to keep the balance (C). Note that she has to concentrate very much to keep the feet on the pedals (A), seven years after the SCI injury.
1 Introduction
1.1 Spinal cord repair in human
It was shown that if 50% (according to MRI) of the matter of a cervical spinal cord was spared following injury, the patient could relearn walking, running, and jumping and could become continent within two to three years of therapy [7]. The administered CDT could near-totally repair this incomplete SCI at C5/6 levels mainly by a functional reorganization. On the other hand, it was shown that if the SCI was 10 times more severe, meaning that 95% of the spinal matter was damaged, only partial spinal cord repair was possible [7]. A functional reorganization was no longer sufficient for a complete repair and the structural repair was too limited. The question is now, how can the regeneration over the injury site and the building of adult-born neurons be enhanced. Can an additionally applied exogenous stem cell therapy safely improve CDT? It seems that more specific in-vivo knowledge is needed of development and repair in animals and humans. The simple application of growth factors, neuroprotective drugs, genetically derives proteins or stem cells may not be helpful to improve the repair of the nervous system in humans.
In this article, the neural development of muscle innervation is compared with the repair following nerve injury in the frog and the mechanisms of building a specific innervation pattern is studied. It is then attempted to translate the animal data to human data by analyzing how in a patient with a severe cervical SCI a partial repair took place and to find mechanisms which are conductive for repair in spinal cord injury and spinal muscular atrophy. As will be shown, distances of action of target-derived growth factors and electromagnetic fields of natural action potential (AP) impulse traffic from the spared fibers may be of crucial importance for a regeneration and building of new neurons. Because of the necessary close relationship between repair and specific activation of the spared spinal cord tissue (circumferential to the injury site) for regeneration and building, engraftment, and integration of adult-born neurons, an exogenous stem cell therapy can only be successful if it is administered together with a movement-based learning therapy, which stimulates already neuronal network repair, including regeneration and building of new neurons from endogenous stem cells. The exogenous stem cell therapy would just supply more stem/progenitor or other cells for the repair process by offering more cells for repair since the available amount of endogenous stem cells for repair seems to be very limited. The occurring instabilities, due to the changed network connectivity, can probably be managed by movement-based re-learning of integrative movement patterns [8, 12]. The training of integrative movement patterns will help to avoid the building of spontaneously firing sub-networks which may be the triggering points for pathologic patterns like convulsions.
The comparison between development and repair in an animal model and the human spinal cord, may lead to a better understanding of the repair mechanisms at the cellular level.
1.2 Interactions between two kinds of motoneurons and two types of muscle fibers
Frog skeletal muscles possess two distinct types of muscle fibers: twitch muscle fibers, which are innervated by large fast conducting (and growing) motor axons, and slow muscle fibers, which are innervated by small slowly conducting (and growing) motor axons [48, 49, 50]. While twitch muscle fibers respond with an action potential (AP) to direct stimulation, slow muscle fibers are normally unable to do so [51]. Furthermore, slow muscle fibers are able to maintain a sustained contracture in response to depolarizing drugs in contrary to twitch muscle fibers which produce tension only transiently [52].
Both the electrical and the mechanical properties of the slow muscle fibers are neurally controlled, and after denervation slow muscle fibers acquire the AP mechanism [53] but preserve the maintained contracture. Because the thick fast conducting motor axons regenerate more quickly than the thin slowly conducting axons following nerve injury, twitch and slow muscle fibers become first re-innervated non-selectively by the fast-conducting axons [54, 55]. Being innervated by the (wrong) fast conducting axons, the slow muscle fibers lose their maintained contracture [56, 57, 58]. This phase is transient. The slow fibers lose the AP mechanism, and become able to generate sustained contractures again, when slowly conducting axons re-establish normal synaptic contacts [57, 59]. The time course of contracture properties is controlled by Ca2+ transients [60].
Changes of functional properties seem to be a general feature during the ontogenetic differentiation of cells and cell properties [61, 62, 63]. In the newborn cat, for example, all muscles show long contraction times. Within 6 weeks, some of these muscles become fast (for example the flexor digitorum longus muscle), whilst other ones stay slow (soleus muscle). This differentiation into fast and slow muscle fibers is guided by the nervous system [64]. Under the influence of the innervating nervous system, the differentiation of the contractile and membrane properties of the muscle fibers in the latissimus dorsi anterior and posterior muscles in chicken follows a similar way [65, 66]. In chick embryos the ‘neurotrophin hypotesis’ was put forward by showing the target-dependent nature of embryonic pruning of neuritic branches and cell death [67, 68, 69].
As is shown in this translation from animal to human data, the generation of the specific neuromuscular innervation pattern is not only a target-dependent property, but is also influenced by the innervating motoneuron types. In human skeletal muscles there are three kinds of muscle fibers (fast fatigue, fatigue resistant, and slow muscle fibers) which are innervated by three kinds of motoneurons; α1, α2, and α3 (Figure 5). These are characterized by a group conduction velocity, a group nerve fiber diameter of their axons [70, 71] (Figures 3, 4) and their rhythmic firing property for high excitation [72] (Figure 5). The developmental pattern of innervation has not been studied so far. But during repair, the establishment of innervation patterns may be partly understood by recording electromyographic activity from the different kinds of muscle fibers (Figure 6).
The main aim of the present investigation in the frog is to demonstrate that the neural control of electrical and mechanical properties of slow (and twitch) muscle fibers during development is similar to that following nerve injury (denervation), and that the intricate neural control changes of two kinds of muscle cells by two kinds of motoneurons cannot be extracted alone from the morphologic data at different stages of development. Functional measurements are also needed. To study in detail this 4-cell communication, including competitive interactions between the two kinds of motoneurons, morphologic and electrophysiologic measurements are needed and have to be related to have a full understanding of this period of frog neural development. The generation of specific innervation patterns during development expresses better the cooperative and competitive interactions among the two nerve and two muscle cells than during regeneration following injury, since mainly no disturbing degenerating nerve fibers and synapses (motor endplates) disturb the morphological interpretation. The main difficulty in this tadpole study was the electrophysiology. To impale two glass micropipettes into a muscle fiber of approximately 10μm diameter of a muscle of 1mm length and 0.15mm diameter, without (or only little) damaging the muscle fibers, is quite a manual task.
2 Methods
2.1 Experimental layout
Experiments were performed on pyriformis muscles of tadpoles and small frogs (Rana temporaria) from a natural breeding-pond. In the course of their development, the tadpoles grow to a maximum size with a maximum tail length of approximately 27 ± 1mm. At this stage the experiments were started. During the following stages of metamorphosis, the length of the tails decreased while the lengths of the bodies remained fairly constant (12 ± 1mm from head to coccyx). The forelimbs broke through the skin at about 10-15 mm tail length, and at about 20 to 15mm tail length the hind limbs had grown to a size which changed only marginally until the tail had disappeared. When the small frog had no tail remaining, the experiments were discontinued, because there remained no longer an obvious external criterion to distinguish the further stages of development. The time for the developmental period from the tail length of 27mm to 0.5mm was measured in 2 tadpoles to be approximately 6 days at 18°C, when keeping them in an aquarium. Using the comparable relationship between the reduction of the tadpole tail length and the age of the tadpole from Moser [73], an approximate age scale for 18°C, corresponding to the tail length, could be drawn (Figures 35, 36).
2.2 Intracellular recording
The pyriformis muscles were removed together with the spinal nerves IX and X [74] and a part of the spinal cord. To avoid twitching, the muscles were mounted on a polyethylene rod and stretched to about 150% of their in-situ length (for further details see [75]). Nerves and spinal cord were carefully sealed into a Perspex chamber which contained a pair of platinum electrodes 1.5mm apart. The distance between stimulating cathode and the site of entry of the nerve into the muscle was approximately 5mm. Square pulses of 0.1ms duration were applied.
Conventional intracellular techniques for potential recording and current application were used [76]. Micropipettes were filled with 3M KCl; their tip resistance was about 100 MΩ.
The current passing microelectrode was placed at a distance of 50-200μm from the recording electrode. All muscle fibers were hyperpolarized to a resting potential of -90mV; hyperpolarizing and depolarizing current pulses were of 100ms duration. Approximate values for the membrane time constant were obtained by measuring the time of the electronic voltage deflection to reach 85% of its final value.
The temperature of the nerve-muscle bath was held between 7 and 9°C. Ringer’s solution had the following composition (mM): NaCl 100, KCl 2.5, CaCl2 16; the pH was 7.3 with Tris buffer (5mM). The high calcium concentration helped to identify the slow muscle fibers, because their effective resistance increases more than that of twitch fibers in calcium-rich media [77, 78].
2.3 Mechanical recording
The isometric tension of pyriformis muscles was recorded with a UF2 mechano-electric transducer and a two-channel recorder at room temperature. Normal saline solution contained (mM): NaCl 110.4, KCl 2.5, NaHCO3 2.4, CaCl2 7.2. To elicit contracture, acetylcholine was added to reach a concentration 10-4 g/ml. High potassium solution (100mM) gave the same result.
2.4 Electron microscopy
For electron-microscopic examination, the muscles were fixed in 2% glutaraldehyd in phosphate buffer (266m osmol/l) for 3 hours at room temperature. After washing with the same phosphate buffer (24 hours at room temperature) fixing with 1% osmium tetroxide in phosphate buffer and dehydration in ethanol the muscles, sectioned into three parts, were transferred through propylene oxide into liquid epon 812. Ultrathin sections were cut with a Reichert ultramicronome OMU 3, stained with uranyl acetate and lead citrate, and then investigated in the electron microscope (Siemens Elmiskop 101).
3 Results
3.1 Identification and some properties of twitch and slow muscle fibers and their innervating motoneurons
32 pyriformis muscle fibers were successfully examined to determine certain properties of slow and twitch muscle fibers and their innervating motor axons at different stages of development (metamorphosis). The main difficulties were the softness of the tissue and the smallness of the muscle fibers. In adult frogs, twitch and slow muscle fibers can be distinguished by their membrane time constant (which differ by a factor of approximately 50) and their input resistance (which differ by a factor of approximately 6) [78].
The diameter of the muscle fibers (in the developmental range examined) varied between 2 and 20μm (Figure 40). The diameters were roughly measured under the dissecting microscope during the experiments and confirmed with measurements under the electron microscope. The fibers of the small frogs were only slightly larger than those of the tadpoles. The slow muscle fibers and the small twitch muscle fibers had an average diameter of 5μm in the slow muscle fiber region of the muscle and the large twitch muscle fibers had an average diameter of 15μm. In adult frogs the muscle fiber diameters are between 30 and 100μm in the pyriformis muscle. The damage, therefore, produced by impaling the micropipettes into the small muscle fibers, may have been considerable, and the values summarized in Table 1 should be taken only as a rough approximation. By comparing the slow muscle fibers with the small twitch muscle fibers in Table 1, it is clear that the identification was not always possible from the passive membrane properties alone. Slow muscle fibers were, therefore, discriminated from twitch muscle fibers by the absence of full action potentials (APs), or by a time constant longer than 40ms. A few unidentified fibers were discarded.

Table 1: Membrane properties of twitch and slow muscle fibres of tadpoles during different stages of development. Measurements were performed in ‘Ringer’ solution with 16mM Ca. By hyperpolarizing current application, the fibres were hold to a resting potential of -90mV. In fibre group III are only slow muscle fibres are contained, which could not generate an action potential.
3.2 Electrophysiology
3.2.1 Muscle fibers with and without action potentials
In tadpoles with tail lengths larger than 18mm all twitch muscle fibers (Figure 33A) and most slow muscle fibers (Figure 33B) responded with an action potential (AP) to direct electrical stimulation. The endplate potentials in slow muscle fibers, however, were unable to trigger an AP. The latencies of the endplate potentials and stimulation thresholds were of the same order of magnitude for both kinds of muscle fibers. The innervating axons were therefore regarded as belonging to the same population of motoneurons. As will be clarified below, these were the fast-conducting axons, which in adult frogs innervate the twitch muscle fibers only. Later in development (tail length ≈ 12mm) the slow muscle fibers responded with an AP of reduced size (Figure 33C), but were still innervated by the fast axon population of large motoneurons. In small frogs (tail length ≈ 0.5mm) the slow muscle fibers no longer generated APs (Figure 33D). The latencies of their endplate potentials were much longer, and the stimulation thresholds were at least twice as high as those for the axons innervating twitch muscle fibers or slow muscle fibers investigated at earlier developmental stages. Obviously, another population of motor axons had established synaptic contacts with the slow muscle fibers. As will be shown later, these were the slowly conducting axons of small motoneurons which in adult frogs innervate the slow muscle fibers.
In Figure 33 it is included (from the morphology of below) that in B the fast-conducting axons form the extended endplate (‘en plaque’) on the slow muscle fiber, in C the fast and slowly conducting axons form the endplates at the same place (of ‘en plaque’ and ‘en grappe’ type) and in D only the ‘en grappe’ endplate is remained on the slow muscle fiber of the slowly conducting axons.

Figure 33: Intracellular recordings from a twitch muscle fiber of a tadpole with 19.5mm tail length (A) and from slow muscle fibers at three stages of tadpole development (B, C, D). a: hyperpolarizing electronic potentials (upper trace; recorded with the voltage electrode) induced by hyperpolarizing current pulses (lower trace; generated with the current applying glass micropipette) to identify the muscle fiber type; b; depolarizing current pulses (lower records), triggering action potentials (APs) in A, B, and C. c: endplate potentials elicited by nerve stimulation (arrows indicate time of stimulation) and made visible with the voltage recording glass electrode). B. Records obtained from a slow muscle fiber with 19.5mm tail length, innervated by a fast-conducting axon, and responding with an AP (same muscle as records in “A”). C. Slow muscle fiber of a more developed tadpole (tail length = 11.5mm). The fiber was still innervated by a twitch fiber axon (fast-conducting) and responding with an AP of reduced amplitude, marked by an arrow. D. Slow muscle fiber of a young frog with no tail, which is innervated by a slowly conducting axon and does not respond with an AP (normal situation as in adult frogs). In record B,b (upper trace), the recording electrode slipped out of the muscle fiber after the electronic potential. Calibration: voltage 40mV; time 40ms; current 20nA for “A,” and 4nA for B, C, and D; exceptions are indicated. The morphology of the ‘en plaque’ type synapse of fast-conducting axons and the ‘en grappe’ type synapse of slowly conducting axons are taken from Figures 45 and 46 and are inserted in B and C/D (at the corresponding developmental stage). In B the fast axon controls the slow muscle fiber and in C/D both axons compete for functional innervation. In D, the slowly conducting axons won the competition (no morphology available).
3.2.2 Twitch and slow muscle fibers and their innervating motor axons during development
The sciatic nerve of tadpoles and small frogs was too short for measuring conduction velocities. Slow and fast conducting motor axons were therefore identified by the latencies of the endplate potentials and by the stimulation thresholds, which were approximately twice as high for slowly conducting axons than for fast conducting axons [54]. Figure 34 shows that slow and twitch muscle fibers in the tadpole are innervated by fast conducting axons (Figure 34A) which innervate only twitch muscle fibers in the adult frog. When the tadpole had transformed into a small frog (tail length shorter than 6mm), slowly conducting axons also started to make synaptic contacts (Figure 34B), but only with slow muscle fibers. The latencies of the two axon populations decreased with further development to reach the adult values (Figure 34C).

Figure 34: Slow and fast-conducting axons measured by the latency. Latencies of endplate potentials of fast-conducting axons (yellow) and slowly conducting axons (light blue) recorded from 19 tadpoles (A), 14 young frogs with tail length shorter than 6mm axons (B), and adult frogs (Rana temporaria) (C). In A, the slow muscle fiber are only innervated by the fast-conducting axons. In B, the slow muscle fiber is innervated by fast and slowly conducting axons, which compete with one another for functional innervation. The morphology of the ‘en plaque’ type synapse of fast-conducting axons and the ‘en grappe’ type synapse of slowly conducting axons are taken from Figures 45 and 46 and are inserted in A and B. In the adult frog in C, the fast-conducting axons innervate the twitch muscle fibers and the slowly conducting axons the slow muscle fibers selectively; an ‘en grappe’ synapse (light microscope picture) is inserted.
3.2.3 AP amplitude of slow muscle fibers in dependence on the types of motoneuron innervation
Figure 35A relates the amplitude of APs, recorded from slow muscle fibers, to the tail length. It shows that the slow fibers do not respond any more with an action potential for tail lengths shorter than 10mm, while slowly conducting motor axons were found only in tadpoles with tail lengths shorter than 2.5mm. This means that the AP mechanism disappeared prior to the establishment of neuromuscular transmission by slow-conducting motor axons. Figure 36A shows the percentage of slow muscle fibers innervated by fast or slowly conducting axons. Initially, the percentage of slow muscle fibers, innervated by fast-conducting axons, increased with development, but then decreased before the slowly conducting axons established neuromuscular transmission. Transient simultaneous re-innervation by fast and slowly conducting axons of slow muscle fibers was observed after denervation [54]. Such slow fibers may have escaped detection in this work due to technical difficulties or because the number of observations was too small.
 Figure 35: A. Action potential amplitude (ordinate) of slow muscle fibres as a function of tadpole tail length (abscissa). Open circle (○), muscle fibres innervated by fast axons; open circle with diagonal line (Ø), muscle fibre innervation not checked; open circle with a cross, muscle fibres which were not innervated; filled circle (●), muscle fibres innervated by slowly conducting axons (note that slowly conducting axons made electrical contact with the slow muscle fibres at tail lengths shorter than 2.5mm). B, isometric tension of pyriformis muscles measured 5min after application of 10-4g/ml acetylcholine. Line drawn by eye. Lower part of ‘B’: Age of the tadpoles in days corresponding to the length of the tail.
3.2.4 Double innervation of twitch muscle fibers
In a high percentage of recordings from twitch muscle fibers, double innervation could be observed. In most cases the endplate potential component with the lower stimulation threshold was too small to trigger an AP. In a few fibers the latency of the endplate potentials with the higher threshold was shorter. In the ‘pure’ twitch fibers region of the muscle, all muscle fibers were innervated and double innervation was most frequent during the developmental stage characterized by tail lengths of 15mm. With further development, the percentage of double innervated twitch muscle fibers decreased to a minimum value of around 10% before it increased again. This period during which few twitch fibers were only double innervated (tail length ≈ 3mm) coincides with the establishment of neuromuscular transmission of slowly conducting axons onto slow muscle fibers (Figure 36A). This transient reduction of double innervation may, therefore, be interpreted as an unsuccessful try of the slowly conducting axons (innervating in adult frogs only slow muscle fibers) to innervate also the twitch muscle fibers.
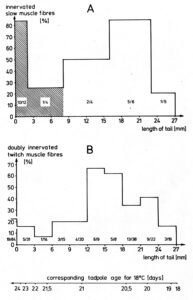
Figure 36: A. Innervation of slow muscle fibres as a function of tail length. Open columns represent muscle fibres innervated by fast conducting axons and hatched columns represent fibres innervated by slowly conducting axons. The first number in a column gives the number of innervated fibres and the second number the total number of measured muscle fibres. B. Double innervation of twitch muscle fibres in the twitch fibre region of the pyriformis muscle in relation to tail length. The first number in the column gives the number of double innervated fibres and the second the total number of measured fibres.
3.3 Isometric tension
It was of great interest to establish the relationship between the ability of the muscles to respond with a maintained contracture, and their functional innervation by slowly conducting motor axons. Figure 37 shows the isometric tension of pyriformis muscles elicited by acetylcholine application at different stages of development. The muscle in Figure 37A (tail length = 23mm) developed tension only transiently, whereas the muscle in Figure 37B (obtained from a tadpole with a shorter tail length (10mm)) showed a small maintained contracture. In Figure 37C a maintained contracture is shown from a muscle at a later stage of development.
 Figure 37: Isometric tension developed by a muscle of a tadpole (A) (tail length 23mm), a very young frog (B) (tail length 10mm), and a small frog (C) (no tail, body length 15mm; a stage far beyond the examined developmental period) upon application of Ach 10-4g/ml (1.8mM Ca in Ringer). Small arrows indicate the time of application of Ach, open arrows the end of tension.
In Figure 35B the isometric tension measured 5min after addition of acetylcholine was plotted against tail length. It was observed that the muscles started to respond with a maintained contracture when the tail length had decreased to below 16mm; this corresponds to the developmental stage when the slow fibers started to lose the AP mechanism (Figure 35A). Thus, the inability of AP generation and the ability of maintaining tension developed simultaneously and prior to the establishment of synaptic transmission by slowly conducting motor axons.
3.4 Conclusions from the electrophysiological results
The experiments demonstrate that during metamorphosis of the frog, fast conducting axons establish neuromuscular transmission non-selectively with both twitch and slow muscle fibers as occurs during nerve regeneration [54]. At a tail length of around 18mm twitch muscle fibers became doubly innervated at the same time when the slow muscle fibers become innervated by fast axons (Figure 36). It seems, therefore, that the fast-conducting axons still have a preference to innervate the twitch muscle fibers. At a later period, at tail lengths less than 5mm, the slow muscle fibers became innervated by slowly conducting axons (Figures 35A, 36A). Twitch muscle fibers showed a transient reduction in the percentage of double innervation at that stage (Figure 36B). This observation may show that the later arriving slowly conducting (and growing) axons also tried to innervate the twitch muscle fibers, but lost the competition with the fast-conducting axons.
Slow muscle fibers developed a maintained contracture (Figure 35B), and began to lose the AP mechanism (Figure 35A), at a period (developmental stage) before their innervation changed from fast to slowly conducting axons. The neural control of contracture and AP mechanism of slowly conducting axons on slow muscle fiber is, therefore, exerted independently of muscle activity, because during metamorphosis, the slow muscle fibers are mostly innervated by fast conducting axons. This finding is in full agreement with the neural control of contracture, during re-innervation, which is also independent of muscle activity [57].
In slow muscle fibers of tadpoles with long tails the endplate potential of fast-conduction axons did not trigger the AP (Figure 33Bc). This can be understood if it is assumed that in that developmental stage the AP mechanism is only present in certain areas of the slow muscle fiber membrane and the endplate potential is not large enough at these regions to reach the threshold. In support of this view, it was found that in slow muscle fibers in which the AP has been induced at localized areas by partial denervation, the endplate potential generally failed to trigger an AP [79, 80] (next paragraph).
3.5 Local development of action potentials in slow muscle fibers after partial denervation with respect to localized membrane properties in the adult frog
Figure 38AB shows fully developed action potentials in a fully denervated slow muscle fiber. Even repeated action potential firing occurred in some similarity to α2-motoneuron firing in human (Figures 5, 11). As if the membrane properties of denervated slow muscle fibers of the frog are similar to the membrane properties of α2-motoneurons in human.
Figure 38C shows action potentials and end-plate potentials in a partially denervated slow-muscle fiber.
During development and repair, the neural control onto the slow muscle fibers was exerted by the innervating motoneurons. Now it will be shown that the neural control can also change properties of parts of muscle cells.
Because in adult frogs 20% of the slow muscle fibers are innervated by two slowly conducting axons, it becomes possible to study localized membrane properties through a partial denervation of slow muscle fibers in the way that one of the innervating axons is cut.
It will be shown in the frog model that neural network learning involves not only synaptic weights but also changing of membrane properties and passive conduction of sub-synaptic potentials from the dendrites to the axon hillock were the action potentials (APs) are generated (Figure 10) and actively conducted along the axon to the axon tree.
A neuron in the CNS is on average connected to 4000 other neurons. In the frog model for simplicity, a cell (muscle fiber) is considered. Having a slow muscle fiber, innervated by two motoneurons of which one axon is cut, the still innervated part can generate an endplate potential by nerve stimulation, whereas the denervated part generates action potentials by direct muscle stimulation. Parts of the membrane therefore conduct potential changes actively like in an axon and passively like in the soma and dendrites. In Figure 38C a partially denervated slow muscle fiber is shown in which in one part a sub-synaptic potential (endplate potential) is generated (innervated part) (like in the neuron soma) and in the other part an action potential is generated (denervated part) (like at the axon hillock).
Slow muscle fibers of frogs normally do not generate APs to depolarize the muscle fiber to increase Ca2+ concentration for contraction. The slow muscle fibers are depolarized by the endplate potentials of distributed endplates of ‘en grappe’ type (Figure 42) connected to one or two thin motor axons. When impaling a voltage and a current microelectrode into the slow muscle fiber (Figure 38C) and applying constant current, the membrane resting potential can be hold at -90 to -100 mV. Upon applying an additional current pulse for 100 ms, the muscle fiber can be transiently depolarized or hyperpolarized (Figure 38B). When hyperpolarizing the muscle fiber, the slow membrane potential deflection indicates high membrane resistance (» 10 MW) typical for slow muscle fibers. Twitch muscle fibers (not shown here) show a faster time course, have a lower membrane resistance (» 1 MW) and much shorter endplate potentials. When depolarizing a normal slow muscle fiber by a depolarizing current pulse, no AP is generated (similarly to voltage electrode impaling site 5 in Figure 38C). When depolarizing a denervated slow muscle fiber (cut nerve supply to the muscle), after 10 to 15 days (depending on the temperature) the frog slow muscle fibers generate APs similarly as in Figure 38A and B. Upon partial denervation of a slow muscle fiber (Figure 38C), which was innervated by two motor axons of which one was cut, the innervated muscle fiber part responds with a motor endplate potential (and no AP) and the denervated muscle fiber part with an AP (and no endplate potential). The AP and the endplate potential will spread electrotonically (passively) to other parts of the muscle fiber (lower part of Figure 38C). It seems therefore that the different parts of the muscle fiber are genetically differently controlled by the different muscle fiber nuclei.
APs are generated in the fully denervated slow muscle fibers of frog pyriformis muscles upon depolarization by current pulses of 100 ms duration (Figure 38A, B). The slow time course of the voltage deflection upon hyperpolarizing the fiber shows that the microelectrodes were impaled into slow muscle fibers. With increasing depolarizing current pulses (and fully developed AP mechanism) first one AP is mostly generated, then 2 APs (B) and then 3 APs (A). Note, with respect to the relative length of the interspike intervals, that the 2 AP impulse train in ‘B’ and the 3 AP impulse train in ‘A’ bear similarity to the impulse trains recorded from oscillatory firing human α2-motoneuron axons (Figures 5, 11).
In Figure 38C APs and endplate potentials are recorded along a partially denervated slow muscle fiber [80] by keeping the current microelectrode at site 1 (close to the nerve entrance to the pyriformis muscle) and impaling the voltage electrode successively along the muscle fiber from site 1 to site 5. At each site of the voltage electrode impalement, the muscle fiber was directly stimulated by a current pulse from the current electrode (the reference bath-electrode is not shown, muscle in frog Ringer solution) to elicit an AP, and indirectly stimulated, by applying to the nerve, innervating the muscle, a voltage pulse of 0.5 ms duration and 1 to 10 V amplitude, to elicit an endplate potential. The results of both stimulations are shown in the pictures related to the sites of successive impalements of the voltage electrode.
In the partially denervated slow muscle fiber (Figure 38C), the endplate potential did not elicit an AP generated in the other denervated part of the muscle fiber. But often the endplate potential, evoked in the still innervated muscle fiber part (here left side), was still high enough in the denervated muscle fiber part (here right side) to elicit an AP there, which was then actively conducted along the denervated area of the muscle fiber and spread then electrotonically (passively) into the innervated muscle fiber part.
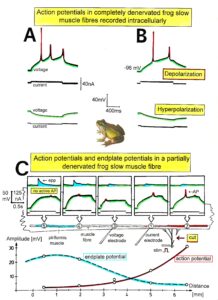
Figure 38: A, B. Action potentials recorded from denervated slow muscle fibers. Upper records, membrane potential; lower records, intracellularly applied current pulses. C. Endplate and action potential recorded at different points along a partially denervated slow muscle fiber. The upper half of the diagram is a schematic representation of the pyriformis muscle and motor nerve; one of the nerve branches entering the muscle was cut as shown. Insets of the upper part show endplate potentials (upper traces) and regenerative responses associated with depolarizing current pulses (middle and lower traces) recorded at the points 1 to 5 indicated by the arrows. Endplate and action potential amplitudes were plotted against distance from the nerve entry in the lower half of the figure. Note that the action potential amplitude was largest in that part of the slow muscle fiber where the endplate potential was smallest. The muscle fiber was investigated 9 days after nerve cut. Records were taken in the sequence (1) to (5).
Figure 39 shows another recording of generated action potentials and stimulated endplate potentials along a partially denervated slow muscle fiber. Action potential and endplate potential varied considerably in amplitude and shape over a distance of a few millimeters. The amplitude of the endplate and the action potentials varied inversely with distance. The recordings suggest that, following denervation, Na-channels are built into discrete areas of the slow muscle fiber membrane and this process depends on the amount of denervation in individual fiber [80].

Figure 39: Endplate and action potentials recorded at different points along a slow muscle fiber which had been denervated 7 days earlier by cutting several thin nerve branches entering the left part of the pyriformis muscle (shown schematically at point 0 in lower part of the figure). Otherwise, similar to Figure 38. Note that the endplate potential increases from left to right, while the action potential increases first from right to left, but decreases again towards the tendon end of the fiber (at distances greater than 3mm from the nerve entry). Records were taken in the sequence (d), (e), (c), (b), (a).
3.6 Effect of nerve length on the induction of action potentials in denervated slow muscle fibers in the adult frog – neurotrophic reservoir
Frog slow muscle fibers are usually unable to generate action potentials. It has been demonstrated, however, that this ability is acquired after denervation (Figure 38A, B), and it has been suggested that the inhibitory effect of the small motor axon on the slow muscle fiber membrane results from the release of a ‘trophic’ substance. This substance represses the synthesis, by the muscle fiber, of a protein molecule required for the formation of Na-channels [53]. It is conceivable that the trophic substance is synthesized in the perikaryon of the motoneuron, and transported centrifugally by axonal flow. Since axoplasmic flow continues for some time in nerve fibers disconnected from their cell bodies [81], the peripheral nerve stump left in contact with a denervated muscle could function as a reservoir of ‘trophic’ material. The properties of denervated slow muscle fibers might thus be preserved longer if the nerve is cut far from the muscle.
In an experiment, it was found that the slow muscle fibers acquired the ability to generate action potentials several days after denervation and the duration of the latent period depended on the length of the peripheral nerve stump, and on the temperature at which frogs were kept after the denervation operation. At 18°C the latent period increased by 0.36 days per mm of sciatic nerve stump [82]. It was suggested that the peripheral nerve stump serves as a reservoir of ‘trophic’ material which is transported towards the slow muscle fibers at a rate of 2.8 mm/day (at 18°C) and seems to block the formation/functioning of Na channels. The Q10 value of this transport system would be 2.7.
Now it will be turned back to the development of the frog and analyze the morphology of the neural control of the two motoneurons onto the slow muscle fibers and measure how long the distances of action of neurotrophins could probably be.
3.7 Morphology (electron microscopy)
3.7.1 Four-cell communication to derive action distances of grows and inhibition factors for the repair of the injured human CNS
The electrophysiological measurements showed a functional four-cell communication during development. Two motoneuron populations (with fast and slowly conducting axons) competed for the innervation of two muscle fibre types (twitch and slow muscle fibres). Since the large motoneurons with the fast-conducting axons grow faster than the small motoneurons with the slowly conducting axons, the fast-conducting axons reach first the pyriformis muscle and innervate their own twitch muscle fibres and also the slow muscle fibres, which in adult frogs are innervated by the slowly conducting axons of small motoneurons.
At that stage of development, tadpoles have a long tail and the forelimbs are still under the skin, but the tadpole is using the hind limbs. Tadpoles without hind limbs are just lying on the ground when they rest. However, tadpoles having already hind limbs, are using them. The positioning of the legs is somehow similar to that of adult frogs. Therefore, during metamorphoses, the animal is using what is possible according to the developmental stage. It uses the muscle fibres which are functioning already, even though the slow muscle fibres are innervated by the (wrong) fast axons and have similar properties as the twitch muscle fibres. The slow muscle fibres can morphologically be identified by their structure, which does not change during neural control changes (see below). Therefore, without functional measurements (electrophysiology, tension measurements) it would not be apparent that the slow muscle fibres have at that stage of development fast properties similar to twitch muscle fibres.
With further development (metamorphoses) the slowly conducting axons reach and invade the pyriformis muscle and communicate with the slow muscle fibres, the twitch muscle fibres, and the fast-conducting axons for target selection. They take over control of the slow muscle fibres before their synapses make electrical contact; the slow muscle fibres are reducing their membrane excitability (decrease of AP amplitude) and start to generate a sustained contracture. The neural control of the fast-conducting axons is terminated when the slow axons have built a fully functioning motor endplate (including the generation of endplate potentials) and have fully taken control over. The slowly conducting axons also communicate with the twitch muscle fibres, quantified by the transient reduction of the double innervation of the twitch muscle fibres, but cannot take control over of the ‘foreign’ twitch muscle fibres.
An important question is now, how the slowly conducting axons take over the control morphologically. This will give further insight into the mechanisms of cell communication. Over what distances are communication substances (including target-derived grows factors) working? Are the axons of different kinds of motoneurons (with specific intrinsic states during development) attracted by target-derived growth factors from the muscle fibres and form their synapses, or do the two kinds of motoneuron axons also compete with one another for the target (the slow muscle fibres)? In denervation experiments, transient simultaneous re-innervation of slow muscle fibres by both fast and slowly conducting axons was observed. Following denervation, the regenerating axons innervate the area of the former motor endplate and it is therefore likely that the slowly conducting axons will try to form their motor endplates at the place where the fast-conducting axons have positioned their motor endplate. Since the twitch and slow muscle fibres have a different morphologic structure and the fast and slowly conducting axons are forming different kinds of motor endplates (see below), deep functional and structural insight of this four-cell communication will be obtained. The approximate distances of growth factor actions will be measured. The distances of action of growth and inhibition factors may give information on the structural repair during endogenous and exogenous stem cell therapy, because the regeneration follows a similar schedule. A better understanding of the homing of adult-born neurons and the specific growth of axons and dendrites may show how to improve Coordination Dynamics Therapy (CDT) to repair more efficiently the injured, malfunctioning, or degenerating human CNS, including spinal muscular atrophy.
3.7.2 Cross-section of the pyriformis muscle
Figure 40 shows an electron microscope picture of two-thirds of the cross-section of the pyriformis muscle of a small frog with no tail. The muscle fibre diameters vary approximately between 5 and 30μm. In the upper part a small nerve branch can be seen with some myelinated nerve fibres. Several motor endplates are indicated by arrows. At this amplification, not much information can be obtained concerning the type of muscle fibres (slow or twitch) and the kind of motor endplates from fast or slowly conducting axons.

Figure 40: EM cross section of 2/3 of a pyriformis muscle of a young frog (tail length ≈ 0.5mm). The small muscle fibres (average diameter ≈ 5μm) lie in the area (upper right) where the slow muscle fibres are mainly sited. Many of the cell nuclei have a position intermediate between edge and centre of the muscle fibres. A cross section of the pyriformis muscle of a tadpole looks very similar. Arrows indicate cross-sectioned motor endplates.
3.7.3 Twitch and slow muscle fibers at the tadpole stage
In tadpoles with a tail length of 20mm, two types of muscle fibers could be distinguished. One muscle fiber type was characterized by containing many mitochondria; the Z-lines are straight, and the existence of an M-line in the middle of the A-band (Figure 41A). This muscle fiber type matched the criteria of twitch muscle fibers of the adult frog and was therefore considered to be a twitch muscle fiber. In a second kind of muscle fiber, the Z-line had mostly no straight-line shape, typical M-line was missing (Figure 41B), and mitochondria could only seldom be found. This muscle fiber type corresponds to the slow muscle fibers in adult frogs. In cross-sections, the twitch and slow muscle fibers cannot clearly be distinguished by the form of the myofibrils [83].
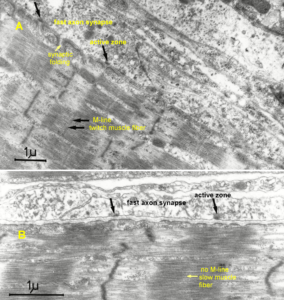 Figure 41: A. Electron microscopic longitudinal section of two twitch muscle fibers with one synapse each; tadpole with 20mm tail length. The synapses were over 60μm long. Three active zones are marked with arrows; two M-lines are marked with double arrows. B. Electron microscopic picture of a slow muscle fiber synapse of a tadpole (tail length 20mm). The motor endplate is the nerve ending of a fast-conducting axon since the axon profiles are long and have active zones, marked with arrows. No synaptic folding. Note that the for slow muscle fibers typical missing of the M-line in the A-band and the not linear course of the Z-line.
3.7.4 Synapses of twitch muscle fibers in the tadpole stage
In longitudinal sections of tadpole muscles in Figure 41, two twitch muscle fibers can be seen with one synapse each. The motor endplates were longer than 60μm and can be judged as extended synaptic profiles, even though shorter endplates were found at twitch muscle fibers. Synaptic folding was often opposite to electron-dense membrane areas, at which synaptic vesicles accumulated (these are the active zones according to [84]). A comparison with the synapses of adult frogs [85, 86] shows that the twitch muscle fiber synapses had already the shape of matured ones, even though their extension was 10 times shorter.
3.7.5 Criteria to identify the synapses of fast and slowly conducting axons innervating slow muscle fibers
The large synapses shown in Figure 41A and the active zones of the pre-synaptic membranes are characteristic for synapses which fast conducting axons form on twitch muscle fibers in the adult frog. The synaptic endings of fast conducting axons can therefore be identified by these properties. The sub-synaptic folding, on the other hand, seem to be a property which is determined alone by the muscle fiber type, since they are conserved following cutting and degeneration of the innervating motor axon [87].
The ‘en grappe’ form of slow muscle fiber synapses [88-91] (Figure 42a, b) and the missing active zones are obviously typical for slow muscle fiber synapses in the adult frog. Since slowly conducting axons are building these synapses, the ‘en grappe’ synapse form and the lack of active zones will be used in the following for the identification of nerve endings of slowly conducting axons.
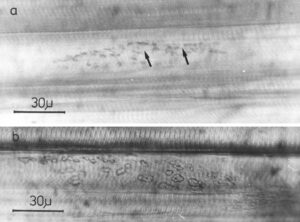 Figure 42: Light microscope pictures of slow muscle fibre synapses (nerve endings of slowly conducting axons) of pyriformis muscles of an adult frog. a. methylene blue staining; the ‘en-grappe’ form of the nerve ending can be recognized (dark profiles can be seen of 2 to 3μm extension which are connected by nerve fibres (marked with arrows)). b. Karnovski-staining [92]; the areas of increased cholinesterase activity have ‘en-grappe’ form and are partly larger than 3μm.
3.7.6 Slow muscle fiber synapses in the tadpole stage of development
In the adult frog, the synapses of slow muscle fibers are of ‘en grappe’ type (Figure 42); they have different forms and consist of single a few μm long synaptic contacts, which are arranged in rows and complexes [90]. Electron microscope examinations show that in adult frogs 1 to 3 axon profiles can be aligned with an extension of 1.5 till 4μm each [90, 91]; but not more than 2 axon profiles were found to be close together.
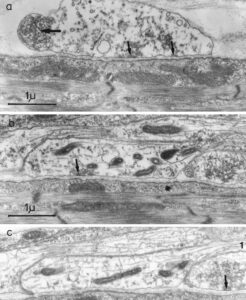 Figure 43: Electron microscopy of a part of an extended slow muscle fibre synapse of a tadpole (tail length 20mm). It is the motor endplate of a fast-conducting axon since active zones (thin arrows) are present and the profiles are quite extended. No synaptic folding can be found. a. Synapse profile with a protrusion (thick arrow) filled with large vesicles which had no synaptic contact with the slow muscle fibre membrane. b, c. Other part of the same synapse; three axon endings from two different sections can be seen. Not in all sections active zones were present. A pre-terminal axon of at least 0.25μm diameter of a fast-conducting axon is marked with ‘1’.
In the tadpole stage (tail length ≈ 20mm), the existing slow muscle fiber synapses differed in several characteristics to those in adult frogs. Eight slow fiber synapses were examined in longitudinal sections to get information concerning form, extension, and existence of active zones. The synapses were longer than 10μm and showed up to 5 compact synapse profiles, of which at least one profile was longer than 4μm (Figure 41B). In nearly all synapse profiles, active zones could be found. As Figure 43b and c show, the active zones could not be found in each slice; for it to be apparent, several slices had to be examined. The large synapse extension (longer than 10μm) and the existence of several synapse profiles with active zones allow the conclusion that these slow muscle fiber synapses were formed from the nerve endings of fast conducting axons.
In 6 synapses the diameters of the pre-terminal axons were between 0.15 and 0.30μm (Figure 43b and c). In centrally cut axons, microtubules can be seen with diameters of 16nm (Figure 43). In 4 slow fiber synapses 1 to 2 axon profiles were found, which were filled with vesicles with larger sizes than those close to active zones (Figure 43a). Such vesicle structure resembled those found in degenerating synapses with vesicle aggregation following nerve section [87]. Some of the axons had in the area of vesicle aggregation contact with the muscle service, but other ones did not (Figure 43a, thick arrow).
Besides synaptic nerve endings, elliptic structures were found, which were surrounded by an external lamina, which contained mitochondria and formed with the slow muscle fiber a threefold membrane which is typical for synapses (Figure 44). Most likely, Figure 44 shows an axon with dilatations, which was growing along a slow muscle fiber or was retracted [93, 94] and had via the dilatations close contact with the muscle fiber.
In combination with the electrophysiological results, it concluded that the muscle fibers in the tadpole stage were innervated and neurally controlled by the fast-conducting axons. Furthermore, slowly conducting axons reached and invaded the muscle and started to communicate with the muscle fibers via axon dilatations through a threefold membrane for target selection.
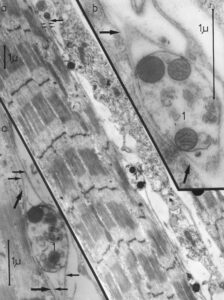 Figure 44: a. Electron microscopy of an exploring like growing axon; the axon dilatations are attached to a slow muscle fibre from a tadpole with 20mm tail length. b, c. Axon dilatation ‘1’ of ‘a’ in different sections at higher magnification. The axon dilatations show no microtubule but plenty of mitochondria. The basal membrane of the muscle fibre is marked with thick arrows, the lamina around the axon dilatations with thin arrows. A part of the poorly fixed axon is marked with small double arrows.
3.7.7 Slow muscle fiber synapse complexes in small frogs: competition of fast and slowly conducting axons for specific target selection to build up an adult innervation pattern
In pyriformis muscles of 3 young frogs 3 (tail length = 0.5mm) slow muscle fiber synapses could be found which were very similar in their structure. One of these synapses is shown in Figure 45. This synapse consisted of three parts: an extended nerve ending (“en-plaque” type), a nerve ending of ‘en-grappe’ form, and further axon dilatations. The partly shown extended nerve ending (Figure 45b; marked with ‘1’) was approximately 40μm long and had active zones. The ‘en-grappe’ nerve ending had no active zones (Figure 45a and c; marked with ‘2’) and was connected by a thin axon with a vesicle containing axon dilatation (Figure 45a; marked with ‘3’).
It is concluded that the extended synapse part with the active zones was the nerve ending of a fast-conducting axon (“en-plaque” form), whereas the synapse profiles of ‘en-grappe’ form without active zones was the nerve ending of a slowly conducting axon. The pre-terminal diameter of this slowly conducting axon was with 0.08 to 0.15μm (3 measurements) clearly thinner than the pre-terminal diameter of the fast-conducting axon at the earlier tadpole stage of development (0.15 to 0.30μm; Figure 43c).
To recognize the nerve endings of the different axons more easily of this very complex slow muscle fiber synapse with many profiles (Figure 45), a three-dimensional picture of the synapse was drawn from several serial sections (Figure 46). From the picture of the reconstructed synapse of this young frog, it can clearly be seen that this complex synapse consisted of the nerve ending of a fast-conducting axon (‘1’) and a nerve ending of a slowly conducting axon (‘2’ in connection with ‘3’).
Some axon profiles of this synapse could not be identified. Other parts were similar complex; especially as the number of vesicles containing axon dilatations was large. Within the area of the synapse, the axon dilatations contained synaptic vesicles (Figure 45a; ‘3’ and ‘4’). The axon dilatation of Figure 45d was sited approximately 100μm away from the synapse, but its axon was leading to it. It had elliptic form, but was without synaptic vesicle and no adjacent axon dilatations. Further axon dilatations were found further away from the synapse; some had close contact with the slow muscle fiber (with or a without basal membrane) and some did not.
To correlate the electrophysiological results with the corresponding morphometry, the synapse profiles of fast and slowly conducting axons of Figure 46 were inserted into Figure 33 and 34 of intracellularly recorded action potentials and endplate potentials.
The micro-anatomy (morphometry) and the by electrophysiology obtained function of the 4-cell communication between the synapses of slowly and fast conducting axons and slow and twitch muscle fibers allows an estimation of the distances of cell communication through neurotrophins, which will be done in the Discussion below. And in turn it will be discussed, which treatment has the best chance for repair in spinal muscular atrophy.
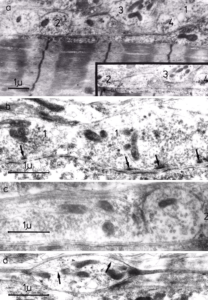 Figure 45: Electron microscopy (EM) of a slow muscle fibre with synapses of a fast (marked with ‘1’) and a slowly conducting axon, of 0.09μm diameter, marked with ‘2-4’; pyriformis muscle of a frog at the end of the metamorphosis from the tadpole to the small frog (tail length 0.5mm). By serial sections, including the sections ‘a’ through ‘d’, a picture of a part of the slow muscle fibre with the two synapses could be drawn (‘e’, ‘f’; Figure 46). a. Filaments of the slow muscle fiber show no M-line. Endplates of the fast and slowly conducting axons are strongly intermingled; both have contacts with the slow muscle fibre membrane. b. Nerve ending only from the fast axon; active zones are marked with arrows; no synaptic folding opposite to the active zones. c. Synapse profile of the slowly conducting axon; no active zones and no synaptic folding. d. Slowly conducting axon enlargement with marked microtubules; axon diameter = 0.08μm.
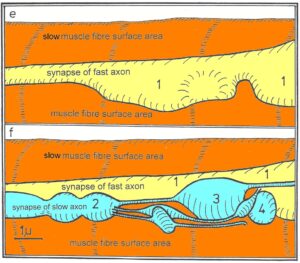 Figure 46: Three-dimensional reconstruction of the synapses of the fast and slowly conducting axons attached to the slow muscle fiber; obtained from EM serial sections, including the ones from Figure 45a-d; in ‘e’ only the synapse of the fast axon is shown; in ‘f’ the synapses of both the slowly and the fast-conducting axons are shown.
4 Discussion
4.1 Distances of communication between motor axon endings and muscle fibers
With respect to axon guidance, stem cell therapy and neurotrophin application for repair it is of interest to measure or estimate the distance of communication between cells. Based on communication distances one can estimate then the distances of action of target derived factors influencing the growth and retraction of axons during the building of innervation patterns. Attractive and repulsive factors between competing neurons for target innervation will contribute to the generation of specific innervation patterns. Geographical landscapes of diffusing growth and inhibiting factors should be simulated in realistic culture experiments and in administered exogenous stem cell therapies in which stem/progenitor cells are applied and a homing of nerve and other cells (integration of exogenously applied cells into existing neuronal networks) is intended. For generating a specific innervation pattern the internal state of the neurons is also involved. Substances have to be transported in microtubules retrogradely to the nucleus in the soma for gene expression change and there in the soma produced substances have to be transported actively antegradely in microtubules down to the nerve ending for axon growing, synapse formation, and functioning.
The communication distance between the nerve endings of the fast (Figure 45b) and slowly conducting axons (Figure 45c) with the slow muscle fiber was approximately 0.1μm; the motor endplates formed a threefold membrane. The distance of action between the for the target (slow muscle fiber) competing slowly and fast conducting axons of the two motoneuron populations was less than 0.1μm, because there is no external membrane between the two axons endings (Figures 45a and 46f). The communication distances between nerve and muscle cells are extremely short for this contact attraction and repulsion.
4.2 Early phase of innervation of the pyriformis muscle
The electrophysiological measurements demonstrate that during metamorphosis of the frog it were the fast-conducting axons of large motoneurons that established neuromuscular transmission first non-selectively with both twitch (in some similarity to FF-type (white) muscle fibers in human) and slow muscle fibers (in some similarity to S-type (red) muscle fibers in human) (Figure 34A) as occurs during nerve regeneration [54]. Both muscle fiber types responded with an action potential (AP) to direct (electrical) stimulation (Figure 33A, B) and had fast (twitch) contracture properties (Figure 37A for slow fibers). At tail lengths of approximately 18mm twitch muscle fibers became doubly innervated (Figure 36B) at a time when the slow muscle fibers became innervated by the fast-conducting axons (Figure 36A). The fast-conducting axons, therefore, still seemed to have a preference to innervate the twitch muscle fibers. The type of muscle fiber was identified by the electrical time course upon hyperpolarizing current pulses.
4.3 Neural control without neuromuscular transmission
At a later period of development, slow muscle fibers developed a maintained contracture (Figures 35B, 37B) and began to lose the AP mechanism (Figure 35A) before the (synaptic) innervation changed from fast to slowly conducting axons. Therefore, the neural control of contracture and AP mechanism of slowly conducting axons exerted onto slow muscle fibers was independent of muscle activity and neuromuscular transmission, because during metamorphosis the slow muscle fibers were mostly innervated by fast conducting axons. This finding is in full agreement with the neural control of contracture during re-innervation, which is also independent of muscle activity [57].
The rate of reduction of the AP amplitude was in the range of 40mV per day at 18°C. The rate of development of the AP amplitude after denervation is also approximately 40mV per day at 18°C in frog slow muscle fibers [82]. Thus, the rate of reduction of the AP amplitude, when the slow muscle fibers is getting under neural control by the slowly conducting axons, and the rate of development of the action potential (AP) amplitude, when their neural control is lost, are similar. This similarity may be accidental or may have his basis in the similarity of speeds for in- and ex-corporation or unblocking and blocking of Na-channels in the slow muscle fiber membrane. The acetylcholine sensitivity of muscle fiber membranes is also under neural control [95]. But there are no data available to compare the speed of spread of acetylcholine sensitivity with that of restriction.
4.4 Localized changes of membrane properties
In slow muscle fibers of tadpoles with long tails, the endplate potential did not trigger the AP (Figure 33Bc, Cc). This can be understood if it is assumed that in that developmental stage the AP mechanism is only present in certain areas of the slow muscle fiber membrane and the endplate potential is not large enough in these regions to reach the threshold. In support of this view, it was found that in slow fibers of adult frogs in which the AP mechanism has been incorporated at localized areas by partial denervation, the endplate potential generally failed to trigger an AP (Figures 38C, 39) [79, 80].
4.5 Competition of 2 types of motoneurons for the innervation of 2 kinds of target cells
At a later period of development (tail lengths less than 6mm) the slow muscle fibers became fully innervated by slowly conducting axons of small motoneurons (Figures 36A, 34B); the small motoneurons were therefore successful in fully taking neural control over. The fast-conducting axons of large motoneurons lost this competition against the slowly conducting axons of small motoneurons even though they had already established successfully working synapses on the slow muscle fibers.
At the developmental stage, when the slowly conducting axons took full control of slow muscle fiber, the twitch muscle fibers showed a transient reduction in the percentage of double innervation (Figure 36B). This observation indicates a communication of the later arriving slowly conducting axons with the twitch muscle fibers and a competition with the fast-conducting axons for twitch muscle fiber innervation change. But the slowly conducting axons lost that competition and could not replace the extended motor endplate of fast conducting axons on twitch muscle fibers by their ‘en-grappe’ type synapse. Therefore, growth and guidance are insufficient to explain fully the generation of this specific innervation pattern. The potentiation of some connections and the inhibition of others most likely include the changing responsiveness to target-derived grows factors over time and their reversibility [96].
4.6 Four-cell communication
It was shown that the innervation pattern is not simply formed by the growing of axons of one kind of motoneurons. When the axons of the second motoneuron population were reaching the target cells, the innervation pattern changed completely and the formation of the innervation pattern was not a simple competition; it depended on the inner state of 4 cells, their gene expression, and their communication via attractive and repulsive substances or molecules and receptor types. Since attraction and repulsion was exerted simultaneously among these four cells, the responsiveness of growth factors may change from attraction to repulsion (and vice versa) by additional factors. Changing electromagnetic fields probably also modulated growth, guidance, and innervation pattern.
If axons of a third population of motoneurons would have appeared at the target area and searched for their targets (as it may be the case during the generation of a neuromuscular innervation pattern in human muscles (3 types of muscle fibers are innervated by 3 kinds of motoneurons; Figure 5)), the communication between the different cells would probably have been even more complicated.
4.7 Distance of action of growth and inhibiting factors in frog
The question is now how is this 4-cell communication taking place to build up a specific innervation pattern during development and what can we learn from it for the repair of the human CNS following injury or degeneration. By knowing the functions of these 4 cells during this period of development, the simultaneous performed morphology will give us further insight into the occurring structural changes.
An important question is, with respect to repair, how close does the slowly conducting axons have to be to the muscle fiber to take control over and can the axons exert action over longer distances.
From the partial denervation experiments of above, it is known that slow muscle fibers respond with an endplate potential to nerve stimulation, which sometimes triggers an action potential (AP) [79, 80] (Figures 38C, 39). This means one can have denervation and innervation properties in the same cell (muscle fiber) and these properties are localized. The endplate potential is electronically (passively) conducted from the innervated muscle fiber part to the denervated one and is generating there an AP or not [80]. From regeneration experiments it is known that transiently the slow muscle fiber in rana temporaria can simultaneously be innervated by slow and fast conducting axons [54]. The gene expressions can, therefore, probably be different in the nuclei of the corresponding muscle fiber parts. But on the long term one motoneuron type takes full control over its (own) corresponding muscle cell. These findings already indicate that the slowly conducting axons have to be quite close to the slow muscle fiber to exert their neural control and that there may be even communication among the nuclei in the target muscle cell.
The morphology made here, in combination with the electrophysiology (measuring function), offers more exact data on the distance of action of growth and inhibiting factors.
During development, when axons make initial contacts with muscle cells, the muscle fiber membrane becomes refractory to further synapse formation in the surrounding of that synapse [97]. In present experiments when the slowly conducting axons reached the pyriformis muscle, they probably grew along the different muscle fibers (contact attraction), communicated with them (in similarity to the axon in Figure 44), tried to exert neural control, and searched for membrane areas of muscle fibers to build functional synapses. For communication, the axons may have formed dilatation and communicated with the muscle fiber by building trilaminar membranes like in Figure 44, where an exploring like axon with dilatations can be seen. For building a synapse with full neuromuscular transmission on slow muscle fibers, the slowly conducting axons had in the majority of cases to build the synapse at the same place where the synapse of the fast-conducting axon was sited and competed with it for the target muscle cell. For the cooperative interplay of the slowly conducting axon with the slow muscle fiber, a trilaminar membrane structure seems to be built of 0.1μm thickness. For the competitive interplay of the slowly conducting axon with the synapse of the fast-conducting axon, no basal membrane was built. The contact distance was less than 0.1μm (Figures 43-45). In conclusion, in this in vivo experiment the distance of effective action of factors for attraction and repulsion was in the range of 0.1μm.
4.8 Culture experiments (in vitro) cannot simulate in vivo experiments
In xenopus culture experiments, a distance of action of growth factors of 100μm from the center of the growth cone was used [96]. Such distance is 1000 times longer than those obtained from the in vivo experiments (rana temporaria) of this article. Obviously, the culture experiments for demonstrating nerve growth regulation by attractive and repulsive factors were with respect to the distance of action far away from these frog measurements and probably very far away from the human reality for the regeneration of the human spinal cord (see below).
4.9 Strong similarity between development and repair in frog, but not in human
It was shown here that in the frog, during a small period, the development of the nervous system was similar to the repair following nerve injury, even though the repair is never complete. Regenerating axons of the two types of motoneurons recapitulated developmental guidance for the specific innervation pattern of twitch and slow muscle fibers in the pyriformis muscle. Below it will be shown that following cervical spinal cord injury in humans, the repair cannot recapitulate the development spontaneously.
CNS development and neuronal network generation have shared many similarities throughout evolution. But after the intricate process of development is completed, the CNS response to injury diverges widely among different species. Therefore, the repair strategies also have to be different for different species. Following peripheral nerve injury in frog, the repair occurs mainly spontaneously. If the sciatic nerve is cut and the proximal end put in direction of the head, many axons grow through the whole of the frog body to find its corresponding muscle. In human the power of regenerating fibers is much smaller. Proximal and distal nerve ends have to be adapted for possible regeneration. The mismatch [98] of nerve fibers at the nerve injury side (growing along wrongly chosen ‘Bügners bands’) has to be compensated for by a reorganization in the CNS, namely by learning.
Several fish species retain the ability to regenerate transacted spinal cords in the adulthood, whereas human patients with spinal cord injury remain permanently paralyzed unless proper learning therapy is administered. Since such movement-based learning therapy needs to be intensive (four hours training per day) and has to be administered for a few years, the repair strategies have to be understood and optimized.
Since many experiments cannot be performed in human, animal experiments have to be performed and these data have to be translated into human reality as much as possible. Since the human nervous system is outstanding among different species with respect to learning and higher mental functions, we can expect tremendous complexity and variability in the human CNS.
4.10 Establishment of innervation patterns
During development, a surplus of axons initially reaches their targets. In our case, the fast-conducting axons grew into the pyriformis muscle and innervated slow and twitch muscle fibers. Many preliminary synapses form only to retract after; Figure 43a probably shows a retraction bulb. Winners of this game are determined by competition for limited target-derived growth factors. Motoneurons with fast conducting axons that lack victorious nerve terminals undergo apoptosis. Degenerating axons were found in the nerve branch to the pyriformis muscle.
With further development (the developmental period considered here), the slowly conducting axons of the second population of motoneurons reached the muscle and competed among their own motoneuron population for synapse formation and competed with the established synapses (motor endplates) of the other type of motoneurons, with fast conducting axons, for innervation change. Losers of this 4-cell competition will undergo apoptosis or will reduce the number of muscle fibers innervated by one motoneuron (reduction of motor unit size). This 4-cell communication will depend on the intrinsic state of the two types of motoneurons and the intrinsic states of the slow and twitch muscle fibers (or parts of it) and activity-dependent plasticity. As Figures 43 to 45 show, the communication distance between different synaptic profiles for attraction and repulsion among these 4 cells is in the range of 0.1μm.
Already the establishment of the innervation pattern of the pyriformis muscle with twitch and slow muscle fibers shows high complexity. One can expect a tremendous complexity for the generation of the neuronal networks in the human CNS. It will be difficult to recapitulate for repair the precise growth, guidance and flexibility of the developing CNS.
4.11 Reduction of double innervation
Double innervation of twitch muscle fibers occurred more often in the considered tadpole stage of development than in the later frog stage. Such transient over-innervation has also been observed during the innervation of other muscles [97, 99, 100]. In the phase of reduction of double innervation, no safe signs for degeneration were found; the reduction of double innervation (pruning of innervation pattern) points more towards a retraction of nerve endings than a degeneration [100, 54].
Following injury, additionally degenerating nerve endings and synapses have to be resolved. The repair of an innervation pattern may therefore be more difficult than establishing an innervation pattern during development; recapitulating the development, if possible, is not sufficient for repair.
Understanding details of the building of an innervation pattern (of motoneurons) is not a theoretical game. Here an example. Following incomplete spinal cord injury, a human patient needs at least 50% of the motoneurons for innervating a muscle to generate sufficient muscle power, because the motor unit size can approximately only be increased by 50% (by sprouting). A rat can increase the motor unit size by a factor of 10. That means, frankly speaking, rats can re-learn walking only with a few spared motoneurons with poor coordination; human patients, however, cannot. Animal repair experiments alone have only few consequences for the treatment of humans.
4.12 Principles of axon guidance during development
The features of CNS neuronal network organization and the communication with the environment are determined to a large extent by the intricate network of connections between nerve cells. In adult humans, each of over a trillion neurons makes connections with, on average, over a thousand target cells. How can this intricate neuronal network be repaired, following an injury or degeneration, to generate the complexity of patterns again with the necessary precision, reliability, variability and stability? Since there is some similarity between development and repair, it is of interest to study the development and the repair of the nervous system, in animals and humans, to get further ideas how to repair the human CNS.
Neuronal connections form during embryonic development when each differentiating neuron sends out an axon, tipped at its leading end by the growth cone, which migrates through the embryonic environment to its synaptic targets. The axons extend to the vicinity of their appropriate target regions in a highly stereotyped and directed manner, making very few errors of navigation. They do so by detecting molecular guidance cues presented by cells in the environment. The cellular interactions between growth cones and their surroundings that direct the path are the coordinated action of multiple guidance forces that are mediated by mechanically and evolutionary conserved ligand-receptor systems.
The precise pattern of neuronal connections during development appears to involve the sequential operation of two broad sets of mechanisms: those that require activity in neurons (activity-dependent) and those that do not (activity-independent). The events of growth cone guidance and target recognition may not only be activity-independent. When axons extend along the surface of active cells (along other axons or muscle cells), the guidance may be influenced by the natural activity of the successfully established cells. Axons appear to be guided through the combined operation of four guidance mechanisms, namely short- (contact attraction) and long-range attraction (chemo attraction), and short- and long-range repulsion, and that the outcome of any particular guidance decision appears to reflect the balance of attraction and repulsion at the decision point. These mechanisms act simultaneously and in a coordinated manner.
The complex task of reaching a distant target is reduced to the simpler task of navigating through individual segments and choice points. The axon growth appears to be characterized by at least two types of cellular behaviors: simple linear growth along “highways” and punctuated by more complex decision-making behaviors at intermediate targets (choice points), as axons switch from one highway to another.
Further, the wiring of the nervous system occurs in a stepwise manner. The first axons that develop navigate through an axon-free environment when the embryo is still relatively small, but most axons face an expanded environment crisscrossed by a scaffold of earlier projecting axons. Many later developing axons travel along pre-existing axon tracts (or fascicles) for at least some of their trajectory, switching from one fascicle to another at specific choice points. This “selective fasciculation” strategy simplifies the assembly of large nervous systems like that of human, in which axons extend to their targets in successive waves over a period of several months.
Several guidance molecules are bi-functional – attractive to some axons and repulsive to others. Such responses are presumable dependent on the receptors expressed by the growth cones. The netrins appear to function as both long-range chemo attractants and chemo repellents for distinct classes of axons. A precise spatial distribution of netrins is important for correct directional growth in vivo. Target recognition involves selection of target region, topographic location, and discrete termination site. The secreted protein Beat, made by the motoneuron itself, might function to selectively decrease the attractiveness of some axons to others.
For the establishment of a certain pattern there are three models. The first involves the recognition of positional information. The axon has a unique label that is complementary to another unique label on its appropriate target cell. Both because of the implausible large number of labels that would be required and because this model does not provide a mechanism for each axon to find its target, except by wandering aimlessly around, this model is not so likely, even though after cutting the sciatic nerve in the frog the growing axons do wander around in nearly the whole body of the frog. The positional information might instead be encoded in the form of gradients of signaling molecules along both the anterior-posterior (AP) and dorso-ventral (DV) axes of the target, and that these gradients could be detected by complementary gradients of receptors on the axon. Positional information could thus be specified with a small number of molecules, and all axons could read positional information. In principle, topographic projections could be directed by just one ligand gradient and one receptor gradient (along each of the AP and DV axes). This mechanism requires, however, that each axon seeks out a specific concentration of ligand (a “set point”, determined by the level of receptor expression) and migrates down-gradient at higher concentrations and up-gradient at lower concentrations to reach the set point. In this set-point model, the ligand acts sometimes as an attractant for the axon and sometimes as a repellent. An alternative class of models makes use of the antagonistic effects of two ligand gradients (along each axis). For example, an axon that is exposed only to an attractant gradient along a particular axis will tend to migrate all the way up the gradient, but if it is simultaneously exposed to a repellent gradient that starts shallow but becomes steep, it will migrate to that point along the axis where the repulsion precisely balances out the attraction [101].
4.13 Axon guidance and specific neuromuscular recognition in the frog experiments
The four guidance mechanisms (short- and long-range attraction and repulsion) seem to operate in all types of decisions – linear growth, sharp turns, axon fasciculation and de-fasciculation, and target invasion and selection. The present experiments to study frog development were started when the fast conducting (and fast growing) axons had reached and already invaded the target muscle (pyriformis muscle) and had innervated the twitch and slow muscle fibers mainly non-selectively; a slight preference was given by the fast-conducting axons to (“their own”) twitch muscle fibers. The slowly growing (and slowly conducting) axons faced a different environment for target invasion and target selection because all muscle fibers were already innervated (“engaged”). First, they were probably attracted by the slow muscle fibers (long-range attraction) and especially to the muscle fiber surface below and around the endplate of the fast-conducting axons. The partial changes of slow muscle fiber properties (see above) before electrical contact was made, support the long-range attraction. But by short-range (contact) attraction and repulsion (including gene expression changes) they “pushed off” the motor endplates of the fast conduction axons and established their own “en grappe” type motor endplate. The axon branch of the fast-conducting axon retracted. The slowly conducting axon and the slow muscle fiber formed a trilaminar membrane structure (as motor endplates have) (Figure 45) for contact attraction. But between the nerve endings of the slowly and fast conducting axons there was no basement membrane (Figure 45); the contact was closer. If there was repulsion between the two motoneurons for specific target selection, then the contact distance for repulsion was shorter. The distance of contact attraction and repulsion was therefore 0.1μm or shorter.
As the transient disturbance of the innervation of twitch muscle fibers by fast conducting axons indicates, the slowly conducting axon also tried unsuccessfully to replace the extended motor endplates on twitch muscle fibers (“en-plaque”) by their “en grappe” type motor endplate. The inner state of the two kinds of muscle fibers and the two kinds of motoneurons was most likely different, so that finally (in the adult frog) the fast-conducting axons innervate the twitch muscle fibers and the slowly conducting axons the slow muscle fibers.
That the two kinds of axons had a unique label that were complementary to other unique labels on its appropriate muscle fiber types is unlikely, since after partial denervation of slow muscle fibers (in those fibers which are innervated by slowly conducting axons), the membrane properties changed only in the denervated parts of the muscle fiber. More likely is that the gene expression changed in the muscle cells according to molecules secreted from the growth cones of the two kinds of axons. This view is supported again by the partial denervation experiments of slow muscle fibers. Muscle fibers have several nuclei (controlling parts of the muscle fibers), which are partly under control of the innervating axon.
4.14 Modulation of guidance molecules and receptors by electromagnetic fields generated by action potentials
Netrins, semaphorins, and neurotrophins may have been involved in this highly specific neuromuscular selection process. The short distances of contact attraction and repulsion of 0.1μm raises the possibility that electromagnetic fields, changing dynamically in space and time, contributed to the generation of the specific neuromuscular innervation pattern.
It has been reported that direct-current electric fields are required for normal development, dramatically influence the rate and direction of nerve grows in vitro, and promote nerve regeneration in vivo [102]. Electric fields may work as an extracellular guidance cue. There are cell-specific responses at a given strength of electric fields. Mammalian dendrites are attracted to cathodes, whereas mammalian axons are not [103]. But the information transported in dendrites is different to that in axons. In dendrites the depolarization is transported electrotonically (passively) from the sub-synaptic membrane to the axon hillock, whereas in axons the depolarization (the action potential) is actively conducted from the axon hillock to the endplate. Similarly, in adult slow muscle fibers the depolarization is conducted electronically and in twitch muscle fibers actively by action potentials. It could therefore be that slowly changing electric fields contribute to the guidance of dendritic growth cones and fast changing electric fields (electromagnetic fields) to the guidance of axons.
The contribution of electromagnetic fields to the guidance of growth cones could directly and/or indirectly modulate guidance molecules and/or receptors. The electromagnetic fields may also have affected bi-functional properties of guidance molecules, namely a change from attraction to repulsion or vice versa. Expression changes of guidance molecules by the electrical activity of naturally active nerve fibers could explain why the growing or regenerating fibers extend along active axons. Activity-dependent repair needs probably not only naturally activated nerve cells but at least some kind of scaffold for the extension of nerve fibers and the homing of adult-born cells (see below).
4.15 Factors promoting regeneration
Growing axons seem to need mechanical support. In Figure 44 it is the muscle fiber. In the CNS, the axons, dendrites and neurons may grow or migrate along processes formed by astrocytes that have de-differentiated into radial glia or other neurons.
In incomplete spinal cord injury, spinal muscular atrophy or brain injury, the surviving neurons (especially when activated) release signals that promote growing of axons and dendrites and the engraftment of replacement neurons. The short-range signals have a distance of action of 0.1μm. This short distance of cell communication is conductive for a fast diffusion of attractive and repellent neurotrophins and may give rise to sufficient strengths of electromagnetic fields, generated by APs conducted along spared axons, to attract or repel neurites or change molecule expression.
Emulating the geographically precise endogenous signaling cues during development, spared nerve fibers and neurons following injury have to be triggered to re-express endogenous neurotrophins or electromagnetic fields at appropriate levels and locations to be conductive for repair.
Physiologic ongoing pre- and postsynaptic activity in the injured area plays an important role in guiding the axons and dendrites that extend from surviving adult-born neurons. To generate physiologic synaptic nerve fiber activity with their coordinated timing, physiologic and integrative movement (and other) patterns have to be trained with the patients, such as walking, jumping, and exercising on special devices (Figure 47).
Whereas in animal repair research it is tried to re-express developmental guidance cues to guide regenerating axons and dendrites and substitute stem/progenitor cells – in human repair research, the learning is used for functional CNS reorganization and the stimulation of endogenous stem cell reserves to partly replace lost tissue. Whether endogenous stem cells can partly replace adult neurons outside the hippocampal dentate gyrus and olfactory bulb is unclear. However, as the human example of the partial repair of the human spinal cord of below shows, some neurons can be built anew in the human CNS and integrated in the spinal cord. Probably also in spinal muscular atrophy new neurons can be built. But how many neurons can be built anew in a certain time in comparison to how many are lost. This finding is in accordance with the identification of radial glia as a multi-potent progenitor cell type that gives rise to both neurons and glia in the sub-ventricular zone and other regions of the CNS, including the spinal cord.

Figure 47: 17-year-old female patient (Kadri) who suffered a severe cervical spinal cord injury in a car accident. No motor functions remained below the injury level of C5/6, but the patient had impaired feelings. To generate physiologic synaptic nerve fiber activity with their coordinated timing, physiologic and integrative movement patterns were trained with the patients, such as walking and running (A), jumping (B), and exercising on special devices (C, D). Especially for walking and running (A) support was given.
Chapter 3
Translational Medicine: Neural Network Repair in Spinal Cord Injury and Spinal Muscular Atrophy by Using Frog Muscle Innervation Changes and Human Neurophysiology
Abstract
The translation of animal data to human data (medicine) is difficult because reliable human data are scarce, the infrastructure for research is mainly missing and there is no real interest to improve medicine in the field of nervous system repair. Most close to the degeneration of neurons in spinal muscular atrophy is the spinal cord injury. In spinal cord injury, there is a damage of spinal tracts and loss of neural spinal cord matter, including the motoneurons. The patient Nefeli of Figure 1A-D had an injury at the level of Th10/11. For her spinal cord repair, mainly a regeneration of spinal tracts was needed, because not much spinal matter was lost of the intrinsic spinal cord networks since it was a thoracic injury. The patient Kadri (Figure 47) suffered an injury at the cervical C5/6 levels were the intumescentia cervicalis is sited (Figure 18A). She lost a lot of spinal matter, including the motoneurons. When Nefeli got some toe functions back, it was mainly through regeneration of tract fibers whereas when Kadri got some finger function back, it was mainly due to neural network repair including the building of new motoneurons. The neural repair analysis will therefore concentrate on the spinal cord repair of Kadri, because it may be more similar to spinal muscular atrophy repair. Probably a spinal cord repair in spinal muscular atrophy is easier to achieve than in spinal cord injury because the loss of neurons is more distributed so that the distance problem for neurogenesis is advantageous. The fundamental problem for repair in spinal muscular atrophy is whether with the defect of the SMN1 gene also the repair genes are defected or not. Only qualified treatment over more than three years will bring clarity.
The distance of attraction and repulsion for generating the specific neuromuscular innervation pattern in the frog will be compared with the functional anatomy-based analysis of regeneration and building of new motoneurons in cervical spinal cord injury to understand the induction of index finger function upon coordination dynamics therapy (CDT). It is likely that endogenous stem cell reserves were activated through CDT and the migration of stem/progenitor cells was guided to the appropriate target site in the spinal cord and stimulated to proliferate into motoneurons and other cells and to be integrated into the spared neural networks. Supported treadmill walking, jumping on springboard, and exercising on a special CDT device (Figure 47) were mainly administered for the limited repair of the intrinsic neural networks of the human spinal cord.
1 Case report of the spinal cord injury patient Kadri
The 17-year-old female Kadri suffered a severe cervical spinal cord injury in a car accident. No motor functions remained below the injury level of C5/6, but the patient had impaired feelings. From the magnetic resonance images (Figure 48), the Author estimated that approximately 5% of the spinal cord cross-sectional area was spared. Two months after the accident CDT was started. Upon 2.5 years of CDT the sensitivity improved and some motor functions returned below the injury level, indicating that some repair of the spinal cord had occurred. The connectivity over the injury site, quantified by magnetic resonance imaging (MRI) may have increased to 8%. In previous publications the Author reported about the recovery of some motor functions due to the limited regeneration of the spinal cord and the cure of urinary bladder functions, breathing, and cardiovascular performance [7, 8, 12, 104].
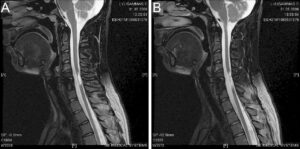
Figure 48: Magnetic resonance images of the severe spinal cord injury at C5/6 levels of the 20-year-old female patient Kadri after 3 years of optimal coordination dynamics therapy. Both sagittal T2-weighted images seem to show connection between the rostral and caudal spinal cord. The injury is quite extended in longitudinal direction which makes a repair more difficult.
Here, the repair of circuitry at the injury site will be analyzed to show that the strategies for understanding repair mechanisms are quite different in animal and human and that simultaneous research in animals and humans is needed. The repair of propriospinal circuitry is of special interest in cervical C5/6 levels, since there the motoneurons are destroyed, importantly innervating lower arm, hand, and finger functions. Further, to identify the repair mechanisms in the human spinal cord by the novel CDT, it is of high importance to further improve the efficiency of treatment. The repair of finger (and urinary bladder) functions has not been tackled by animal and biological research so far.
1.1 Recovery and repair of sensory function in human
Through 3 years of CDT, motor functions re-appeared in the rostral-caudal direction, indicating a limited regeneration of the human spinal cord in the patient Kadri. The recovery of sensory functions started in the caudal-rostral direction in the spinal shock phase, which lasted approximately 3 to 4 weeks. Two weeks after the accident, the patient felt first the Achilles tendons followed by feelings in the toes. After the termination of spinal shock, the re-occurrence of sensitivity was rather complicated with respect to topography, because of spared spot-wise distribution and re-occurrence. The last location in which the patient got sensitivity back was the abdomen, at a time when the urinary bladder function was cured, two years after the accident [8].
The first sensation the patient experienced after the spinal shock was pressure and then touch. Later on, pain and temperature sensation re-occurred. The later re-appearance of pain and temperature feeling can be understood on the basis of functional anatomy. In Figure 49B the spared white matter is cross-hatched pictured. The distribution of spared white matter is taken from the magnetic resonance image (MRI) of Figure 48. The later re-appearance of pain and temperature may mean that new sensory fibers were crossing the injury site adjacent to the spared sensory fibers, indicated in Figure 49B by open arrows. Looking at the cross-section of the human spinal cord (Figure 49A), it seems that the tractus spinothalamicus anterior, carrying pressure and touch information, was mainly spared by the injury. With regeneration, parts of the tractus spinothalamicus lateralis, carrying pain and temperature information, was repaired. Growing of nerve fibers and possibly homing of adult born cells were probably attracted and guided by the natural activity in the spared fibers crossing the injury site. The funiculus posterior also seemed to have improved in its functioning. The spared white matter at the dorsal part of the cord cannot be seen well in the T2-weighted MR images in Figure 48. However, on T1-weighted images (not shown) some spared connections can be seen between the proximal and distal spinal cord parts.
The growing of nerve fibers across the injury site adjacent to the activated fibers is pictured in Figure 49D by short arrows pointing into the white cavity adjacent to the longitudinal long arrow in and beside the spared tract fibers. It seems that at the limit activated spared and newly regenerated fibers attracted new fiber growth. Target-derived growth factors seemed to have been released from the over-activated fibers in the rostral and caudal direction through exercising for repair adapted movement patterns at the limit [105]. Based on the re-occurrence of the reported functions, the mechanism of sensory and motor repair can partly be understood.
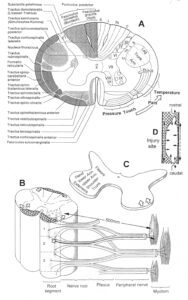 Figure 49: Schematic drawings of the human spinal cord at the injury site. A. Spinal cord cross-section with fibre tracts and grey matter. Note the regaining of sensitivity upon CDT from pressure to touch, pain, and temperature is indicated by an open arrow. B. Spinal cord section with suggested spared matter (cross-hatched). Open arrows indicate direction of structural repair. The axonal outgrow of a newly build motoneuron is indicated by a bended and long arrow. C. Motoneuron sites for serving different functions are indicated. Note the extensor motoneuron cell bodies are sited more adjacent to the spared spinal cord matter then the flexors and should be generated first in this case, indicated by open arrows. D. Injury site of the patient. Small short arrows indicate direction of structural activity-dependent repair. The structural repair starts from the activated spared matter into the cavity. The ascending and descending tract activity is indicated by long arrows, and the tract and network activity rostral and caudal to the injury site is indicated by bended arrows.
1.2 Partial repair of index finger function
Upon 3.5 years of optimal CDT a completely different mechanism of repair became visible: the index fingers started to function minimally. This was most likely achieved by the building of new motoneurons. The only hand functions the patient had regained within the first year following the accident (mainly spontaneous recovery) were the dorsal flexion and a weak plantar flexion. The dorsal flexion was achieved by the extensor digitorum muscle, innervated by the nervus radialis (ramus profundus) and having its motoneuron cell bodies in the spinal segments C6-C8, which is fitting with the spinal cord injury level at C5/6 levels. The propriospinal premotor network for activating the extensor digitorum is sited just above the injury cavity (Figure 49D) in the grey matter (butterfly). The weak plantar flexion is probably caused by the flexor digitorum superficialis, innervated by the median nerve, having its motoneuron cell bodies in the spinal segments C7-Th1. The very weak muscle power is reasonable, since most motoneurons will have been destroyed by the injury.
But after 3.5 years of therapy, the patient could rather suddenly repeatedly lift the index finger first on the right and shortly later also on the left side. No other fingers could be moved separately. The dorsal flexion of the index finger was probably activated by the musculus extensor indicis, innervated by the radial nerve, ramus profundus, from the spinal segments C8-Th1. But these are the segments, which were destroyed and are now forming the cord cavity (Figures 48, 49D).
Why did the extensor start to work but not another hand flexor (or the flexor digitorum superficialis got stronger), as for example the musculus digitorum profundus, innervated by the median nerve and ulna nerve from the cord segments C6-Th1? If we look at the somatotopic ordering of motoneurons in the ventral horn of the grey matter, we can see that the extensors are sited most ventrally, whereas the flexors are sited more in the direction of the dorsal horn (Figure 49C). When the patient is performing coordinated arm and leg movements on a special device, including the fingers (Figure 47D), then the tractus spinothalamicus anterior and posterior are activated alongside the cavity (Figure 49D) and the working parts of the funiculus posterior (ascending activation) and some regenerated axons, activating trunk and some leg muscles (descending direction) across the injury site.
Because the patient is holding the handle with the fingers during the coordinated arm and leg movements (Figure 47D, right hand), the extensor digitorum is also activated and sensory input is reaching the cord from the fingers and hands. Growth factors could have been secreted from the sensory fibers in the tractus spinothalamicus anterior/posterior and the premotor network of the extensor digitorum to attract stem/progenitor cells for homing (integrated functioning with the spared neuronal networks). The attraction for engraftment is indicated by open (Figure 49B, C) and small arrows (Figure 49D).
The flexors, on the other hand, are far away from supposed target-derived growth factor concentrations (Figure 49C); and further, in the middle of the spinal cord cavity there was no scaffold where growth cones and cells could get mechanical support for growing and migration. According to this reasoning, the flexors can only come much later with further building of new propriospinal circuitry. It is therefore important that the patient and the therapist understand the therapy (including functional anatomy) and that the patient is activating all by the injury spared and newly formed fibers and premotor networks circumferential to the injury site (the cavity, the cyst) (Figure 49D). This is needed in order to prepare the milieu for the integration of new cells and growing of axonal and dendritic arbors by performing all possible movements, especially the coordinated and integrative ones (according to the System Theory of Pattern Formation [8, 40, 106] and the coincidence principle [107] (Figure 10)).
The death of motoneurons in spinal muscular atrophy is probably distributed and there are no cavities. All still living motoneurons and the tract fibers can be activated by different performed movements. This means that the whole spinal cord can be activated and the distances for neurotrophin actions and building of new neurons are small. But the question remains whether such neural repair is possible because of the genetic defect. The treatment of suitable patients will bring the answer.
1.3 Is the index finger function a separated function of the extensor digitorum muscle?
The possibility exists that the repaired index finger function is due to a separation of function from the digitorum muscle. But first, the index finger started to function suddenly. Second, no other finger could perform a dorsal flexion separately. Third, since the dorsal flexion of the hand is generated by the last working motoneurons rostral to the injury site (in direction of caudal), the premotor network of the extensor digitorum will also have been damaged, and with a rather simple connectivity it may not be possible to separate single finger functions from this muscle, which is probably possible in healthy humans.
1.4 Time delay of 3.5 years to regain index finger function in the spinal cord injury patient Kadri
Why did it take 3.5 years of optimal CDT to get back some finger functions? From brachial plexus injuries it is known that functions start to re-appear 2 years after the accident. This time interval results to a regeneration speed in the PNS of less than 1mm/day (v = s/t = 500mm/700days ≈ 0.7 mm/day) for the thickest, fastest regenerating axons. To get index finger function back, new motoneurons must be built in the intumescentia cervicalis and their axons must find their way to the rootlets, may be guided by activated axons leading to the extensor digitorum. The axons probably grow along Bügner’s bands to the extensor indicis muscles and form there functional motor endplates (Figure 49B). Since the muscle fibers of the extensor indicis were most likely atrophied in the meantime, another 2 to 3 months would be needed for re-gaining full power back.
The building of new motoneurons from endogenous stem cell reserves, therefore, needed approximately 1 to 1.5 years. A further 2.5 years were needed to get function back because of the slow growing speed and the long growing distance (0.5m, Figure 49B). If some of the motoneurons innervating the index finger had survived the injury and only their axons were injured close to the soma (and the motoneurons would not have died), then axon growing times would be in the range of 2 years. If axons of pyramidal tract neurons (innervating arm, hand, or leg motoneurons) were injured, then already the time for the retrograde axonal transport along microtubules to “inform” the nucleus in the soma (in motor cortex) for gene expression change would need a few months (see below).
In the spinal cord injury patient Nefeli (Figure 1A-D), a regeneration speed of spinal cord tract fibers (Figure 30) was measured to be 1mm/day [7].
Some physicians make patients with CNS injury believe, that following exogenous stem cell therapy, they can get functions back within a few days or weeks. Such hope, generated in spinal cord victims, is not supported by the data of human repair-neurophysiology.
1.5 In spinal muscular atrophy a time delay of 3.5 years has to be expected to get motor functions back through building of new motoneurons in similarity to spinal cord injury
It is believed that motoneurons are lost in spinal muscular atrophy because of the genetic defect/mutation. For sure muscles atrophy and muscle power declines. But is the survival of the motoneurons the only problem? If interneurons, projecting from cortical cells to motoneurons (Figure 19) from the pyramidal or other tracts, would die, motoneuron cell bodies in the anterior horn could not be activated or could not reach the threshold for generating an action potential (Figure 10). Probably, the malfunctioning of the neuromuscular transmission is more complex than that just the motoneurons are lost and in turn the muscles atrophy.
Also, in human there are three different kinds of motoneurons innervating their muscle fiber type (Figure 5) and each motoneuron type is probably involved with different neurotrophins. In the frog model of above the two motoneuron types (fast and slowly conducting axons) exerted a different influence on the slow and twitch muscle fibers.
For neuromuscular repair in spinal muscular atrophy different repairs will take place at different time intervals. The repair will start by optimizing the phase and frequency coordination of CNS functioning and an optimization of the neuromuscular units in general. What repairs probably occur thereafter is not known. The human research is missing. And a further problem is, what data in medicine are really reliable? In the presented frog model, many qualified researchers contributed, including Katz and Huxley.
But with respect to spinal cord repair via the building of new motoneurons, a delay of 3.5 years has to be expected as in the case of the cervical spinal cord injury in the patient Kadri.
1.6 Very limited building of functionally successful motoneurons
In the patient Kadri, only few motoneurons were successfully built anew to functionally replace injured or destroyed ones. This is for a number of reasons. Firstly, only few motoneurons seem to be built anew following injury, which is in accordance with the measured very limited neurogenesis in human [108]. Secondly, as known from treatment of spinal cord cysts, the lost spinal matter is replaced by a cyst or cavity (mostly filled with cerebrospinal fluid), with no scaffold for growing of axons and dendrites and migration of cells. Replacement of lost neurons and regeneration and guidance of projections over the entire distance of the formally injured area (and the building of migratory scaffolds from there) seem to be only encouraged along spared and regenerated tract fibers in some similarity to the extending of axon branches along muscle fibers (Figure 44). Thirdly, there is mostly no proper guidance to the rootlet. Fourthly, there is probably mismatch [98] to find the specific Bügner’s bands (membrane surrounding after axon death), in this case, to the muscles activating the dorsal flections of the index fingers. In the patient Kadri it appeared that the dorsal flections of the index finger were not the same as in healthy persons. Fifthly, the time period of aggressive therapy was not sufficient long for the building of more motoneurons, because the patient Kadri had to go back to school. The school-brake of three years for therapy did not ruin her later career. Later on, she studied successfully international connections and law. She did not study medicine because of the limited finger functions.
1.7 Surface electromyography (EMG) of the extensor indicis and tibialis anterior muscle
To further understand the repair pattern of the spinal cord in the patient Kadri, EMG was performed from the extensor indicis (rostral to the injury site) and the tibialis anterior muscle (caudal to the injury site) (Figure 50). Single motor unit action potentials could be recorded from the extensor indicis and the tibialis anterior muscles. Even though the extensor indicis is lying below the extensor carpi ulnaris and the tibialis anterior is sited directly under the skin (Figure 50), the largest motor unit action potentials of the extensor indices had with 400μV a double as high amplitude than those of the tibialis anterior (200μV).
Physiologically, a motoneuron innervates approximately 20 muscle fibers in the extensor indicis and approximately 200 in the tibialis anterior. The single motor unit action potentials recorded from the tibialis anterior muscle should therefore be much larger than those from the extensor indicis, namely over 1000μV (Figure 7); but they were not. This un-physiologic small amplitude of the motor unit action potentials of the tibialis anterior and the earlier start of functioning of the tibialis anterior give further insight into the regeneration process taking place in the spinal cord.
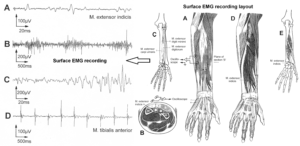
Figure 50: Right. Drawing of the lower arm muscles with positioned surface electrodes for differential EMG recording. Left. Surface EMG recordings from the extensor indicis (A, B, C) and tibialis anterior (D). Note the different calibrations and that the activity of the extensor indicis (B, C) has a higher amplitude than that of the tibialis anterior (D). The motor unit in the tibialis anterior fires at a frequency of 1.8 Hz; this frequency falls into the frequency range of oscillatory firing α3-motoneurons innervating under physiologic conditions slow (red) muscle fibres.
1.8 Indication for network and not tract fiber repair
For the volitional activation of the tibialis anterior, some regeneration of the spinal cord was necessary in the patient Kadri. Some axons had regenerated over the injury site to reconnect the distal spinal cord part. The very limited regeneration of the spinal cord was faster than the building of new motoneurons and the growing of their axons from the grey matter to the rootlets and then via the Bügner’s bands in the median nerve to re-innervate the musculus indicis (Figure 49B) to induce finger function. But why did the recordings from the tibialis anterior muscle show only small motor unit action potentials, which cannot be explained only by atrophied muscle fibers?
Human muscles have FF, FR, and S-type muscle fibers, which are innervated by α1, α2, and α3-motoneurons respectively (Figure 5). The large, fast conducting α1-motoneurons innervate the FF-type muscle fibers, show large motor unit action potentials and are integrated only in small networks. The thick tract axons from the cortical pyramid cells will preferentially innervate these α1-motoneurons to generate high muscle power quickly. The FR-type motor units generate smaller motor unit potentials than the FF-type motor units (Figure 6) and the innervating α2-motoneurons are integrated in larger networks and have specific premotor networks, generating for high activation stable oscillations. The S-type motor unit action potentials are most likely small; the innervating α3-motoneurons can be activated poly-modal and are integrated in large neural networks.
The small motor unit action potentials, recorded from the tibialis anterior indicates, therefore, that the recorded activity was mainly generated by the activated smaller α3, and α2-motoneurons, integrated in larger and more complex networks. An oscillation frequency of 1.8 Hz of a motor unit action potential in the tibialis anterior muscle (Figure 50D) supports this view that α3-motoneurons fire oscillatory in the range of 1.8Hz (Figure 58). (A change of the commitment of motoneurons, due to a partial denervation, cannot be excluded). This means that the regenerating axons over the injury site were not giving rise to a partial regeneration of the pyramidal tract, but contributed to a re-innervation of the neuronal networks caudal to the injury site. So far, after 3.5 years of optimal CDT, the repair was probably mainly achieved by network repair (and not by the repair of tracts), including the building of a few neurons, and a substantial functional reorganization for generating physiologic functioning. Further, a regeneration of the axons of the pyramid cells over the injury site down to the motoneurons of the tibialis anterior, sited in the lumbar-sacral cord segments, would probably take much more regeneration time, if possible at all, if one assumes a regeneration length of 150mm from the cervical to the lumbar-sacral spinal cord. Already the retrograde information transport in the microtubules in the axons for stimulation gene expression in the DNA of the nucleus would need a few months, if a retrograde transport velocity of 1.5mm per day is assumed and the proximal axon length would be 150mm (t = s/v = 150mm/1.5mm/day = 100days). For the repair of the spinal circuitry the distances for information transport and regeneration are much shorter (only the neurogenesis times may be long), which makes it likely that primarily networks were repaired for improved functioning.
The regeneration of the motoric complete cervical SCI (sensory incomplete) was so far achieved by the growing of some axons over the injury site (including the building of new neurons and forming and activating new pathways), combined with a substantial functional reorganization to regain physiologic functions. At this research stage of spinal cord repair in human it is unclear, whether the regeneration-associated genes have the possibility to partly restore original spinal cord structure or not. But for re-gaining finger functions, new motoneurons are needed; a network repair by growing of axon and dendrite arbores cannot or only partly substitute for lost motoneurons.
2 Physiologic distributions of factors for CNS repair
The presented details of four-cell communication during frog development and repair demonstrate how intricate the geographical landscapes of factors are, and probably have to be structured, to guide growing axons to generate physiologic innervation patterns. Distances of action in the range of 0.1μm to achieve physiologic concentrations of attractive and repulsive factors (secreted from targets and growing cells) and/or effective strength of electromagnetic fields cannot simply be simulated by adding grows factors, protection molecules or neurotrophins.
Also, the inhibition of the inhibition of regeneration [110] to enhance repair in SCI has nothing to do with the building of a physiologic environment at the injury site to be conductive for the generation of physiologic innervation patterns. Repellent neurotrophins and inhibiting pathways are necessary to generate physiologically structured innervation patterns and physiologic functioning. Mass contractions are not helpful for patients.
In the upper frog model, blocking the repellence of fast conducting axons from slow muscle fibers would probably result in the generation of chaotic patterns of multi-innervated slow and twitch muscle fibers. Missing inhibition in Parkinson patients results in tremor [39], trunk spasticity and other deficits. The blocking of inhibitions will result in mass contraction, as for example some kind of spasticity in human CNS injury.
3 Altered signaling environment following injury in comparison to development
If it would be possible to recapitulate development for repair, the milieu for repair at the starting point of recapitulation would be different to that for development. During normal neuro-development there are also variations of signaling cues, but those variations are probably small in comparison to the changes of the environment following severe injury or malformation. Also in the frog, the quality of repair to reinnervate the pyriformis muscle depends on how severe the sciatic nerve was injured. Cutting the sciatic nerve and placing it in the direction of the brain will result in a much lesser repair than following only squeezing the sciatic nerve. The repair of the CNS in lizards following disconnection of the tail from the rest of the body, when trapped by the tail in dangerous situations, is incomplete, even though the separation of the tail when caught is an innate escape mechanism.
The repair by movement-based learning (CDT) also depends on the kind of injury, the lost CNS parts, and the severances of the injury in general. Therefore, during re-learning, functional aspects of the anatomy have to be taken into consideration to adapt the therapy to the kind of injury to enhance the rate of learning. For the repair of the human nervous system, human research is needed or the animal data have to be translated first to human (as is tried here) before using them in repair treatment for human patients. Partial re-establishment of the developmental pattern of guidance molecule expressions could contribute to the regeneration of the human CNS. But the proper geographical landscape of attractive and repulsive guidance molecules or neurotrophins cannot be achieved by simply adding growth factors as is sometimes done after plastic surgery.
4 Adult neurogenesis for enhancing plasticity
Movement-based learning has been shown to induce the building of new motoneurons in the human spinal cord. It is likely that stem/progenitor cells also differentiated into other neurons and supporting cells to improve propriospinal circuitry. Adult neurogenesis is important in general because the newly built neurons are, at least temporarily, immature and probably more plastic to support learning. The immature neurons are not that much differentiated and can form more easily new connections (in a given period of time) than mature neurons. By being structurally more plastic, the new neurons are highly susceptible to changes in the environment and to different movement-based learning protocols. Since new neurons are only immature and strongly plastic in a given period of time, CDT should not be discontinued for longer periods of time. Practical experience is that with a longer break of CDT than 3 days the performance of learned movements decreases again. The site of origin of adult-generated cells in the CNS is unclear. One possibility is the sub-ventricular zone, which is the source of new olfactory bulb neurons in the monkey. Also the migration ways are unknown. However, movement-based learning enhances the rate of neurogenesis and the survival of new neurons.
It may therefore also be possible that movement-based learning (CDT) enhances the survival of adult and new-born motoneurons in spinal muscular atrophy.
5 Stem cell therapy
Since exogenously applied adult-born stem/progenitor cells are similar or the same as endogenous stem/progenitor cells, it is likely that movement-based learning therapy can control the differentiation also of added cells into different kinds of neurons and glia cells and can improve the impaired stability of integrative neural networks during functional and structural repair. Stem cell and coordination dynamics therapy of a patient with a complete spinal cord injury was not successful [111] probably because the spinal cord injury was complete (no spared tract fibers and scaffold for regeneration and homing of cells) and the CDT was not optimal before and after the stem cell therapy. But most spinal cord injuries are incomplete. In brain and brain stem injuries (especially in young children), the repair does not depend that much on spared fibers and tissue than in spinal cord injury. Unclear is whether CDT can control neurogenesis from embryonic stem cells, since repair cannot recapitulate development in humans and cannot generate the necessary environment for physiologic growing.
6 Angiogenesis
Brain and spinal cord pressure do not only damage nervous tissue directly but also indirectly via reduced blood (oxygen) supply. Blocked or destroyed blood vessels result in an infarct of parts of the CNS (brain, brain stem, spinal cord) if sufficient blood cannot be delivered through anastomosis [112]. Repair and functioning of the CNS need sufficient blood supply for the microcirculation; it needs angiogenesis. In animals, lack of exercise-induced angiogenesis is not a rate-limiting factor for neurogenesis [113]. Exercise increases hippocampal neurogenesis and improves learning. In the dentate gyrus, new cells are clustered close to blood vessels and proliferate in response to vascular growth factors. In young adult animals, exercise increases endothelial cell proliferation, vascular growth factor levels, and angiogenesis throughout the brain. In the dentate gyrus, the effects of exercise on the vasculature may also be important for enhancing neurogenesis. However, enhanced fitness in runners is probably not the main reason for improved learning. Movement performance is more indicative of recall ability than fitness of the subject. Stressful experience decreases the number of new neurons in the dentate gyrus [114], which means that the vegetative nervous system is also involved in the regulation of cell proliferation. There appears to be no simple relationship between the number of new neurons and learning [113].
In the patient Kadri with a cervical spinal cord injury (Figure 47), there was a repair of the cardio-vascular performance: the skin was no longer vulnerable and no pressure ulcers occurred. CDT is a human science-based learning therapy, which includes the powerful learning tools of improving the coordinated firing of neurons and learning transfer [40]. Fitness is a by-product of this intensive training and offers the possibility for the patients to train at their limits (range of overreaching (70)) to induce all repair mechanisms. That enhanced fitness in animals is not the main reason for learning and that there is no simple relationship between the number of new neurons and movement-based learning is supported by the human data of this report, because different learning strategies were used (partly shown in Figure 47) to induce neurogenesis and angiogenesis in the spinal cord by learning (which even cannot be simulated by animal research).
7 Link between adult neurogenesis and learning
During the past several years, evidence has accumulated suggesting a relationship between newly born cells in the hippocampus and various types of learning and memory [115]. The involvement of the hippocampus in learning and memory has long been recognized. It is usually assumed that synaptic plasticity within the hippocampal formation contributes to the acquisition and retention of memories but the exact mechanism remains unknown. It seems that the dentate gyrus of the adult hippocampus produces new neurons in substantial numbers and does so in a wide range of mammalian species, including humans [116]. Some studies have shown that learning tasks do not require the hippocampus, but which nonetheless activate or engage it, and do not change the number of new granule neurons in the dentate gyrus of the hippocampus [117].
In the case of thoracic spinal cord repair in the patient Nefeli, evidence was given that adult neurogenesis in the human spinal cord was achieved by motor learning in which the hippocampus was not directly involved. The acquisition and retention of movement patterns was so strong that it was also supported by the building of motoneurons and probably other neurons. Learning-induced structural repair can probably be achieved throughout the human CNS. The specificity (finger function) and integrativity (coordinated arm, leg, and trunk movements; Figure 47D; patient Kadri) of the performed movements combined with functional anatomy-based activation of the environment of the injury site (Figure 49) gave rise to neurogenesis and acquisition and retention of the learned movement. It seems therefore that the re-learning of the index finger function induced the building of new neurons (motoneurons) in those networks in the spinal cord which were directly required for the movement, in some similarity to the learning in the hippocampus (see above). The effect of various learning tasks on the repair of certain CNS injuries and network structures has to be further explored.
As has been shown earlier, the learning of a new pattern disturbed the organization of the CNS networks [8], but through continuous CDT, CNS instabilities could be repaired; newly learned and spared movement patterns were not destroyed. That adult neurogenesis is a vestige of development, which in adulthood has no functional significance, is extremely unlikely.
It seems that by understanding human neuronal network organization (including functional anatomy), which generates learning, memory and movements, CNS networks can be altered on volition – The spirit can rise above physis. – The limiting factor is the time.
8 Motor learning, memory and loop formation for neural repair
Long-term potentiation (LTP) has been proposed as a model for learning and memory. The sensory cortex is required for the acquisition of new motor skills. LTP can be induced in the motor cortex with stimulation of the sensory cortex or associatively with stimulation of to both sensory cortex and thalamus. It was proposed that motor learning involves the formation of loop circuits between the motor cortex and the periphery involving the sensory cortex and the thalamus [118]. Loop formation has also been measured in human; the loop formation was extracted from coordinated, natural firing patterns of α- and γ-motoneurons and secondary muscle spindle afferents [40] (see below). First, loop circuits are diffuse, but become specific by producing LTP through practice. LTP participates in the execution of learned motor skills by maintaining the efficacy of synaptic transmission in selected circuits. This short-term memory, or working memory, refers to memory formed and retained for a relatively short time, from a few minutes up to several hours. This learning in the short-term memory probably occurs when during CDT the patient is exercising at intervals (crawling or walking) of 1 to 3 minutes. During the intervals for rest, the efficacy is only reduced marginally because of the short-term memory and the patient with CNS injury has some rest for the overloaded muscles and neural networks to recover. With each further crawling, the performance improves till the patient is getting exhausted and the performance is decreasing again due to exhaustion.
The cerebral cortex (together with other brain parts) consists of multiple loop circuits and the function of the cerebral cortex depends on the interaction of these various loop circuits. Some of these circuits become progressively more specific. With the interaction of hierarchies of loop circuits, we may understand the dynamic organization of a motor behavior, in which motor learning is generated more or less by all the contributing subsystems of the CNS.
With ongoing therapy over weeks and months, the repeated usage of specific synapses results in proliferation of these synapses; the changed efficacy of synapses becomes permanent. Further structural changes can be achieved by synaptogenesis, which has been demonstrated in the mature brain. For the acquisition of novel skills (such as playing piano) or re-learning of motor patterns in patients with injury-deficient neural networks, further structural changes are needed; the establishment of new pathways by growth of terminal dendritic and axonal arborizations and building of new synapses is needed. Long-term memory may be retained indefinitely. The modification of existing damaged motor pattern requires learning through feed-back information. Repetitive activity of the motor cortex changes the excitability of not only the motor cortex, but also of the spinal cord. Motor learning is based on increased excitability of selected efferent zones by circulation of impulses in selected loop circuits [118].
If the growth and ramification of axons and dendrites, together with their myelination, and building of new synapses is not sufficient for learning a motor skill or re-learning a motor pattern in injury-deficient neural networks, then new neurons are needed. In the patient with the cervical spinal cord injury, the changed excitability of the cervical spinal cord networks was not sufficient: new motoneurons were needed and built. But those motoneurons were built first by motor learning activated spared networks.
In the frog, during metamorphosis, the change of the innervation pattern was accompanied by the movement of the hind limbs (before the forelimbs broke through the skin). When the muscles in the growing hind limbs became innervated by the fast-conducting axons, meaning that the legs became operational, the tadpole is using them, as can be seen every year if one takes tadpoles from a breeding pond to an aquarium.
Adult-generated cells may have unique properties that increase their impact in comparison to more mature neurons during learning and repair. Immature neurons may form more new connections and their axons and dendrites may grow over longer distances in a given period of time than mature neurons.
8.1 Motor behavior and motor learning are a product of all contributing subsystems
It was proposed that motor learning involves the formation of loop circuits between the motor cortex and the periphery involving the sensory cortex and the thalamus [118]. In a system theory of motor development and repair (Chapter II of [1]), sensory and motor inputs are not identified as separate entities but rather as one system having an impact on both input and output. Sensory pathways do not transmit information to the brain, where it is received, acted upon, and sent out as a motor component. Rather, sensory and motor influences work together nested within each other, simultaneously filtering, assessing input, and contributing to the output. Afferent and efferent pathways are made up of both sensory and motor components and cannot be partitioned into separate compartments [119]. This system theory of motor development (and repair) is supported by electrophysiological measurements of phase and frequency coordination among single afferent and efferent nerve fibers (Chapter III of [1]) for pattern self-organization [33, 104] (Figure 31 of [7]) and learning transfer in human [40]. When exercising on the special CDT device (Figure 47C, D) sensory and motor influences are trained together for movement-based learning and re-learning.
8.2 Formation of loop circuits in human
For low activation human motoneurons fire occasionally. For higher activation the motoneurons switch into oscillatory firing mode to fire rhythmically with impulse trains of changing length. By plotting the oscillation periods, distributions are obtained which are interpreted as neural network oscillators, which spread into the space of neural networks. The expansion is enlarging if the oscillatory firing network is increasingly activated. The distributions of the oscillation periods provide information concerning the organization of the neural networks of the spinal cord and its repair.
The shift of the corresponding distribution peaks of oscillation period distributions with increasing oscillator network activation (increasing impulse train length) suggests the existence of several rather discrete network loops of a2-oscillators (Figure 51). Such oscillator loop formation distributions are pictured on the right side of Figure 52. Interpolation of the oscillation period distributions (Figure 51 and another one) shows how the excited network loops shift with increasing excitation (Figure 52).
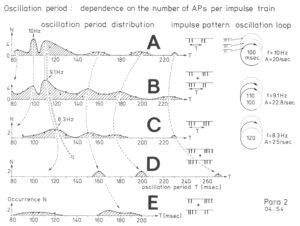
Figure 51: Distributions of oscillation periods: impulse train lengths of 2 APs (a), 2/3 APs (b), 3 APs (c), 3/4 APs (d) and 2/4 APs (e). The corresponding peaks are connected by the dashed lines. The double dashed line indicates mean shift of the distribution. A very simple loop interpretation is given for the increasing oscillation period at the right side of the Figure. Para 2; vS4.
8.3 Oscillator pathway interpretation
Figure 51 (A through E) shows the frequency distributions of the oscillation periods for increasing impulse train length of paraplegic 2. Peaks can be recognized in each distribution, and the corresponding peaks of different distributions, for different impulse train length, are indicated by dashed line arrows. With increasing impulse train length, the largest peak of the oscillation period shifts towards longer oscillation periods and, as can be calculated, the activity (A) produced by the oscillator increases (10Hz: A = 20APs/s; 9.1Hz: A = 22.8; 8.3Hz: A = 25). Considering the increased activity of the oscillator and interpreting the oscillation period as a loop spread into the space of interneurons in the spinal cord, Figure 51 would suggest that with increasing oscillator activity the oscillation loop is extended, and it probably spreads away from the motoneurons. But at the same time, the dashed lines draw near (closest in Figure 51C). This seems to indicate of some kind of contrasting. When attributing the peaks to certain interneuron pathways, Figure 51A through E show how the interneuron pathways change with the increasing activity of the oscillator. In A, the oscillator uses mainly 2 out of 6 pathways. In B, the oscillator still uses 6 pathways, but prefers the one with 110ms. In C, the pathway with 120ms is mainly used. A simplified interpretation of the oscillation loop is shown at the right side of Figure 51. The double dashed line arrow (left part of Figure 51) shows how the mean loop pathway increased. This loop pathway interpretation suggests that the oscillator can use different neural pathways and that certain pathways are preferentially used according to the activation; a kind of contrasting occurs with increased spreading. The major contrasting in these oscillator pathways occurred for 3 APs per impulse train (Figure 51C). The oscillator loop pathway interpretation suggests the spinal oscillator structure of Figure 53A, if the motoneuron is a part of the oscillators.

Figure 52: Space-time distribution of activated neuronal networks of a2-oscillators from a brain-dead human (HT5; dS3) (A) and following spinal cord lesion (Para 2; vS4) (B). The oscillation period distributions for different impulse lengths were interpolated so that the frequency of occurrence of the oscillation period be obtained in dependence on increasing network activation (the activity of an oscillator increases with the increasing impulse train length, as can easily be calculated). The frequency of the occurrence for a medium impulse train length was used to draw schematically the network loops of oscillators in brain-death and in paraplegia (right side of the Figure). The network loops give the impression of probability distributions of excitation in neuronal networks. Note that in paraplegia, the activated network loop is much more space-time distributed, as if lateral field inhibition were missing.
8.4 Hypothetical structures of premotor spinal oscillators
It is assumed as a simplified working hypothesis that these spinal oscillators are organized by excitatory reverberatory loops of interconnected interneurons in the form of synfire chains [120] to which inhibitory interneurons essentially contribute because their inhibition time, 30ms (rat) and 150ms (cat) [121], falls within the range of the 30ms building time block of the oscillation period and the oscillation period itself (160ms) (Figure 53). Premotor a1-oscillators show little rhythmicity generated by small networks, whereas a3-oscillators show much rhythmicity generated by a larger local sub-network [37]. The oscillator loops consisting of chains of neurons (Figure 53) are therefore only schematized network loops. This network loop seems to be rather continuous for a3-oscillators, whereas the a2-oscillator loop may show rather discrete sub-loops (see below) accounting for the firing with different impulse trains length (Figure 53) and therefore different loop periods according to T = 70ms + 30ms · nAP. (nAP; number of impulses per impulse train). The network loop of an a1-oscillator is more in the direction of a single neuron chain loop. The measurements give no direct information about the number of neurons contributing substantially to the self-organization of the spinal oscillators. But since a2-motoneurons show multi-frequency oscillation and a3-motoneurons show a rather continuous change of the frequency (indicating rather complex local neuronal networks), one can speculate that the number of neurons contributing substantially to the oscillation may vary between a few (a1-oscillators) and a few hundred (a3-oscillators). The characteristic of a2-oscillators to be able to change their organization when activated additionally by the parasympathetic nervous system division (the number of driving phases changes from 2 to 3) (Chapter V of [1], Figure 56) points towards complex local oscillators consisting of many interneurons.
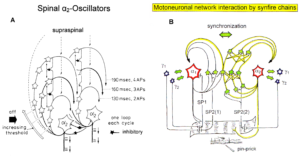
Figure 53: A. Interpretation of principle circuitries of the two spinal α2-oscillator. α2 = α2-motoneuron soma; open cell somas = interneurons; filled somas = inhibitory interneurons for lateral field inhibition (unclear whether they work pre- or post-synaptically). Three loops with sets of interneurons are indicated. Threshold arrow indicates higher thresholds for longer loops with respect to the adequate afferent input. If oscillator loop interpretation would be right, many more interneurons are necessary to realise the measured interspike interval and oscillation period distributions. For example, the interloop interaction is not indicated, which becomes important if the afferent input changes quickly; more inhibiting interneurons are necessary; the preference for the 3 AP loop is not explained by the model; the function of the oscillator is not known: Oscillates the α2-motoneuron in itself (impulse train) and is transiently inhibited by the interneurons (time between the impulse trains) or oscillates the α2-motoneuron together with the interneurons? One loop each cycle = probably the excitation uses in a first approximation one pathway for an oscillation cycle, but which pathway is taken depends on the probability distribution for a certain afferent input. B. Schematic simplified drawing of how oscillatory firing α1– and α2-motoneuronal networks get mono- and oligosynaptic projections from primary and secondary muscle spindle afferents. Phase relations to dynamic (α1) and static (α2) fusimotor networks are indicated by double head arrows. Essential in this drawing is that secondary muscle spindle afferents (SP2) project into the synfire chains of premotor oscillatory firing neuronal network of the α1– and α2-motoneurons whereas the primary muscle spindle afferent fiber (SP1) bypasses the α1-oscillatory firing neural network and projects directly onto the α1-motoneuron. The secondary muscle spindle afferent fiber SP2(2) may also project onto other interneurons of the synfire chain of the oscillatory firing α2-motoneuron. The sets of interneurons in a synfire chain probably consists of more the 3 interneurons. The fringe of subthreshold excited interneurons is not drawn. Muscle spindle arrangements have not been clarified.
8.5 Phase and frequency coordination improvement among neuron firing for improved CNS self-organization and neural repair in spinal muscular atrophy
8.5.1 Natural firing patterns of proprioceptive afferents and α and γ-motoneurons, measured simultaneously, and the phase and frequency relations between them
Figure 54 shows schematically natural simultaneous impulse patterns of a static and a dynamic g-motoneuron, two secondary muscle spindle afferents and the oscillatory firing a2-motoneuron O2 in a dorsal S4 nerve root (there are afferents and efferents in dorsal or ventral lower sacral roots) during continence and motor pattern changes. The small arrows and the dotted lines indicate existing relative phase coordination’s between the static and the dynamic g-motoneurons and motoneuron O2, and between g-motoneurons and secondary muscle spindle afferents. The dashed-circle line indicates a phase relation between the APs of the static g-motoneuron (g1) and the cross-correlation between SP2(2)-fiber (single ending one of the mother fiber) and SP2(5)-muscle spindle afferent fiber.
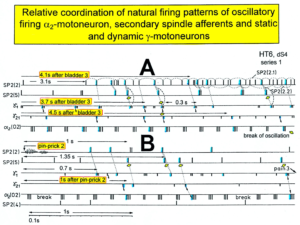 Figure 54: Impulse patterns of simultaneously recorded g-motoneurons (g1 and g21), secondary spindle afferent fibers (SP2(2), SP2(4), SP2(5)) and oscillatory firing a2-motoneuron O2 following bladder catheter pulling (bladder 3) (A) and pinprick 2 (B). B was recorded before A. In A, the impulse patterns of the two encoding sites SP2(2.1) and SP2(2.2) of the single parent fiber SP2(2) are indicated by the dotted curves. Times to the activity increases of g-motoneurons and secondary spindle afferents following stimulation are indicated. Similar time intervals of the occurrence of g-motoneuron APs and SP2(5) fiber APs (phase coordination) are indicated by the open arrows, and the similar time intervals of g-motoneuron APs and a-motoneuron APs are indicated by small arrows. Similar time intervals of the APs of fibers SP2(2) and SP2(5) are indicated by the double dotted lines, those of g1-APs and the SP2(2) fiber APs by a dotted line, and those of g1-APs and the SP2(2)-SP2(5) correlation by a curved dashed line. HT6; dS4.
Including the phase relations between the firings of secondary muscle spindle afferents and the oscillatory firing motoneuron O2, we obtain interlaced loops of coordination’s between the firings of g-motoneurons and secondary muscle spindle afferents, and between secondary spindle afferents and a-motoneurons and between a-motoneurons and g-motoneurons (co-activity of a and g-motoneurons) (Figure 55). It becomes obvious from the correlations between the natural impulse patterns (including those of single encoding sites of spindle afferents) that the g-loop is not a single loop, but a network of loops, because of the divergent projections of g-motoneurons onto muscle spindles and the probably divergent and convergent projections of secondary muscle spindle afferents into the neuronal network of the spinal cord, consisting of a and g-motoneurons and interneurons.
More general, phase and frequency coordination can be seen among the natural firing patterns in the afferent and efferent fibres. This means that upstream in the CNS, there should also be phase and frequency coordination among neuron firing. Two phase relations have been observed to occur mostly between the APs of the secondary muscle spindle afferents and the oscillatory firing motoneuron per one oscillation period (for somatic activation) in accordance with the “in phase” and “anti-phase” jumping on springboard and crawling. With this coordinated natural impulse traffic to and from the periphery, the change of integrative pattern states can also partly be understood from bladder to movement states.
8.5.2 Phase relation changes between the action potentials of the α and γ-motoneurons and secondary muscle spindle afferents in paraplegic 9 upon somatic and parasympathetic activation of the sacral micturition center
As shown in Figures 11, 12 of [1] (pages 613 and 614), the number (and the values) of phase relations changed between the firings of the different nerve fibers upon different stimulations. In the brain-dead human HT6, two phase relations were found between the a2-motoneuron and the secondary muscle spindle afferent fiber SP2(2) and the a2 and the g1-motoneuron (Figure 5 of [33]). Also, in the paraplegic, two phase relations often existed between the firings of the different nerve fibers. Probably a third phase relation occurred when the activated parasympathetic division channeled an additional input to the oscillatory firing somatic neuronal network.

Figure 55: Schematized existing phase relation between a2 and g1-motoneurons and a secondary muscle spindle afferent fiber (SP2). Parallel existing phase relations between other parent afferents and the a2-motoneuron and between parent secondary spindle afferents are not shown. Phase relation means the increased occurrence of phases in ms in a certain phase range between the action potentials (APs) of the two compared nerve fibers. The complex afferent and efferent muscle spindle innervation was not attempted to be shown. Small arrows at intrafusal muscle fiber indicate local contraction, which is in nuclear chain fibers readily transmitted to the place of afferent innervation. A possible reason of the doublet firing of the SP2 fiber is pictured to occur from single APs (schematized by bars) of two myelinated endings, not necessarily from pacemaker switching. More endings of the parent SP2 fibre and g1-motoneurons are indicated by dashed line branches. “Coactivity” indicates a correlation between g and a-motoneuron spinal cord circuitries for higher activations.
It is therefore worthwhile to further analyze the number of occurring phase relations per oscillation cycle upon different somatic and parasympathetic stimulations.
Since two phase relation occurred per oscillation cycle between the a3 and γ1-motoneurons and the SP2(1) fiber in paraplegic 9, and also their interspike intervals were rather similar, it is concluded that the neuronal networks of the a3 and g1-motoneurons formed together with the spindle afferent fiber SP2(1) a part of a functional unit. The neural ensemble is built by efficiencies of synapses and projections between the convergence of several g-motoneurons on one muscle spindle and by the divergence of muscle spindle projections onto several rhythmically firing populations of neurons driving a and g-motoneurons. Such a functional unit is partly pictured in Figure 55 and schematized drawn by three circles in Figure 56. The a2-motoneuron and the SP2(2) fiber belonged to another functional unit (another ensemble) (longer interspike intervals and the existence of only one phase relation). The two functional units (ensembles) are characterized in Figure 56 by two sets of three circles each. The two functional units interacted with each other, as there existed a phase relation between the a2 and a3-motoneurons (Figure 56).
Before stimulation (but with the anal and bladder catheters positioned in the patient), there were two phase relations in unit 1 (Figure 56a).
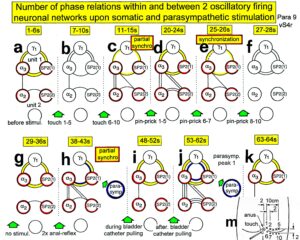
Figure 56: Number of phase relations within and between the two functional units a3/g1/SP2(1) and a2/-/SP2(2). Time intervals are those of Figure 2A. Note that in “a,” the functional unit 1 is with two phase relations per oscillation period in a stage similar to those seen in the brain-dead individual; with synchronization, only one phase relation occurred (e) and the parasympathetic division channeled an extra phase relation to interact with the somatic division (j). The insert (m) shows the sites of stimulation.
When touching sites, the skin outside the anal reflex area (Figures 56m), only slight changes occurred in the two units with respect to the number of phase relations (Figure 56b). But when touching the skin of the anal reflex area, a partial synchronization occurred (Figure 56c), and functional unit 1 reduced the number of phase relations to one. When pinpricking the skin outside the reflex area, two phase relations occurred again in unit 1 (Figure 56d). Upon pinpricking sites inside the anal reflex area, the number of phase relations between all the components of the two units dropped to one (Figure 56e), and synchronization occurred between the firing patterns. Since in the brain-dead human two-phase relations per oscillation cycle were observed in the functional units, it is possible that synchronization and the existence of only one phase relation for two to three seconds reflected a slight pathologic organization of the networks. Even though upon touching sites 6 to 10 (Figure 56c) or upon pinpricking sites 6 to 7 (Figure 56e) only one phase relation existed in unit 1, and synchronization occurred with both stimulations, it was shown (Figures 8, 9 (pages 608 and 610) of chapter V of [1]) that the touch afferent input organized a different functional state of unit 1 than pinpricking. The response time until the shortening of the oscillation period was longer than the oscillation period (» 100 ms) for pinprick and shorter for touch. The repetitive touch stimulation (most effective inside the anal reflex area) reinforced the sustained stretch reflex of the anal sphincter (continence pattern), and repetitive pinprick stimulation replaced the continence pattern by the protection reaction of the anal sphincter. The number of phase relations alone therefore only provides limited information on the functional state of the organization of the neuronal networks of the human spinal cord. Measurements of a number of parameters are necessary to yield a rather complete description of the functional state of neuronal networks.
Following pinprick 8 and 10 and with no stimulation, two phase relations existed again in functional unit 1 (Figure 56f, g), in some similarity to pre-stimulation status (Figure 56a). Following two anal reflex stimulations, partial synchronization occurred in the components of the two units (Figure 5 of [134]) and mainly two-phase relations existed (Figure 56h). But the organizational state was still not very similar to the pre- (Figure 56a) or post-stimulation state in unit 1 (Figure 56g), since the parasympathetic division was slightly activated following anal reflex stimulation, as was measured by the impulse pattern (increase of doublet activity) of the secondary muscle spindle afferent fiber SP2(1) (Figures 5,7 of [8] (part 2)). Therefore, probably one phase relation was due to the somatic activation in similarity to Figure 56c, e, and the other phase relation was due to the activation by the parasympathetic division. During bladder catheter pulling (Figure 56i) and with no stimulation (Figure 56k), the number of phase relations and possibly the functional organization was again similar to the pre-stimulation state (Figure 56a). Following strong (painful) bladder catheter pulling with a strong activation of the parasympathetic division (time interval 53-62s (Figure 56j)), measured by the increased doublet firing (see Figure 5 of [8] (part 2)) of the SP2(1) fiber, the functional organization of the sacral micturition center of the disconnected spinal cord changed completely. Functional unit 1 was now correlated by three phase relations per a3-oscillation cycle. The functional unit 2 also showed three phase relations per an a2-oscillation cycle, and interacted with functional unit 1 by three phase relations as well (between the a3 and a2-motoneurons; Figure 56j (53-62s)). Between the first and second parasympathetic peak at the time interval 63-64s (Figure 56k), the organization form of the two functional units was similar to that before the first parasympathetic activation (49-52s) (Figures 56j), only the values of the phase relations changed (Figure 12Bd of chapter 5 (page 614) of [1]). With the second strong activation of the parasympathetic division (parasymp. peak 2, time interval 65-72s (not shown)), the functional unit 1 was bound together again by three phase relations, in similarity to the first strong activation of the parasympathetic division [33], measured by the burst firing of the secondary muscle spindle afferent fiber SP2(1) (Figure 8 of [8]) and the increased doublet firing of the SP2(1) fiber (Figure 5 of [8]). The functional unit 2 was disorganized, but phase relations still occurred between the a3 and the a2-motoneurons and the SP2(2) fiber [33]. The a2-neuronal network and the g-motoneuron networks, driving the SP2(2) spindle afferent fiber, were integrated differently. After the second strong parasympathetic activation, in the time interval 73-76s (Figure 10A (page 611) of chapter V of [1]), the functional organization of the two functional units in the spinal cord was similar to that before the activation of the parasympathetic division. Functional unit 2 was slightly disorganized as the SP2(2) fiber strongly reduced its firing [33]. For further details see chapter V of [1] (pages 603-620).
This intricate analysis shows how complex neural network organization changes are. But such analyses are a first real step to understand human neural network organization and its consequences for disorders.
8.5.3 Building up of external loops to the periphery by premotor spinal oscillators
With the building up of simultaneous phase relations between a, g and SP2 fibres, an external loop of premotor spinal oscillators is built up to the periphery, which makes it possible to directly influence the firing of spinal oscillators by a rhythm training.

Figure 57: Spreading of oscillatory firing from a-motoneuron neuronal network to include muscle spindles (periphery) and synchronization of different a and g-motoneuron neuronal networks caused by touch and pinprick stimulation. (a) a-motoneuron neuronal networks fired oscillatory (solid line loop), g-motoneuron neuronal network did not or did only partly (dashed line loop), upon no additional stimulation. (b) Oscillatory firing a and g-motoneuron neuronal networks built up a phase relation with muscle spindle afferents and efferents (external loop to the periphery, indicated by thick arrows) upon touch. (e) Oscillatory firing a (internal circuitry loop) and g-motoneuron neuronal networks (external loop) synchronized (broad peak phase relation) upon pinpricks. The dashed line loop represents synchronization. (f) Oscillatory firing a (internal circuitry loop) and g-motoneuron neuronal networks (external loop). The open arrows indicate that it may be possible to synchronize spinal oscillators by rhythmic afferent input, generated by rhythmic movements (such as jumping on a springboard or running), and to re-preformat the neuronal circuitry by synapse remodeling to fire more physiologically oscillatory to reduce spasticity and improve locomotion. (g) Patient with spinal muscular atrophy during walking on treadmill. The Greek good is a bronze statue of Zeus found close to the cape of Artemision 460 BC.
Upon jumping on springboard (Figure 47B) and other rhythmic movements like walking (Figure 57g) or running (Figure 47A), premotor spinal oscillators organize themselves to fire transiently oscillatory according to the motor pattern and build up an external loop to the periphery (Figure 57). If the frequency of the rhythmic movement has an integer relationship to the Eigenfrequencies of the premotor networks and more rostral networks, these premotor networks get entrained for more specific self-organization.
8.5.4 Entrainment of premotor spinal oscillator networks by rhythmic movement-induced afferent input and inputs from supraspinal centers
If one approximates for high activation spinal neuronal networks into premotor spinal oscillators (driving the motoneuron) and propriospinal oscillators, then premotor spinal oscillators can be handled in a first approximation as single linear oscillators. The premotor spinal oscillators and the spinal pattern generating networks are self-organized and driven by peripheral afferent and supraspinal inputs. When training dynamic, rhythmic, stereotyped movements, the premotor spinal oscillators, approximated as linear oscillators, are driven by movement-induced afferent input from the periphery (mainly the legs) and surrounding pattern generating networks and possibly supraspinal inputs. These spinal oscillators and most likely their neuronal network can be entrained at least by use of the external loop for a better self-organization.
If one assumes that loop circuits do not only exist between the premotor spinal oscillators and the periphery, but are a general structure in the CNS, then motor learning involves the formation of loop circuits (or better loop network circuits) between the cortex and the periphery involving the sensory cortex and the thalamus. When a linear oscillatory system is driven by an external periodic input its response contains both frequency components. This is also, in general, true with nonlinear oscillators. However, in this case, if the external frequency is close to the Eigenfrequency of the oscillator itself, then it is possible to have a response at the external frequency only. This phenomenon is known as entrainment or synchronization. It is of paramount importance with respect to biological oscillators because it allows them to “latch on” to the environment. Thus, a rhythm with a free-running period of 24.7 hours may be synchronized to 24 hours when exposed to the natural sequence of day and night.
8.5.5 Need for improving the stability of phase and frequency coordination to allow specific patterns formation and learning transfer
A young mother, with stress incontinence after giving birth to the first child, could well improve her continence status upon jumping on springboard in addition to other training, because her CNS is not injured; just the periphery has to be repaired by means of changing the CNS.
In severe cervical spinal cord injury, the jumping on springboard (Figure 47B) is insufficient for bladder repair (the biggest problem in spinal cord injury). First, of course, the patient has to regain movement functions back (especially the trunk stability) to be able to perform the jumping on springboard. Further, the self-organization of CNS networks by phase and frequency coordination has to be improved to make learning transfer from movements to bladder functions possible, since in every CNS injury, the phase and frequency coordination is impaired. Large instabilities in phase and frequency coordination will not allow specific pattern formation as a basis for learning transfer. However, the stability of phase and frequency coordination can be improved when the patient is exercising on special coordination dynamics therapy devices (Figure 9).
The importance of stable phase and frequency coordination to allow specific pattern formation and in consequence learning transfer to other patterns can be understood at the collective variable level (System Theory of Pattern formation [41-43]) and at the neuron level. For further details see paragraph 2.2.
8.5.6 Entrainment of oscillators through jumping on springboard
Upon jumping rhythmically on springboard (Figure 47B), in addition to the stimulation of mechanoreceptors for movement control, also mechanoreceptors for bladder and rectum control are synchronously activated with the movement. Continence functions are synchronously activated with the jumping (coherent activation of bladder and movement patterns). Since, additionally for high activation, premotor spinal oscillators build up an external loop to the periphery (Figure 57), neural assemblies are directly entrained to improve their “Eigenfrequencies” and to coordinate their firing with other oscillators (Figure 59). The springboard has an Eigenfrequency (f ≈ 1Hz; ω=2πf), which makes a training in the entrainment region possible. A jumping frequency of 1 Hz is especially efficient for the entrainment of α3-oscillators because they have an “Eigenfrequency” also around 1 Hz.
8.5.7 Frequency ranges of premotor spinal oscillators
If one transposes the oscillation periods of the oscillators in Para 2 and HT5 (Figure 52) into frequency distributions one obtains distribution of oscillation frequencies of normal, brain-dead and normal humans (Figure 58).
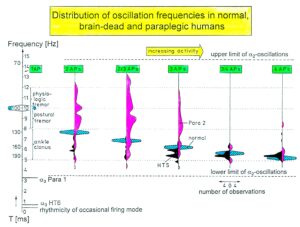
Figure 58: Frequency distributions of oscillation frequencies of continuously oscillatory firing a2-motoneurons with increasing number of APs per impulse train (increased activity) in paraplegic 2 (open), in brain-dead human HT5 (filled), and probably normal human (cross-hatched). Frequencies and rhythmic activity changes in the occasional and oscillatory firing mode are indicated. Ranges of physiologic tremor, postural tremor and ankle clonus are also drawn. Note that frequencies for the brain-dead HT5 are too low, and the oscillation frequencies of the spinal cord isolated for a long time (Para 2) are too high and too spread as compared to the theoretically predicted frequency ranges (cross-hatched). T = oscillation frequency.
The oscillation periods of the oscillators in Para 2 and HT5 were transposed into frequency distributions and plotted in Figure 58. The possible frequency ranges of normal humans are not known. To have an approximate comparison to the physiologic case, somehow normal oscillation period distributions were constructed in the following way. With the linear relation between the oscillation period and the number of APs per impulse train (Figure 67 of chapter III of [1]), the frequency values of stable oscillators were plotted into Figure 58. The small changes in oscillation frequency with different stimulations have been accounted for by small cross-hatched areas. The frequency distributions of stable oscillators have also to be measured in future. The normal oscillators have to be understood in the following way. Let a stable oscillator oscillate with 6.25Hz (T = 160ms) with 3 AP per impulse trains. If a higher activity is needed, the frequency is changing only little to about 6.5Hz, but the impulse train increases by 1 AP to a 4Aps impulse train. The cross-hatched areas represent therefore 6 oscillators each one firing with its own frequency. Only once it has been observed that a stable oscillator changed strongly its frequency for one oscillation. Such quick changes of the oscillation frequency are not possible with mechanical oscillators. Spinal oscillators have no analogy of the kinetic energy of mechanical oscillators. Also, magnetic field may not occur with the loop excitation. They are run by relative timing of activity with pre- and postsynaptic potentials. In unstable oscillators the frequency and the number of APs per impulse train change strongly with increasing or decreasing stimulation (afferent input). Unstable oscillators cover, for a certain AP number, a large range of possible frequencies.
8.5.8 Importance of spinal oscillators
The spinal oscillators in the human CNS are of interest for at least of 4 reasons. 1) They are important neural networks of the CNS, which generate the high activity mode of motoneurons for sphincters and other muscles. 2) They consist, in addition to the motoneuron, of many interneurons. They spinal oscillators allow therefore the study of interneuron connectivity under physiologic and pathophysiologic conditions. 3) The oscillation, namely the rhythmic repeated firing with impulse trains, is easy to measure invasively from lower human sacral nerve roots. And tremor (for example in Parkinson [39]), a result of synchronization of oscillatory firing motoneurons, is nearly as easily measurable non-invasively via surface EMG, as reflexes. The oscillators are somehow the CNS interneuron counterpart to the monosynaptic reflexes, which include only the motoneurons. 4) The regular firing of premotor spinal oscillators can be used as a reference basis to measure phase and frequency coordination during CNS changing self-organization.
8.5.9 Coordinated firing of premotor spinal oscillators
The rhythmic firing of the premotor spinal network oscillators was measured to be mainly coordinated (Figure 59). Probably there are hierarchies of different network oscillators to achieve coordinated CNS organization, which is generated by the organization tendencies of the network, descending impulse patterns and spatiotemporal afferent impulse patterns. If premotor spinal oscillators and other oscillators would not coordinate their firing and partly synchronize their firing, tremor would occur. Pathologic synchronization can be observed in Parkinson patients [39].
If spinal cord networks get injured as in spinal cord injury, the network oscillators partly lose their specific oscillator properties, namely the eigenfrequency. The oscillators do not fire anymore by one or several specific eigenfrequencies, but fire unregularly at many frequencies (Figure 58, para 2). These damaged oscillators can now synchronize with many other network oscillators and a rather chaotic neural network organization may occur. Pathologic patterns like spasticity can occur in spinal cord injury. To continuous jumping on springboard trains especially the premotor spinal oscillators to fire more rhythmically again (Figure 47B) and was called therefore ‘oscillator formation training’; it is a part of coordination dynamics therapy. Rhythmic dynamic stereotyped movements train generally the rhythmic and coordinated firing of the oscillators of the CNS.
The recording of the coordinated firing of premotor spinal oscillators at the single neuron level in human (Figure 59) was a fundamental measurement of CNS organization. The recording of oscillatory and coordinated firing of α1-motor units (FF-type) by surface electromyography in suitable patients is comparable easy (Figure 7).
In spinal muscular atrophy, also pathologic pattern organization can be expected, and was observed (Figure 28), because of the death of motoneurons and may be other neurons, and in consequence an impaired phase ad frequency coordination.
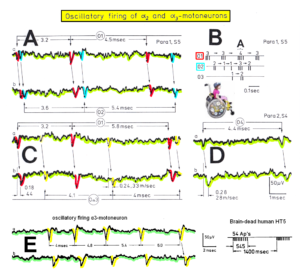
Figure 59: Recordings of impulse trains of oscillatory firing motoneurons in paraplegic 1 and 2. A. Impulse train of the continuously oscillatory firing α2-motoneuron O1 (3 of the 4 APs are shown) together with the impulse train of the transiently oscillatory firing α2-motoneuron O2. Interspike intervals of the impulse train are indicated. B. Schematic drawing of the impulse patterns of the 3 oscillatory firing α2-motoneurons O1, O2 and O3: O1 continuously oscillatory firing, O2 and O3 transiently oscillatory firing. “A” marks the sweep piece shown in A. Paraplegic 1. C. Impulse train of the α2-motoneuron O1 together with a part of the impulse train of the oscillatory firing α3-motoneuron Oα3. Interspike intervals, conduction times and conduction velocities are indicated. Paraplegic 1, S5 root recording. D. Impulse train (consisting of 2 APs) with the corresponding interspike interval, conduction time and conduction velocity of the continuously oscillatory firing α2-motoneuron O4. Paraplegic 2, S4 root recording. E. Start of the impulse train of an oscillatory firing α3-motoneuron of the brain-dead human HT5 [72].
9 Microenvironment (neurogenic niche) permissive for the differentiation and integration of new neurons
In the above frog model (Figure 33-46), it was shown that the development and the repair were very similar when the two kinds of motoneurons innervated two kinds of target cells (muscle fibers). In adult frogs a slow muscle fiber can be innervated by two motoneurons. By cutting the axon of one motoneuron, the membrane changes its properties in the denervated part. It can now generate action potentials which cannot be generated in the still innervated part of the muscle fiber (Figures 38 and 39). By partial denervation, therefore, we obtained innervation and denervation membrane properties in the same cell; but with more than one cell nucleus. In the developing frog, the pyriformis muscle fiber has approximately a length of 1mm. The distance of action of a neurotrophin is therefore shorter than 0.5mm. In order not to influence neighboring muscle fibers (Ø ≈ 15μm), the distance of action of the neurotrophin, secreted from the motoneuron, must be shorter than 15μm for building up the specific physiologic innervation pattern. It is likely that the distance of action of the neurotrophin is in the range of 0.1μm, which is governed by the distance between the neuron and the muscle fiber (Figure 45).
One may assume that a similar detailed neurogenic landscape is present in the neural networks of the human CNS. It is difficult to see how such microenvironment can be generated during the administration of neural stem/progenitor cells or neurotrophins for treating patients with spinal cord injury or spinal muscular atrophy. Before treating human patients, the microenvironment should be clarified in humans and grounded in a scientific basis. To induce competence for excitation-neurogenesis and excitation-repair coupling the following should be explored in humans:
a What kind of local neural activity is needed?
b How can the access of the NPCs to the local activity be achieved?
c What is the ability of the local environment to induce activity-sensing competence in the NPCs?
d What is the intrinsic state of the transplanted NPCs after injection?
e Proliferating cells and putative neural progenitors in both subgranular zone of the dentate gyrus and subventricular zone of the lateral ventricles are closely associated with the vasculature, indicating that factors released from the blood vessels may have a direct impact on adult neural progenitors [122]. How can blood vessel supply be achieved for the administrated stem/progenitor cells?
f Astroglia is supposed to induce neurogenesis from adult neural stem cells [122]. During stem cell therapy in spinal cord injury, the astrocytes will not contribute to the stimulation of neurogenesis, because outside the spinal cord matter there is no astroglia. How can the potential contribution from the astrocytes be simulated in a physiological context?
10 The necessity of adequate activation of networks for the repair of the human CNS
New neurons can be built in the animal and human CNS [45]. Electrical activity has been shown to regulate development in a variety of species and in various structures [123], including the spinal cord and cortex. Within the mammalian cortex specifically, the development of dendrites and commissural axons in pyramidal cells is activity-dependent [124]. Excitatory stimuli act directly on adult hippocampal neural stem/progenitor cells to favor neuron production [44].
Above it was shown that there is close similarity between development and repair in the frog peripheral nervous system. Case reports and group studies indicate, on the other hand, that there is only some similarity between development and repair in the human CNS.
Assuming that data concerning the animal CNS development, learning and memory formation in the animal hippocampus, partly hold in human development and repair, it may be understood how the natural impulse patterns can change the neural networks for repair through movement-based learning.
If it is the overloading of networks, which induces CNS repair, then those networks which must be repaired and those which will take function over must sufficiently be stimulated. The load in neural networks is increased by going to the limits of exercising and by improving the coordinated firing of neurons through improving the coordination of arm and leg movements, since neurons work as coincidence and more generally as coordination detectors (Figure 10). Further, by training complicated coordinated movements, neural network patterns can be reached, which lie deeply in the complexity of CNS organization. For functional repair, especially in spinal cord injury, the function of tracts has to be changed. By training different movements, different kinds of tract fibers will become overloaded when going to the training limits of these coordinated movements. By training impaired functions (with support), the corresponding damaged circuits and the functionally connected networks will become stressed and receive the stimulus for repair. As the building of new motoneurons in a human patient indicates, stressed networks in particular seem to be the stimulus for neurogenesis. The building of new neurons is a powerful repair strategy, especially when certain kinds of neurons are missing. But as the human research indicates, the neurogenesis is very limited in the human CNS and the benefit from such repair strategy needs more than a year (may be 3 years) of intensive training to contribute to functional recovery.
11 Selective requirements for natural activity in specific neurogenesis and in shaping the integration of specific neurons into damaged adult neural networks for repair
It was discovered that 30% of all cortical interneurons arise from a relatively novel source within the ventral telencephalon, the caudal ganglionic eminence [125]. Owing to their late birth, these interneurons populate the cortex only after the majority of other interneurons and pyramidal cells are already in place and have started to functionally integrate. In mice it was shown that activity is essential within three days of birth for correct migration, and that after this period, glutamate-mediated activity controls the development of their axons and dendrites [126].
The treatment of patients and mice data [127] indicate that during development and repair, selective activity is necessary for activity-dependent neuron migration and neuron axonal arborization and the building of neuron dendrite trees besides weight changes of synapses. Further, functional and structural repair can lead to the repair of physiologic CNS functioning, but it can also lead to pathologic functioning like epilepsy and cancer. It seems therefore that for a repair or building up of physiologic CNS patterns, natural physiologic activity patterns are needed, which are generated by movements, vegetative or physiologic cognitive function patterns. To reach and train natural organizational patterns in the deepness of phase and frequency coordination complexity, extremely coordinated and complex arm, leg and trunk movements have to be trained like the movement patterns as performed in Figures 21A and 25. For selective activation and repair of the human CNS, it is first necessary to understand how the human CNS is functioning and how its organization patterns are changing in response to the natural impulse patterns from receptors, informing the CNS about changes in the outside world (Figure 9).
12 Single-nerve fiber action potentials in frog, rat, dog and human (translational medicine)
The development of human repair-neurophysiology was mainly possible, because the Author was able to translate the single-nerve fiber action potential recording method from the frog (Figure 60) [128] via rat (Figure 61) [129] and dog (Figure 62, 63) [130, 131] to human (Figures 2, 3, 64-66) [32-37].
In frog a good quality of single-nerve fiber action potentials can be achieved because frog peripheral nerve fibers have no epineurium (only perineurium), which is shunting the electrodes. But for clarifying urinary bladder functions in human, the frog is not suitable. For teaching neurophysiology, the frog is very suitable, because no oxygenation is needed and wetting with ‘Ringers’ solution is sufficient. A demonstration of recording single-nerve fiber action potentials for students can be done. Even in a practical course for medical students the frog can be used for demonstrating the recording of single-nerve fiber action potentials.
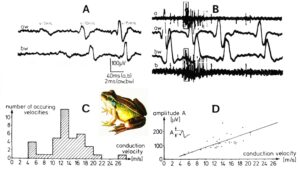
Figure 60: Single-nerve fiber action potential (AP) amplitude in relation to conduction velocity in the frog. A. Recording of 3 single APs of different conduction velocities and different amplitudes. Note, the AP with the highest conduction velocity (shortest conduction time from one electrode pair (trace a) to the other (trace b)) has the largest amplitude. B. Overall view of the activity increase on the traces a and b upon touching the skin of the frog. On the window traces aw and bw (stretched traces) the waveform of the APs of the touch afferents can nicely be seen. C. Conduction velocity frequency distribution histogram at room temperature of spontaneous and stimulated activity. D. AP amplitude in relation to conduction velocity.
In rat, the quality of single-nerve fiber action potentials recording is poor because the perineurium is shunting the electrodes and the nerve roots are too short for recording with two pairs of electrodes (Figure 61). The Author was able to use rat recordings for drug research [129] and the rat is nearer to human than the frog. But the regeneration of nerve fibers and spinal cord tract fibers is much stronger in rat than in human. On the other hand, the complexity of the neural networks is much less pronounced in the rat with the consequence that the rat cannot re-learn when transposing the nerves to extensor and flexor muscles. It is therefore very unlikely that the rat could exercise on the special CDT device (Figure 61A), because of missing CNS complexity. The human nervous system can relearn the task in seconds till minutes [135-137].
Regeneration experiments in rat have therefore only little consequence for human patients.

Figure 61: Recording of single-nerve fiber action potentials (APs) from the rat nervus suralis, which contains also nerve fibers innervating muscle fibers (nervus plantaris lateralis). A. Stimulation and recording layout. B. Sweep piece of rat K6, 110 days old; conduction times (ct) and conduction velocities (v) are indicated. C, D, E. Distribution histograms of conduction velocities for muscle nerve afferents (C), extra- and intrafusal motoneurons (D), and skin afferents (E). Identified distribution peaks are labelled according to the respective group they represent (C, D). Note that α2-motoneurons and secondary spindle afferents (SP2) conduct at the same velocity (calibration relation). Velocity ranges of α3, α2, and α1-motoneurons are represented by dotted, filled or cross-hatched columns. In D, APs from 13 sweeps of 0.2 sec duration are summarized. The frequency ratios of AP occurrence with pin-prick are: α1 : α2 : α3 = 637:133:65 ≈ 10:2:1. E. Histogram of added velocities of skin afferents from 12 rats, each stimulated 2 times (the open column). The velocity histogram for rat K6 following one pin-prick is represented by the filled columns.

Figure 61A: If the rat could be fixed to a special CDT device, it would not be able to turn continuously on it, because it could not generate the complicated patterns between pace and trot gait of coordinated arm and leg movements. But the rat is able to walk on hind limbs and could turn on the special CDT device with only the fore limbs or only with the hind limbs. Turning only with the hind limbs is something like exercising on a fitness bicycle.
In dog it can be recorded from nerve roots because they are long and high-quality recordings can be achieved (Figures 62, 63). But in the lower sacral nerve roots the continence functions are mixed with tail functions and a separation of a functions is difficult. Psychological it is also difficult to kill a dog. The Author used the dogs after surgery (shared experiments). The pig is may be more suitable for experiments. The nerve roots are long and the pig has only a small tail. Probably continence functions can be explored in the pig.

Figure 62: A. Sweep piece of extracellularly recorded afferent (SP1) and efferent (γ22, α2) action potentials (APs) from a ventral sacral nerve root of dog 4. The conduction times with their corresponding velocities (conduction distance = 8mm) are indicated between traces a (proximal electrode pair) and b (distal pair). The APs are labeled according to the group they belong to. B. Conduction velocity frequency distribution histograms of 20 sweeps of 0.2s duration, shown partly in A. The distribution peaks are labeled according to the group they most likely represent. The mucosal afferents were only active upon the pulling of the catheters. The Golgi tendon organ afferent activity (Bb) occurred only in response to strong anal catheter pulling in the time interval between 0.8s before and 1.5s after pulling.

Figure 63: A. Sweep piece of afferent APs from a sacral dorsal nerve root of dog 4. Conduction times and conduction velocities are indicated. SP1-AP retouched. B. Conduction velocity distribution histogram of two 0.2 sweeps, partly shown in A, with no stimulation (Ba) and following anal catheter pulling (Bb).
In human good quality recordings can be obtained, especially from the coccygeal root. In lower sacral nerve roots the continence functions are not mixed with other functions, apart may be from sexual functions which are probably conducted by thin fibers with action potentials of small size. Further, high-quality non-invasive surface electromyography can support single-nerve fiber action potential recordings (Figure 6), which can only be performed in human (Figure 7). Most importantly, direct consequences for the improvement of health of humans through therapy can only be obtaied from human recordings. For the repair of the human nervous system human repair-neurophysiology is needed. The most important step for repairing the human CNS was coming from the recordings of single-nerve fiber action potentials under physiologic and pathologic conditions. Especially the measured (impaired) phase and frequency coordination of neuron firing had consequences for improving human health because it can be improved through exercising on a special CDT device (Figures 9, 29). Figure 64 shows the recording layout schematically. For identifying anatomically, the kind of nerve root one is recording from, one has to have deep knowledge of the anatomy of the spinal canal with its nerve roots (cauda equina) to identify the roots in a real operation when the operational field is small (Figure 2B).
 Figure 64: A. Cauda equina and the intercostal nerve XII (subcostalis). Laminectomy, the dura mater spinalis opened and the erector spinae removed. Nerve roots lie in a position similar to a horse’s tail (cauda equina). Cadaver dissection by the Author. B. The dorsal spinal cord, the cauda equina nerve roots, the dura mater and the intercostal nerve XII removed and split up. The roots are cut at the dura mater. Note that the caudal ventral roots are thinner than the dorsal roots. C. The ventral spinal cord and the cauda equina nerve roots. The passage of the artery spinalis magna is indicated. Note the root interconnections on the left side of the Figure.
Since the conduction velocity of single-nerve fibers depends on the temperature, a calibration relation is needed for the identification. Figure 65 shows the calibration relation for human peripheral nerve fibers. The α2-motoneurons conduct at the same velocity as the secondary muscle spindle afferents. This calibration relation seems to hold also in animals. In the rat recordings, this calibration relation was used for identification of the nerve fiber type, because it was difficult to measure the temperature in single nerve fibers and keep the temperature close to 37°C. Probably in the rat recordings, the measured conductions velocities were too low, because the temperature was lower in the single fibers than in the temperature sensor between the electrode pairs (Figure 2B). The bathing of the nerve root in a solution to safely measure the temperature was not possible. In real operation it is taken care that the temperature of the patient is not decreasing too much. For a comparison of the conduction velocities between human and animals (Figure 66), the recordings from the dogs are most reliable because the recording conditions were most similar in the operation theaters. In experiments the temperature is not that important because of the calibration relation. But generally, if the recording temperature is higher, the conduction velocity peaks separate better and an identification of single-nerve fiber conduction velocities and impulse patterns is easier. For further explanation see [1].
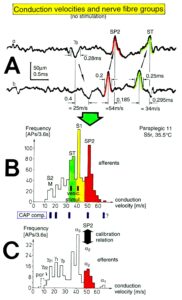
Figure 65: A. Sweep piece of action potential recording. Conduction times and corresponding conduction velocities are indicated. Root temperature at recording electrodes is 35.5°C. B, C. Conduction velocity distributions of afferents (B) and efferents (C) obtained for a time interval of 3.6s with no additional stimulation. SP2 = secondary muscle spindle afferents, S1 = stretch receptor afferents of bladder, ST = tension receptor afferents, M = mucosal afferents, S2 = afferents responding to fluid movement; a1 = a1-motoneurons (FF), a2 = a2-motoneurons (FR), a3 = a3-motoneurons (S), gß = gß-motoneurons, g1 = g1-fusimotors (dynamic), g21 = g21-fusimotors (static), g22 = g22-fusimotors (static), par = preganglionic parasympathetic motoneurons. CAP comp. = group conduction velocities obtained from the components of compound action potentials (CAPs). Vesic. stimul. = group conduction velocities of bladder afferents obtained upon electrical intravesical stimulation (see Figures 39 and 40). Calibration relation indicates the same peak group conduction velocity of secondary spindle afferents and a2-motoneurons (cross-hatched). Velocity histogram classes £ and < (half closed (left) interval).

Figure 66: Conduction velocity distribution histograms of efferent action potentials from a dog (A) and a human (HT6; dS4) (B) of lower sacral nerve roots. The distribution peaks are labelled according to the respective groups they represent. Motoneuron velocity ranges are indicated. In A, 24 sweeps of 0.2s, and in B, 30 sweeps (stimulated and non-stimulated) of 1.2s duration were used. Note that dog α and γ-motoneurons conducted faster than the ones of humans, recorded with the same equipment at the same temperature by the Author.
Still, it is very helpful that the single-nerve fiber action potential recording method is working in different species, because it is difficult to have measuring possibilities in humans. The patients want to benefit from the measurements. When the Author measured from patients with spinal cord injury, the recordings were used for intraoperative diagnostic. How much afferent and efferent fibers were in dorsal or ventral lower sacral nerve roots for implanting an electrical nerve root stimulator. This treatment is not used anymore, because it is a destructive operation. The upper research on the metamorphosis and regeneration in the frog is not possible to perform in human, even though with needle electromyography one can easily record from single muscle fibers intracellularly as is done in EMG labs. A combination of animal and human research is needed, but the infrastructure is missing and also the financial support.
Figure 66 shows that human nerve fibers conduct more slowly than dog nerve fibers. Still animal data are used in medicine and not the available ones from human. The finding of the composition of peripheral nerves in animals [132] was appreciated, whereas comparable human data are mainly ignored, even though they are related to nerve fiber conduction velocities and improvement of health in patients.
13 Possible sites of SMA repair though CDT
In the survival motor neuron (SMN) protein was first interest when mutations in its coding gene, SMN1, were linked to the neuromuscular disease spinal muscular atrophy (SMA) [138], a leading genetic cause of infant mortality. SMA presents in a range of severities with the most severe form, Type 1, being fatal within the first 2 years of life. Patients show degeneration of α-motor neurons in the lower spinal cord leading to progressive muscle weakness. The clear importance of SMN protein to the motor system led to it being named “survival motor neuron”, despite subsequent research showing that it is a ubiquitously expressed protein, required by all cells and tissue types, not just neurons [139]. Therefore, in SMA more defects have to be expected than just the loss of motoneurons. An inverted duplication in the region of SMN1 resulted in a second centromeric copy of the gene, termed SMN2, an evolutionarily recent event unique to Homo sapiens [140].
However, limited amounts of SMN can still be produced from the SMN2 gene and it is known that the copy number of SMN2 is inversely correlated with SMA disease severity [141]. If CDT would be able to increase the number of copies of the SMN2 gene, then a repair would be possible from this point of view. Patients with homozygous null mutations of SMN1 carrying four or more copies of SMN2 show a less severe phenotype, later age onset, and can have a normal lifespan [142]. Phylogenetic studies further highlighted the importance of SMN, since it is highly conserved throughout evolution and there are even multiple copies of SMN1 in the chimpanzee genome [140].
An axonal-SMN (a-SMN) has also been proposed, being produced from intron 3 retention during splicing. Due to an in-frame stop codon in intron 3,a-SMN mRNA is much shorter and encodes a protein of19 kDa. a-SMN is reported to be localized to the axon, and its expression is enhanced in the spinal cord and the brain during development and declines in the adulthood, with a hypothesized role in axonogenesis [143]. For the sprouting to increase muscle power in the SMA patients Melita and Vedad, axonogenesis is necessary and probably took place. The first indications that SMN played a role aside from its canonical functions in the spliceosome came when electron microscopy revealed localization of SMN in the dendrites and axons of motor neurons in the developing rat spinal cord [144]. So even in dendrites there may be problems in functioning and repair. This again shows how intricate the SMA disease is.
Moreover, motor neurons with lower levels of SMN protein were more susceptible to cell death from toxic compounds, whilst overexpression of SMN in motor neurons was protective [145]. SMN, therefore, clearly plays a major role in SMA pathology and the specific vulnerability to motor neurons in this disease. To understand why SMN is so vital for healthy cell maintenance, we must understand its role under normal, as well as disease, conditions. In a review, the role of the SMN protein in regulating protein homeostasis is described [71]. Protein homeostasis within cells can be regulated by two major pathways, production and clearance, which reach a dynamic balance to support and maintain physiological status.
Probably CDT will also improve the health in patients in amyotrophic lateral sclerosis (ALS). When the Author contacted via email the ALS patient Stephen Hawking, he did not get an answer. Probably Stephen Hawking would have answered, because the Author is besides a physician also a theoretical physicist. But famous patients are protected and isolated from the surrounding. The progress cannot reach them, which also holds for Michael Schumacher and Christopher Reeve.
14 Link between amyotrophic lateral sclerosis (ALS) and spinal muscular atrophy (SMA)
Amyotrophic lateral sclerosis (ALS) is another neurodegenerative disease that results in the progressive loss of motor neurons that controls voluntary muscles (Figure 20). Mutations in the RNA binding protein FUS cause this fatal adult motor neuron disease, whereas decreased expression of SMN causes the fatal childhood motor neuron disorder SMA. FUS-SMN protein interactions link the motor neuron diseases ALS and SMA [109].
A first try of administering CDT to an ALS patient, not done by the Author, reduced the speed of progression of ALS but could not stop the disease. The therapy has to start early and not only when only the eyes are still working.
15 Conclusion of the discussion on spinal muscular atrophy repair
It has been shown that there is strong similarity between neural development and repair in the frog peripheral nervous system. On the other hand, there is nearly no similarity between development and repair in the human CNS; repair cannot recapitulate development. Therefore, unlike many similarities across species in patterns of neural development, responses to injury differ greatly between frog and human. But if animal data are translated to human data, as is tried in this article, human treatment research [1-27] may get substantial support from biological research.
The building of a specific neuromuscular innervation pattern in frog related to the functional and structural repair in a human patient with a cervical spinal cord injury indicates that the simple adding of growth factors cannot support the repair of the complex organized human nervous system. The administration of genetically derived proteins to protect motoneurons from early cell death in spinal muscular atrophy is also unlikely to work because of the tremendous complexity of the neuro-muscular communication which was demonstrated here in the frog model. A health insurance company in Switzerland refused to pay for a special coordination dynamics therapy device (Figure 21A) which costs approximately 3000 USD. But it offered the patients a genetic therapy of doubtful health improvement for a million dollar or more, even though the great physicist Heisenberg stated that if a treatment/method is too expensive, it has to be looked for cheaper treatments, as for example in this case CDT. There seem to be other interests than just improving the health of patients. Administered genetically derived molecules/proteins to protect the motoneurons, if really working, may stop their early death but does not repair the neural networks. Coordination dynamics therapy, on the other hand, repairs/optimizes what is left of the neural networks and tries to repair the networks further through building of new motoneurons. Whether it can stop motoneuron cell death is unclear. For sure it is a healthy treatment and helps in everyday life. How much repair is really possible, only treatment research can really show.
Also, the administration of exogenous stem cells may only be helpful for structural repair, including the building of new neurons, if the patient has previously obtained CDT (or a similar scientifically movement-based learning therapy) for a year or more to naturally activate all the necessary guidance cues for repair. It could well be that under these neural milieu conditions, exogenously applied stem cells can support the endogenous stem cell reserves. As long as necessary medical research is replaced by pure biological research, it is unlikely that substantial CNS repair can be achieved in human patients – because the human CNS is different to those of animals with respect to repair, learning (neural network complexity and variability), and pattern stability.
16 Managing Covid-19 pandemics
The handling of the covid-19 pandemic in the world costs a terrible lot of money and politicians ask in mass media what can they do that people get vaccinated to stop the pandemic.
Here a logic answer. The pandemic is a medical problem. If mainstream is not able to solve the problem, then the medical research has to be improved and/or organized and existing medical knowledge used. For progress in medicine, research using only statistics is insufficient [133].
What should be done:
1 Medical research has to be organized generally, which has not been done so far.
2 The environmental pollution has to be reduced by planting tries to clean the air, especially around schools, which has not been done.
3 Improvement of hygiene by making the handles, which many people touch, out of bronze or brass (yellow looking). Has not been done.
4 Heating systems should be improved according to new developments. Convection has to be replaced by radiation (Figure 67). Has not been done.
5 Involving also lung physicians in discussions, because covid-19 infection is attacking first the lung which is the first protective shield against infection with its immune system in the lung surfactant (Figure 68). Only when the lung is overloaded with viruses (droplet infection), then the viruses succeed to get into the blood, where then the blood immune system fights. Pulmonologists have not been included in discussion how to handle the pandemic.
6 Means to get not infected. Has been done.
7 To stop censorship and manipulation in mass media. Has not been done.
8 Improvement of urban planning. Has not been done. The corruptive way through political parties is insufficient. Real competition for the best urban planning is needed.
9 Long-time vaccination side effects are not known and are not discussed. There are also logical reasons for being against vaccination, especially for children.
10 The deformation of people who are against vaccination like a witch-hunt, which will ruin the social life, has not been stopped.
Mainly only vaccines have been developed. The general improvement of health by improving medicine in general has not been attacked. The Author has published his suggestions [34] (Figures 67-69), but nothing has changed. Not only virus infections are dangerous, but also bacterial infection. There are bacteria which are resistant against all antibiotics. In conclusion: Medicine in general has to be improved. It is insufficient to develop only vaccines against the covid-19 virus.
The Author believes in vaccination, but not in the medical system anymore. Coordination dynamics therapy can improve many diseases [1-27], but universities or research institutions even do not want to get even informed about new developments in medicine. The principal problem is not the vaccination but the medical system.
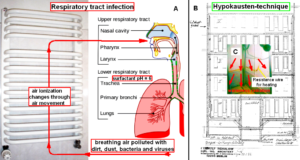
Figure 67: A. Breathing air used for heating. The moving air raises dust, dirt, bacteria and viruses and changes its ionization Such air is breathed by the person. The pH-value of the pulmonary surfactant increases from 5 in the direction of 6. B. ‘Hypokausten’- technique for a house with 4 floors. For ‘Hypokausten-technique’ contact: Gernulf Schalow, Diplom-Ingenieur, Tel. 0049 30 8332692, Weddigenweg 49, D-12205 Berlin. C. In a small apartment in Paris, a resistance-wire is installed for heating to have horizontal warmness radiation without raising dust and dirt and, may be, not to get viruses from other apartments. The resistance wire was so far not covered with stucco.

Figure 68: Physiologic and pathologic pulmonary epithelial functions to impede virus and bacterial infections. When living in a healthy surrounding (A) and exercising (E, F), the lung epithelia is in a healthy condition (C) and can partially protect against infections to a certain extent; the surfactant has a pH of 5 and is liquid so that macrophages can move about and engulf viruses, bacteria and particulates. The lung protection shield against infections is working. When living in a polluted surrounding with wrong air ionization (B), the surfactant gets a wrong pH value (pH value = 6) and becomes more rigid so that macrophages cannot move easily about and attack and engulf viruses and bacteria (D). Viruses can also invade the body through cracks. The pulmonary surfactant cannot protect any more against infections. Viruses and bacteria get into the body. Critical patients may die (G).
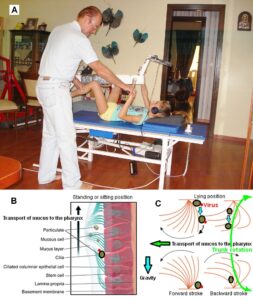
Figure 69: Improvement of lung functioning through Coordination Dynamics Therapy (CDT). A. Through exercising on the special CDT device, the CNS is activated for better functioning in the short-term memory and activates in turn the lungs for optimal breathing. B. Through the coordinated exercising, the ciliated epithelia will transport infected mucus, particulates and other liquids to the pharynx to cough up. C. Especially in the lying position, when the gravity is not working against the transport, the cilia are working efficiently. Through additional trunk rotation of the patient also big and heavy particles from the feet of the cilia can be transported to the pharynx.
Professional sports are not healthy. It could well be that vaccination induces a disease in athletes, as for example endocarditis. The 26-year-old sprint athlete Sarah Atcho got a heart infection following booster vaccination. Because of possible side effects, the system should not force somebody to get vaccinated. Big stress was put on the tennis player Novak Djokovic for not being vaccinated. The highest court in Australia reasoned that he is a danger to people. – (Vier Tage nach dem abgelehnten Einspruch von Tennisstar Novak Djokovic gegen die Annullierung seines Visums hat das Bundesgericht seine Begründung bekannt gegeben. Demnach war es angemessen, dass die australische Regierung davon ausging, dass der serbische Tennisprofi eine Anti-Impf-Einstellung habe und eine ‘Bedrohung für die Bevölkerung’ sei. Das geht aus den Unterlagen hervor, die das Gericht am Donnerstag veröffentlichte. (Spiegel: 20.1.2022)).
If highest courts rely on out-of-date medicine, it is their duty to get informed. Ignorance is no excuse (in German: Unwissenheit schützt vor Strafe nicht). This holds also for courts.
Filters are developed, which clean the air from dust, bacteria and viruses. But when these filters change the quality of the air in a way that the pH changes in the lung, then they are dangerous for the people/pupil, because the first protective shield in the lung is ruined (Figure 68).
17 Radiation and cancer injury repair
The Author suffered a ‘squamous cell carcinoma (epithelioma)’ (a malign tumor) in the maxilla. The tumor (stage between 1 and 2) was removed by surgery and a neck dissection performed. Two lymph nodes with formation of metastases were removed and two stages of further lymph nodes and lymph vessels were removed for safety reasons. Radiation therapy and chemotherapy were administered to the tumor area to reduce the risk of tumor recurrence from 30% to 15%. To mitigate the side effects of the anti-cancer treatment, the Author performed CDT for 15 to 20 hours per week. Three biopsies of strange growing in the mouth in the following five years and other diagnostics, including two PET, showed no sign of malign growth. The exercising on the special CDT device involved coordinated arm, leg and trunk movements and additionally simultaneously coordinated neck, tongue and lip movements. It improved body health in general and improved impaired brain health because of radiation and chemo therapy and reduced chronic stress because of anxiety of a recurrence of the cancer. As the Author found out later, exercise also contributed to the inhibition of cancer recurrence [22].
Eleven years after the cancer treatment the wetting of the cornea and the opacity of the vitreous body had improved but were still disturbed. Generally, not all side effects of chemo and radiation therapy had disappeared following 11 years of CDT. The sleep, for example, was still disturbed. The chemotherapy probably impaired nervous system functioning and in consequence many body regulations. It is known that the drug Vinblastine, which was administered to the Author, is nervous system toxic. The patients may get polyneuropathy.
Interesting is that following 11 years of CDT the side effects of the radiation reduced. Mouth and teeth became better. The radiation induced parodontids became reduced.
It seems therefore that CDT may help to recover better or to live longer following high level of radiation occurring in an atomic war or following an atomic power station accident.
References
- Schalow G (2013) Human Neurophysiology: Development and Repair of the Human Central Nervous System. Nova Science Publishers, Inc, Hauppauge NY, USA, 734.
- Schalow G (2015) Repair of the Human Brain and Spinal Cord. Nova Science Publishers, Inc, Hauppauge NY, USA, 525.
- Schalow G (2015) Neural network learning in human. Nova Science Publishers, Inc, Hauppauge NY, USA, 324.
- Schalow G (2002) Stroke recovery induced by coordination dynamic therapy and quantified by the coordination dynamic recording method. Electromyogr. Clin. Neurophysiol, 42:85-104.
- Schalow G (2002) Improvement after traumatic brain injury achieved by coordination dynamic therapy. Electromyogr. Clin. Neurophysiol. 42:195-203.
- Schalow G, Jaigma P (2006) Improvement in severe traumatic brain injury induced by coordination dynamics therapy in comparison to physiologic CNS development. Electromyogr. Clin. Neurophysiol. 46:195-209.
- Schalow G (2019) Regeneration of the human spinal cord via coordination dynamics therapy. Peertechz Publications, 97. eBook.
- Schalow G (2009) Partial cure achieved in a patient with near-complete cervical spinal cord injury (95% injury) after 3 years of coordination dynamics therapy. Electromyogr. Clin. Neurophysiol. 49:199-221.
- Schalow G (2002) Recovery from spinal cord injury achieved by 3 months of coordination dynamic therapy. Electromyogr. Clin. Neurophysiol. 42:367-376.
- Schalow G (2003) Partial cure of spinal cord injury achieved by 6 to 13 months of coordination dynamic therapy. Electromyogr. Clin. Neurophysiol. 43:281-292.
- Schalow G, Jaigma P & Belle VK (2009) Near-total functional recovery achieved in partial spinal cord injury (50% injury) after 3 years of coordination dynamics therapy. Electromyogr. Clin. Neurophysiol. 49:67-91.
- Schalow G (2010) Cure of urinary bladder functions in severe (95%) motoric complete cervical spinal cord injury in human. Electromyogr. Clin. Neurophysiol. 50:155-179.
- Schalow G (2021) CNS Repair in a Girl with a Spinal Cord Injury. Adv. Pub. Health Com. Trop. Med. 121:201-226.
- Schalow G (2006) Cerebellar injury improvement achieved by coordination dynamics therapy. Electromyogr. Clin. Neurophysiol. 46:433-439.
- Schalow G (2021) Cure-like brain-repair in a girl with atrophied cerebellum and pons through Coordination Dynamics Therapy. Adv Pub Health Com Trop Med 123:1-47.
- Schalow G, Jaigma P (2005) Cerebral palsy improvement achieved by coordination dynamics therapy. Electromyogr. Clin. Neurophysiol. 45:433-445.
- Schalow G (2006) Hypoxic brain injury improvement induced by coordination dynamics therapy in comparison to CNS development. Electromyogr. Clin. Neurophysiol. 46:171-183.
- Schalow G, Pääsuke M, Ereline J & Gapeyeva H (2004) Improvement in Parkinson’s disease patients achieved by coordination dynamics therapy. Electromyogr. Clin. Neurophysiol. 44:67-73.
- Schalow G & Nyffeler T (2001) Koordinationsdynamik-Therapie: Myelomeningozele (Spina bifida). Physiotherapie.
- Schalow G and Nyffeler T (2000) Koordinatiosdynamik-Therapie: Skoliose. Physiotherapy.
- Schalow G (2019) Permanent coma patient re-learned to speak via Coordination Dynamics Therapy. Arch. Clin. Med. Case Rep. 3:33-50.
- Schalow G (2017) Breast cancer growth inhibition via Coordination Dynamics Therapy. In: “Horizons in Cancer Research. Volume 68”. Editor: Hiroto S. Watanabe. Nova Science Publishers, Inc, Hauppauge NY, USA, 125-151.
- Schalow G (2020) Anaplastic oligodendroglioma WHO III brain cancer-patient recovered following operation, radiation and chemotherapy through Coordination Dynamics Therapy, which is also a Covid-19 treatment without ventilator. Int. J. Med. Clin. Imaging 5:165-210.
- Christensen JF, Jones LW, Andersen JL, Daugaard G, Rorth M, et al. (2014) Muscle dysfunction in cancer patients. Ann. Oncol. 25:947-958.
- Schalow G (2020) To live longer with a better quality of life through coordination dynamics therapy especially in patients with severe brain injury and brain-cancer. Int. J. Med. Clin. Imaging 5:118-155.
- Schalow G (2021) Euthanasia in organ donation can be avoided through Coordination dynamics therapy. Adv Pub Health, Com Trop Med: APCTM-132. Volume 3:1-34.
- Schalow G (2022) Basal ganglia and cortex repair through human-repair neurophysiology 12 years after hypoxia during birth. In Schalow G (Ed) Human Repair-Neurophysiology, 181-227.
- Schalow G (2021) Phase and frequency coordination improvement among neuron firing for improved CNS self-organization and neural repair in Parkinson and spinal cord injury. Int J Med Clin Imaging 6:350-425.
- Brzustowicz LM, Lehner T, Castilla LH, Penchaszadeh GK, Wilhelmsen KC, et al. (1990) “Genetic mapping of chronic childhood-onset spinal muscular atrophy to chromosome 5q11.2–13.3”. Nature. 344:540-1.
- Passini MA, Bu J, Richards AM, Kinnecom C, Sardi SP, et al. (2011) “Antisense oligonucleotides delivered to the mouse CNS ameliorate symptoms of severe spinal muscular atrophy”. Science Translational Medicine. 3:72ra18.
- Jedrzejowska M, Milewski M, Zimowski J, Borkowska J, Kostera-Pruszczyk A, et al. (2009) “Phenotype modifiers of spinal muscular atrophy: the number of SMN2 gene copies, deletion in the NAIP gene and probably gender influence the course of the disease”. Acta Biochimica Polonica. 56:103–8.
- Schalow G and Lang G (1987) Recording of Single Unit Potentials in Human Spinal Nerve Roots: a New Diagnostic Tool. Acta Neurochir. 86:25-29.
- Schalow G (2009) The classification and identification of human somatic and parasympathetic nerve fibers including urinary bladder afferents is preserved following spinal cord injury. Electromyogr. Neurophysiol. 49:263-286.
- Schalow G (2020) Classification and Identification of Human Peripheral Nerve Fibers by Conduction Velocity, Nerve Fiber Diameter and Natural Firing Patterns with Consequences for CNS Repair and Covid-19 Infection Treatment. Int. J. Med. Clin. Imaging 5:231-314.
- Schalow G (2005) Phase and frequency coordination between neuron firing as an integrative mechanism of human CNS self-organization. Electromyogr. Clin. Neurophysiol, 45:369-383.
- Schalow G (2021) Phase and frequency coordination improvement among neuron firing for improved CNS self-organization and neural repair in Parkinson and spinal cord injury. Int J Med Clin Imaging 6:350-425.
- Schalow G (1993) Spinal oscillators in man under normal and pathologic conditions. Clin. Neurophysiol. 33:409-426.
- Schalow G (2006) Surface EMG- and coordination dynamics measurements-assisted cerebellar diagnosis in a patient with cerebellar injury. Electromyogr. Clin. Neurophysiol. 46:371-384.
- Schalow G (2005) Tremor in Parkinson’s disease patients can be induced by uncontrolled activation and uninhibited synchronization of α2-motoneuron firing to which α1-motoneuron firing synchronizes. Electromyogr. Clin. Neurophysiol. 45:393-406.
- Schalow G (2010) Scientific basis for learning transfer from movements to urinary bladder functions for bladder repair in patients with spinal cord injury. Electromyogr. Clin. Neurophysiol. 50:339-395.
- Kelso JAS (1995) Dynamic Patterns. The Self-Organization of Brain and Behavior. MIT Press, Cambridge.
- Schöner G, Zanone PG, Kelso JAS (1992) Learning as change of coordination dynamics: Theory and experiment. Journal of Motor Behavior 24:29-48.
- Zanone PG and Kelso JAS (1992) Evolution of behavioral attractors with learning: Nonequilibrium phase transition. Journal of Experimental Psychology: Human perception and Performance, 18:403-421.
- Deisseroth K, Singla S, Toda H, et al (2004) Excitation-neurogenesis coupling in adult neural stem/progenitor cells. Neuron 42:535-552.
- Schalow G (2009) Building of New Motoneurons in the Human Spinal Cord upon Coordination Dynamics Therapy to Improve Finger Functions in Motoric Complete Cervical Spinal Cord Injury. In: Berkovsky, T.C. (Ed.), Handbook of Spinal Cord Injuries, Chapter 4, 231-264, Nova Science Publishers.
- Drapeau E, Montaron MF, Aguerre S, et al. (2007) Learning-induced survival of new neurons depends on the cognitive status of aged rats. J. Neurophysiol. 27, 6037-6044.
- Zhao C, Deng W, Gage FH (2008) Mechanisms and functional implications of adult neurogenesis. Cell 132:645-660.
- Kuffler SW & Gerald RW (1947) The small nerve motor system to skeletal muscle. J. Neurophysiol., 10:383-394.
- Kuffler S & Vaughan-Williams EM (1953) Small nerve junction potentials. The distribution of small motor nerves to frog skeletal muscle and the membrane characteristics of the fibers they innervate. J. Physiol., 121:289-317.
- Tasaki I & Mizutani K (1944) Comparitive studies on the activities of the muscle evoked by two kinds of motor nerve fibers. Jap. J. med. Sci. Biol, 10:237-244.
- Burke W & Ginsborg BL (1956) The electrical properties of the slow muscle fiber membrane. J. Physiol., 132:586-598.
- Kuffler SW, Vaugham-Williams EM (1953) Properties of the slow skeletal muscle fibers of the frog. J. Physiol, 121:318-340.
- Miledi R, Stefani E and Steinbach AB (1971) Induction of action potential mechanism in slow muscle fibers in the frog. J. Physiol, 217:737-754.
- Schmidt H & Stefani E (1976) Re-innervation of twitch and slow muscle fibers of the frog after crushing the motor nerves. J. Physiol, 258:99-123.
- Schmidt H & Stefani E (1977) Action potentials in slow muscle fibers of the frog during regeneration of motor nerves. J. Physiol, 270:507-517.
- Elul R, Miledi R, Stefani E (1968) Neurotrophic control of contracture in slow muscle fibers. Nature (London), 217:1274-1275.
- Elul R, Miledi E, Stefani E (1970) Neural control of contracture in slow muscle fibers in the frog. Acta physiol. latinoam, 20:194-226.
- Stefani E & Schmidt H (1973) Contractile responses to depolarizing drugs of slow muscle fibers during re-innervation by fast motor axons. Acta Physiol. Latinoam, 20:320-322.
- Lehmann N, Schmidt H (1979) Contractile responses to direct stimulation of slow muscle fibers before and after denervation. Pflügers Arch, 382:43-50.
- Miledi R, Parker I, Schalow G (1981) Calcium transients in normal and denervated slow muscle fibers of the frog. Physiol. 318:191-206.
- Guth L (1968) Trophic influences of nerve on muscle. Rev, 48:645-487.
- Gutmann E (1976) Neurotrophic relations. Ann. Rev. Physiol, 38:177-216.
- Harris AJ (1974) Inductive functions of the nervous system. Ann. Rev. of Physiol, 36:251-305.
- Buller AJ, Eccles JC & Eccles M (1960) Differentiation of fast and slow muscles in the cat hind limb. J. Physiol, 150:399-416.
- Gordon T, Purves RD, Vrbora G (1977) Differentiation of electrical and contractile properties of slow and fast muscle fibers. J. Physiol, 269:535-547.
- Gordon T, Vrbova G (1975) The influence of innervation on the differentiation of contractile speeds of developing chick muscles. Pflügers Arch, 360:199-218.
- Hamburger V (1934) The effects of wing bug extirpation in chick embryo on the development of central nervous system. J. Exp. Zool, 68:449-494.
- Hamburger V (1975) Cell death in the development of the lateral motor column of the chick embryo. Comp. Neurol, 160:535-546.
- Levi-Montalcini R, Levi G (1942) Les consequences de la destruction d’un territoire d’innervation peripherique sur le development des centres nerveux correspondants dans l’embryon de poulet. Biol, 53:537-545.
- Schalow G (1991) Conduction velocities and nerve fiber diameters of touch, pain, urinary bladder and anal canal afferents and a and g-motoneurons in human dorsal sacral roots. Electromyogr. Clin. Neurophysiol. 31:265-296.
- Chaytow H, Huang YT, Thomas H, Gillingwater TH, Faller KME (2018) The role of survival motor neuron protein (SMN) in proteinhomeostasis. Cellular and Molecular Life Sciences 75:3877-3894.
- Schalow G (1991) Oscillatory firing of single human sphincteric a2 and a3-motoneurons reflexly activated for the continence of urinary bladder and rectum. Restoration of bladder function in paraplegia. Electromyogr. Clin. Neurophysiol, 31:323-355.
- Moser H (1950) Ein Beitrag zur Analyse der Thyroxinwirkung im Kaulquappenversuch und zur Frage nach dem Zustandekommen der Frühbereitschaft des Methamorphose-Reaktionssystems. Rev. Swisse Zool.
- Ecker A (1864) Die Anatomie des Frosches. Verlag Friedrich Vieweg, Braunschweig.
- Stefani E & Schmidt H (1973) Contractile responses to depolarizing drugs of slow muscle fibers during re-innervation by fast motor axons. Acta Physiol. Latinoam, 20:320-322.
- Fatt P & Katz B (1951) An analysis of the endplate potential recorded with an intracellular electrode. J. Physiol, 115:320-370.
- Stefani E & Schmidt H (1972) A convenient method for repeated intracellular recording of action potentials from the same muscle fiber without membrane damage. Pflügers Arch, 334:276-278.
- Stefani E & Steinbach AB (1969) Resting potential properties of frog slow muscle fibers. Effect of different external solutions. J. Physiol, 203:383-401.
- Schalow G & Schmidt H (1975) Action potentials induced in slow muscle fibers by partial denervation. Nature, 253:122-123.
- Schalow G & Schmidt H (1979) Local development of action potentials in slow muscle fibers after complete or partial denervation. Proc. R. Soc. Lond, B 203:445-457.
- Ochs S & Ranish N (1969) Characteristics of the fast transport system in mammalian nerve fibers. J Neurobiol. 1:247-261.
- Schalow G & Schmidt H (1977) Effect of nerve length and temperature on the induction of action potentials in denervated slow muscle fibers of the frog. Pflügers Arch, 372:17-22.
- Peachey LD, Huxley AF (1962) Structural identification of twitch and slow striated muscle fibers of the frog. Cell Biol, 13:177-180.
- Couteaux R & Pecot-Dechavassine M (1970) Vesicules synaptiques et poches au niveau des ‘zones actives’ de la jonction neuromusculaire. R.Acad.Sc. (Paris), 271:2346-2349.
- Birks R, Huxley HE, Katz B (1960) The fine structure of the neuromuscular junction of the frog. J. Physiol., 150:134-144.
- Peper K, Dreyer F, Sandri C, Akert K, Moore H (1974) Structure and ultra-structure of the frog motor endplate. A freeze-etching study. Cell Tiss. Res, 149:437-445.
- Birks R, Katz B & Miledi R (1960) Physiological and structural changes at the amphibian myoneural junction, in the course of nerve degeneration. J. Physiol, 150:145-158.
- Gray EG (1957) The spinal and extrafusal innervation of a frog muscle. Proc. R. Soc. London, Series B, 146:416.
- Lännergren J, Smith RS (1966) Types of muscle fibres in toad skeletal muscle. Acta Physiol. Scand, 68:263-274.
- Orkand M, Orkand RK, Cohen MW (1978) Distribution of acetylcholine receptors on Xenopus slow muscle fibres determined by Bungarotoxin binding. Neuroscience, 3:435-446.
- Page S (1965) A comparison of the fine structure of frog slow and twitch muscle fibres. J. Cell Biol, 26:477-497.
- Karnovsky MJ (1964) The localisation of cholinesterase activity in rat cardiac muscle by electron microscopy. J. Cell. Biol, 23:217-232.
- Speidel CC (1941) Adjustment of nerve endings. In: Harvey lectures, 36:126-158.
- Wernig A, Pecot-Dechavassine M, Stöver H (1980) Signs of nerve regression and sprouting in the frog neuromuscular synapse. In: Ontogenesis of functional mechanism of peripheral synapses. INSERM Symposium No 13, Ed. J. Taxi, Elsevier/North Holland Biomedical Press.
- Miledi R (1960) Properties of regenerating neuromuscular synapses in the frog. J. Physiol, 154:190-205.
- Song H et al (1998) Conversion of neuronal growths cone responses from repulsion to attraction by cyclic nucleotides. Science, 281:1515-1518.
- Bennet MR, Pettigrew AG (1974) The formation of synapses in striated muscle during development. J. Physiol, 241:515-545.
- Schalow G, Aho A,Lang G (1992) Microanatomy and number of nerve fibres of the lower intercostal nerves with respect to a nerve anastomosis. Donor nerve analysis. I (IV). Electromyogr. Clin. Neurophysiol. 32:171-185.
- Hughes A (1961) Cell degeneration in the larval ventral horn of Xenopus laevis (Daudin). J. Embryol. Exp. Morph, 9:269-284.
- Riley A (1977) Spontaneous elimination of nerve terminals from the endplates of developing skeletal myofibrils. Brain Res, 134:279-285.
- Tessier-Lavigne M, Goodman CS (1996) The molecular biology of axon guidance. Science, 274:1123-1131.
- McCaig CD, Rajnicek AM, Song B, Zhao M (2002) Has electrical growth cone guidance found its potential? Trend in Neuroscience, 25:345-359.
- Kuffler SW, Vaughan-Williams EM (1953) Small nerve junction potentials. The distribution of small motor nerves to frog skeletal muscle and the membrane characteristics of the fibres they innervate. J. Physiol, 121:289-317.
- Schalow G (2009) Coordination impairment between the somatic and parasympathetic nervous systems in the human sacral micturition centre. Electromyogr. Clin. Neurophysiol, 49:337-367.
- Schalow G, Vaher I, Jaigma P (2008) Overreaching in coordination dynamics therapy in an athlete with spinal cord injury. Electromyogr. Clin. Neurophysiol, 48:83-95.
- Schalow G (2006) Symmetry diagnosis and treatment in coordination dynamics therapy. Electromyogr. Clin. Neurophysiol, 46:421-431.
- Schalow G, Pääsuke M, Jaigma P (2005) Integrative re-organization mechanism for reducing tremor in Parkinson’s disease patients. Electromyogr. Clin. Neurophysiol, 45:407-415.
- Thuret S, Moon LDF, Gage FH (2006) Therapeutic interventions after spinal cord injury. Nat. Rev. Neurosci, 7:628-643.
- Yamazaki T et al (2012) FUS-SMN protein interactions link the motor neuron diseases ALS and SMA. Cell Rep 2:799-806.
- Fouad K, Dietz V and Schwab ME (2001) Improving axonal growth and functional recovery after experimental spinal cord injury by neutralizing myelin associated inhibitors. Brain. Res, 36:204-12.
- Schalow G (2008) Stem cell therapy and coordination dynamics therapy improve spinal cord injury. Clin. Neurophysiol, 48:233-253.
- Schalow G (1990) Feeder arteries, longitudinal arterial trunks and arterial anastomoses of the lower human spinal cord. Zbl. Neurochir, 51:181-184.
- Praag van H, Shubert T, Zhao C, Gage F.H (2005) Exercise enhances learning and hippocampal neurogenesis in aged mice. J. Neurosci, 25:8680-8685.
- Gould E, Gross CG (2002) Neurogenesis in adult mammals: Some progress and problems. J. Neurosci, 22:619-623.
- Leuner B, Gould E, Shors TJ (2006) Is there a link between adult neurogensis and learning? Hippocampus 16:216-224.
- Eriksson PS, Perfilieva E, Bjork-Eriksson T, Alborn AM, Nordborn C et al. (1998) Neurogenesis in the adult human hippocampus. Nat. Med, 11:1313-1317.
- Gould E, Beylin A, Tanapat P, Reeves A, Shors TJ (1999) Learning enhances neurogenesis in the hippocampal formation. Nat. Neurosci, 2:260-265.
- Asanuma H and Pavlides C (1997) Neurobiological basis of motor learning in mammals. NeuroReport, 8:1-6.
- Piper MC and Darrah J (1994) Motor assessment of the developing infant. Chapter 1, Theories of motor development, Saunders Company, Philadelphia.
- Abeles M (1982) Local cortical circuits. An electrophysiological study. Springer, Berlin.
- Pavlásek J (1998) The binding problem in population neurodynamics: A network model for stimulus-specific coherent oscillations. Gen. Physiol. Biophys. 17:1-18.
- Song H, Stevens CF, Gage FH (2002) Astroglia induce neurogenesis from adult neural stem cells. Nature 417:39-44.
- Blankenship AG & Feller MB (2010). Mechanisms underlying spontaneous patterned activity in developing neural circuits. Nature Rev. Neurosci. 11:18-29.
- Wang CL et al (2007) Activity-dependent development of callosal projections in the somatosensory cortex. J. Neurosci. 27:11334-11342.
- Zhao C, Deng W & Gage FH (2008) Mechanisms and functional implications of adult neurogenesis. Cell 132:645-660.
- Drapeau E, Montaron MF, Aguerre S et al (2007) Learning-induced survival of new neurons depends on the cognitive status of aged rats. J. Neurophysiol. 27:6037-6044.
- Marco Garcia NV, Karayannis T & Fishell G (2011) Neuronal activity is required for the development of specific cortical interneuron subtypes. Nature 472:351-355.
- Schalow G (1987) Single unit potential amplitude in relation to the conduction velocity in frog and human. Zent.bl. Neurochir. 48:109-113.
- Wattig B, Schalow G, Heydenreich F, Warzok R and Cervos-Navarro J (1992) Nucleotides enhance nerve fibre regeneration after peripheral nerve crush damage – Electrophysiologic and morphometric investigation. Drug Res, 42:1075-1078.
- Schalow G & Barth H (1992) Group conduction velocities and nerve fibre diameters of α and γ-motoneurons from lower sacral nerve roots of the dog and humans, Gen. Physiol. Biophys, 11:85-99.
- Schalow G (1992) Recruitment within the groups of γ1, α2 and α3-motoneurons in dogs and humans following bladder and anal catheter pulling. Gen. Physiol. Biophys, 11:101-121.
- Boyd LA & Davey MR (1968) Composition of Peripheral Nerve, 1-57, Livingston, Edinburgh.
- Gerok W (1979) Deutsche Forschungsgemeinschaft: Zur Lage und Verbesserung der klinischen Forschung in der Bundesrepublik Deutschland. Harald Boldt Verlad, Boppard. ISBN 3-7646-1760-8.
- Schalow G & Zäch GA (1996) Reflex stimulation of continuously oscillatory firing a and g-motoneurons in patients with spinal cord lesion. Physiol. Biophys. 15, Suppl.1:75-93.
- Sperry RW (1945) The problem of central nervous system reorganization and muscle transposition. Quart. Rev. Biol. 20:311-369.
