Publication Information
Frequency: Continuous
Format: PDF and HTML
Versions: Online (Open Access)
Year first Published: 2019
Language: English
| Journal Menu |
| Editorial Board |
| Reviewer Board |
| Articles |
| Open Access |
| Special Issue Proposals |
| Guidelines for Authors |
| Guidelines for Editors |
| Guidelines for Reviewers |
| Membership |
| Fee and Guidelines |
 |
Real-time Variable Rate Applications of Nitrogen in Wheat, using multispectral camera system
Nikolaos Georgiadis1*, Vlasios Mangidis1, Christina Vogiatzi1, Konstantinos Papachristos 1, Christos Cavalaris2, Christos Antonopoulos3
1Agronomy Department, Augmenta Agriculture Technologies, Irakliou 40, Metamorfosi 144 51, Greece
2Department of Agriculture, Crop Production & Rural Environment, University of Thessaly, Fytokou str., 38446 Volos, Greece
3University of Thessaly, Electrical and Computer Eng., Volos, 38334, Greece
Received Date: August 09, 2023; Accepted Date: September 01, 2023; Published Date: September 08, 2023;
*Corresponding author: Nikolaos Georgiadis, Agronomy Department, Augmenta Agriculture Technologies, Irakliou 40, Metamorfosi 144 51, Greece. Email: georgiadis.na@gmail.com
Citation: Georgiadis N, Mangidis V, Vogiatzi C, Papachristos K, Cavalaris C, et al. (2023) Real-time Variable Rate Applications of Nitrogen in Wheat, using multispectral camera system. Adv Agri Horti and Ento: AAHE-184.
DOI: 10.37722/AAHAE.2023202
Abstract
The scope of the study was to evaluate the impact of Variable Rate Fertilizer Applications in the sustainable production of wheat using a multispectral camera system performing real-time VRA mounted on a tractor. The system calculates an NDVI-based Vegetation Index in real-time upon which the fertilizer application is performed concurrently utilizing dedicated agronomic algorithms. Multiple pilots have been set up in wheat fields in different geographical regions. Split in-season applications of Nitrogen fertilizer have been performed comparing conventional blanket applications with VRA, where the maximum amount is added only when necessary, as per the Vegetation Index calculation. The results obtained suggest unimpeded productivity despite the significant reduction of inputs of approximately 9% for Nitrogen fertilizers.
Keywords: Multispectral Camera System; Precision Agriculture; Real-Time VRA; Sustainable Wheat Production; Variable Rate Application
Introduction
A major challenge for modern agriculture is to balance sustainable productivity with increased food safety [1]. The pillar of sustainable agriculture is the optimized input requirements that will minimize environmental impact and realize sufficient economic benefits to the farmers. Precision Agriculture (PA) can positively contribute to the sustainable management of crop production inputs by addressing the actual needs of specific field regions rather than average needs of whole fields [2]. As a farming management approach, it focuses on collecting, analyzing, and evaluating agronomic information to make data-driven decisions, reacting to inter- and intra-field variations in crops [1]. Rapid technological developments and big data advances contribute to the increased adoption rate of precision farming tools [3].
Specifically, the ongoing developments in optical remote sensing technologies have provided valuable tools for remote detection and monitoring of the vegetation condition [4]. Spectral sensors have been widely adopted in standard agricultural cultivation techniques to build improved solutions globally [5]. Photogrammetry software technologies utilizing digital maps of fields to provide site-specific applications [6], multi-spectral cameras for UAV applications, and laser scanners for vehicle-based crop biomass determination [7] are examples of such technologies. Implementations of these technologies vary from improved fertilization to improved water management, and adaptable tillage [8-10].
Variable Rate Applications are defined as the targeted use of input in appropriate zones throughout the field in accordance with the natural variability to maximize profit, create efficiencies in input application and ensure sustainability [11].
Lately, concern over the harmful effects of N fertilization in the agricultural ecosystem has increased [12] due to the excessive use of this nutrient after the Green Revolution, which is becoming ecologically unsustainable. Thus, optimization of N use efficiency (NUE) is becoming an eminent need [13].
In cereal crops, nitrogen (N) is the most important element for maintaining growth status and enhancing grain yield. The dominant practice for farmers is to apply the same rate (Fixed rate) of N fertilizer over whole fields and even whole farms. In fields with spatially varying N needs, this practice leads to frequent mismatches between N fertilizer rate and utilized crop N need. Over-application of N increases the probability of NO3-N leaching below the root zone while under-fertilization limits yield and may restrict economic returns. Similar to Nitrogen VRA, Map-Based based spraying has been used to adjust the application rate in pesticide applications [14].
The scope of this paper is to determine the impact of Variable Rate Applications of Nitrogen fertilizer on sustainable productivity of wheat, utilizing a proximal sensing system that can perform real-time. Large scale pilots in different geographies were carried out in both hemispheres where conventional, in-season, blanket applications of Nitrogen fertilizer were compared with Variable Rate Applications. Crop productivity and fertilizer consumption were used as indicators to measure any impact respectively.
Material and Methods
Pilot setup
A split application pilot has been set up for three consecutive years in selected winter wheat fields in the Prefecture of Thessaly (Greece) covering a total of 30ha for 2020, 22.1 for 2021 and 43.7 for 2022. Out of this acreage the area treated with real-time Nitrogen VRA was 13.1, 16.7 and 26.2ha, respectively. Each field was split into two or three equivalent parts (Figure 1.) in terms of soil properties and productivity potential (Table 1, Figure 4). All standard cultivating techniques were undertaken in both parts of the field to ensure the unimpeded completion of the crop’s life cycle and productivity. In half of the fields, in-season Nitrogen application was applied at a predetermined Fixed-Rate, blanket application, while on the other half, a proximal sensing, passive, multispectral camera system (Augmenta Field Analyzer™) mounted on top of a tractor at 3.15m height was utilized to undertake Variable Rate Application (VRA) of Nitrogen in real-time.
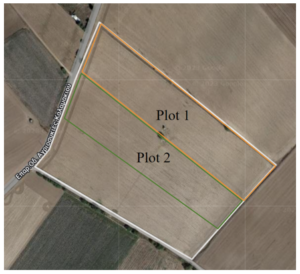
Figure 1: Design of Experiment of Nitrogen VRA in a wheat field in Thessaly Prefecture, Greece (2022). Plot 1 is the Fixed Rate Check Plot, while Plot 2 is the VRA treatment.
The key principle of the proprietary algorithms utilized is that savings can be realized in regions of the field where residual nitrogen from the soil suffices to produce high biomass (high vegetation index) and in problematic regions where the Vegetation index is proportionally lower. The proprietary algorithms are of a dynamic nature and designed to determine the magnitude and frequency of good/bad regions per field.
Large-scale pilots were also carried out in wheat fields in the USA and Australia to validate the replicability of the results under different cultivating regimes such as different soil profiles, weather conditions and cultivating techniques. In the USA, the field trial took place in 24 hard red winter wheat fields near Colby (Western Kansas) during the 2020-2021 growing season including three different wheat cultivars (‘Langing’, ‘Rugged’ and ‘TAM 114). For each cultivar, at least two comparable fields were selected some of which were VRA treated while Fixed Rate applications of Nitrogen fertilizer were performed in the rest as per a predetermined rate. The exact layout of the design is presented on Table 2.
Likewise, field trials took place outside the city of Ballarat in Australia (Western Victoria), during the 2020-2021 growing season including 12 winter wheat fields. In 7 of the fields, in-season N-VRA was conducted, while in the rest of the fields Fixed Rate in-season N application was carried out at a rate determined by the collaborating local agronomist (Table 3.).
During all operations the proximal sensing, multispectral camera system logs data regarding the Vegetation Index and the fertilizer consumption at a rate of 15 fps covering a Field of View of 16m and the full working width. The Vegetation Index (Figure 2a) is a proprietary NDVI-based index, calibrated to optimally address the geometry of the system utilized. The range of the index with regard to vegetation is 0-1, where lower values close to 0 correspond to qualitatively and/or quantitatively poor vegetation and values close to 1 correspond to dense and healthy canopy coverage. The fertilizer consumption data collected during the operations were used to calculate any savings imposed.
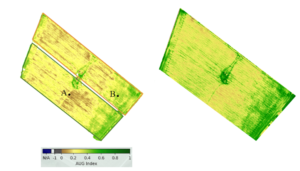
Figure 2: (a) Vegetation Index (AUG Index) Map per plot, generated using Augmenta Field Analyzer™, (b) Vegetation Index (NDVI) Map, generated using Sequoia Drone provided by University of Thessaly.
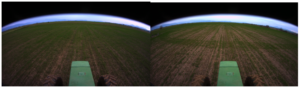
Figure 3: (a) RGB Snapshot of well developed area captioned by Augmenta Field Analyzer™ during operation (point A in Figure 2a), (b) RGB Snapshot of low vegetation area captioned by Augmenta Field Analyzer™ during operation (point B in Figure 2a).
For the evaluation of the impact of the VRA treatments, data gathered during the in-season applications (Vegetation Index maps, Application maps, etc.) have been compared to yield data gravimetrically gathered at the end of the growing season and were correlated with respective yield maps whenever possible.
Field samples
Sand (%)
Silt (%)
Clay (%)
pH
CaCO3 (%)
OM (%)
EC (mS/cm)
Field 1 – Sample 1.1
36.7
24.6
38.7
8.0
10.6
3.4
1.17
Field 1 – Sample 1.2
26.7
20.6
52.7
7.7
<0.5
3.5
1.27
Field 1 – Sample 2.1
28.7
22.6
48.7
8.1
5.0
3.5
0.96
Field 1 – Sample 2.2
26.7
22.6
50.7
8.0
1.0
3.3
0.97
Field 1 – Sample 3.1
26.7
20.6
52.7
7.4
<0.5
3.0
0.81
Field 1 – Sample 3.2
32.7
20.6
46.7
8.1
10.6
3.1
1.02
Field 2 – Sample 1.1
26.7
32.6
40.7
8.2
1.8
3.0
0.69
Field 2 – Sample 1.2
34.7
16.6
48.7
7.5
<0.5
2.2
0.49
Field 3 – Sample 1.1
12.7
34.6
52.7
8.1
22.6
1.5
3.0
Field 3 – Sample 1.2
10.7
38.6
50.7
8.3
21.7
1.1
2.7
Field 3 – Sample 1.3
12.7
38.6
48.7
8.5
23.6
1.3
2.3
Field 3 – Sample 2.1
14.7
34.6
50.7
8.1
22.5
1.2
3.5
Field 3 – Sample 2.2
12.7
32.6
54.7
8.3
23.2
1.1
2.5
Field 3 – Sample 2.3
14.7
34.6
50.7
8.3
22.9
1.3
3.0
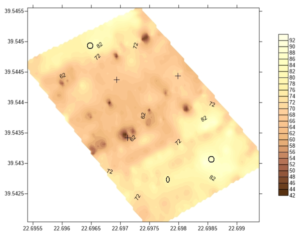
Figure 4: Electrical conductivity (EC) maps in wheat field in Thessaly Prefecture, Greece (2020).
Map Matching Process for Yield analysis
In order to match the operational data of Nitrogen VRA with the yield data, geographic coordinates were converted into Cartesian coordinates (3D). Fertilizer dosages and yield data were set as reference and secondary paths respectively. The fertilizer dosage of every point of the reference path was matched using the Inverse Weighted Distance (r=5.40m) with the corresponding yield value of the secondary path within this radius. Final matched data sets were extracted and 2D-line statistical plots were generated through Excel software in order to evaluate the performance of VRA operation.
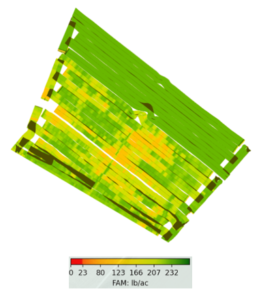
Figure 4a: Nitrogen Application Maps per plot in wheat field in Thessaly Prefecture, Greece (2022).
Results and Discussion
No statistically significant differences were observed between the Fixed Rate and VRA treated parts of the field with regard to the average productivity (P=0.44). However, the differences in fertilizer consumption between the VRA-treated parts of the field and the Fixed-rate treated ones were significant (P ≤ 0.05) resulting in 126 kg of fertilizer savings for 2020 and 131 for 2022 (Table 1, 2). This data shows that unimpeded productivity can occur with reduced inputs.
Field
Operation
Area Fertilised (ha)
Average dose (kg∙ha-1)
Savings
(%)Average Yield (kg∙ha-1)
Yield Increase (%)
Field 1
N-VRA
3.2
190.7
3.7
5506.2
13.9
Fixed Rate
6.6
200.0
–
4831.3
Field 2
N-VRA
1.1
193.8
4.3
5218.2
13.8
Fixed Rate
1.1
200.0
–
4585.6
Field 3
N-VRA
3.4
186.8
3.0
6869.0
21.6
Fixed Rate
3.8
200.0
–
5647.7
Field 4
N-VRA
1.7
192.3
4.4
5447.1
-4.3
Fixed Rate
1.7
200.0
–
5690.5
Field 5
N-VRA
2.5
181.1
8.9
6177.0
-0.7
Fixed Rate
2.4
200.0
–
6219.3
Field 6
N-VRA
1.1
192.6
6.1
7400.0
3.8
Fixed Rate
1.1
200.0
–
7129.5
Total/Average
29.7
–
4.9
9.9
Field
Operation
Area Fertilised (ha)
Average dose (l∙ha-1 or kg∙ha-1)
Savings
(%)Average Yield (kg∙ha-1)
Yield Increase (%)
Field 1
N-VRA
1.92
465.8
8.0
3419.8
3.5
Fixed Rate
2.35
500.0
–
3304.4
Field 2
N-VRA
13.4
141.9
4.3
2330.2
11.5
Fixed Rate
5.2
148.3
–
2090.2
Field 3
N-VRA
2.2
223.5
9.5
3513.4
8.7
Fixed Rate
2.1
247.1
–
3233.5
Field 4
N-VRA
2.5
192.3
3.6
3095.7
-6.2
Fixed Rate
1.9
146.7
–
3301.7
Field 5
N-VRA
2.7
119.4
13.3
2143.6
14.7
Fixed Rate
2.6
230.0
–
1868.8
Field 6
N-VRA
3.5
146.3
16.6
1588.6
16.6
Fixed Rate
3.3
148.3
–
1852.9
Total/Average
43.7
–
7.5
–
10.0
The outcome of the large scale pilot in the USA is shown in Table 3. Despite the fact that no statistically significant differences (P=0.09) were observed between the VRA treated fields and the Fixed Rate treated ones in terms of productivity there is an evident trend of increased yielding, which when combined with the savings imposed (10.8% on average) provide a sufficient income increase for the farmer with a reduced environmental impact.
Varieties
#N of fields
Operation
Area Fertilised (ha)
Savings (%)
Average Yield (kg∙ha-1)
Yield Increase (%)
LANGIN
5
N-VRA
115.6
11.0
2979.2
11.9
10
Fixed Rate
568.3
–
2602.6
RUGGED
2
N-VRA
96.0
11.7
2602.6
17.6
5
Fixed Rate
149.0
–
2212.6
TAM 114
1
N-VRA
49.4
8.4
3107.5
-9.2
1
Fixed Rate
44.1
–
3423.0
Total/Average
1022.4
10.8
10.0
Similar to the outcome of the US pilot, the results from the pilot in Australia (Table 4) showed no statistically significant differences (P=0.18) in terms of yield productivity between the VRA treated fields and the Fixed rate treated ones. However, as previously the 11.2% of yield increase observed along with the statistically significant (P=0.045) reduction of N-fertilizer by 7.2% on average supports the assumption that a more sustainable way of production is feasible where the reduced inputs have no impact on productivity.
Crop
#N of fields
Operation
Area Fertilized (ha)
Savings (%)
Average Yield (kg∙ha-1)
Yield Increase (%)
Hard Red Winter Wheat
7
N-VRA
184.5
7.8
8000
11.2
5
Fixed Rate
227.7
–
7200
Total
12
412.2
A qualitative evaluation of the Vegetation index map (AUG-Index) (Figure 6a) vs the Field Application Map Figure 6b) shows that in regions of very low AUG-Index (close to 0) dramatically increased savings are imposed since these parts correspond to a ditch and no plants are grown there. A slight reduction in the fertilizer rate added is also imposed in the parts of the field with the highest AUG-Index values (>0.51), since sufficient residual Nitrogen is present in these parts of the field that has allowed the plants to develop healthy vegetation. In the rest of the field where the AUG_Index values range from 0.22 to 0.5 the maximum fertilizer dose is added which is equal to the dose recommended by the collaborating local agronomist. Due to the condition of the field, Augmenta N-VRA implementation resulted in fertilizer savings of 14.4%.
The matching of the Vegetation Index (AUG Index)-, Fertiliser application, and the Yield Maps showed that fertilizer savings occur due to the reduction of added fertilizer in the areas of the field with the highest Vegetation Index (Figure 5, point a). In each session the agronomic algorithm dynamically categorizes the AUG Index values encountered and an upper percentile of the distribution as regions of reached potential. Despite the reduction of added fertilizer -or even because of it-, an increase in yielding is also observed in these areas. An example of the map matching is shown in Figure 5.
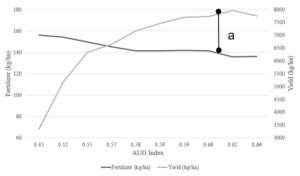
Figure 5: Correlation between fertilizer added, yield and AUG-Index of a wheat field in Australia where real-time, in-season Variable Rate Application was carried out utilizing close-range remote sensing (Augmenta Field AnalyzerTM), 2020.
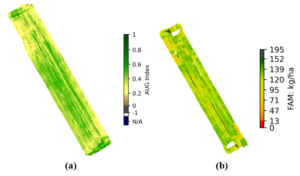
Figure 6: a. Vegetation Index (AUG Index) Map and b. Field Application Map (FAM) of a wheat field in Australia where real-time, in-season Variable Rate Application was carried out utilizing close-range remote sensing (Augmenta Field Analyzer TM), 2020.
This is a general trend observed in the majority of the fields from the multiple geographies included in this study indicating that there is a strong relationship between the yield increase achieved and the non-linear nature of the VRA algorithm utilized for the in-season application of the nitrogen fertilizer.
In fields where Fixed Rate applications were carried out, the increased input of fertilizer in regions with higher AUG Index values did not result in respective yield increase as shown in Figure 2. Such an operation is suboptimal given the over application of valuable resources, the potential yield compromising and the increased environmental impact. It has been estimated that 50% or less of the N applied to cropland is recovered during harvest, and this percentage decreases as the N fertilizer rate increases. Worldwide, up to 64% (an average of 18%) of applied N is lost via NH3 volatilization (Pan et al., 2016) (Sheer et al, 2023).
Accomplishing a balance between N supply and crop demand, without excess or deficiency, is the key to optimizing trade-offs amongst yield, profit, and environmental protection in any agricultural system worldwide [15].
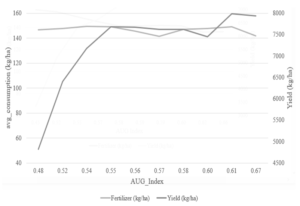
Figure 7: Correlation between fertilizer added, yield and AUG-Index of a wheat field in Australia where real-time, in-season Variable Rate Application was carried out utilizing close range remote sensing (Augmenta Field AnalyzerTM), 2020.
Crop sensing technologies have been identified as having benefits including improved Nitrogen use efficiency and positive environmental effects. Although sensor-based N application had quite variable outcomes, Nitrogen savings between 5-45%, without significant impact on grain yield were commonly present [16]. In a study [17] conducted using plots, over 2000 m2 no benefit was reported of Nitrogen Variable Rate Application, both on sensor readings. It was concluded that, besides the sensor-optimized Nitrogen rates, “the enhancements in grain yield and PFP of the variable-rate strategy originated from the later N input as side-dressing rather than the variation in N rates”, as similar outcomes were observed between variable or uniform side-dress application.
The results of this study showed that in wheat production, sensor-based Variable Rate Application (VRA) can lead to a noticeable input reduction of nitrogen fertilizer in wheat production. By accomplishing input use efficiency, a significant reduction in their environmental impact is achieved. Already since 2011, Grisso and his team have showcased that VRAs increase the economic return by strategically optimizing inputs in each management zone [11]. Similar results regarding a reduction of inputs in pesticides and N-fertilizer up to 25% have been reported in a similar study in potato [18]. Several studies have been focused on nitrogen application rates and timings to achieve high crop yield and better grain quality and environmental pollution control measures [19].
Conventional farming techniques blended with the intensive use of chemical fertilizers and pesticides brought many hazardous consequences to living beings, their habitat, and environment [20]. In particular, nitrogen fertilization affects natural ecosystems by nitrate pollution in groundwater and surface [21]. In California, USA, nearly 419,000 tons of nitrogen leach into groundwater annually [22]. In addition, loss of ammonia from agricultural soils affects adjacent and downwind ecosystems. NH3 reacts with other atmospheric compounds and serves as a precursor of fine particulate matter (PM2.5), which is classified by the US Environmental Protection Agency as one of the six critical atmospheric pollutants. High PM2.5 concentrations can have negative health consequences. A lot of epidemiological studies have declared the negative effects of the increase in PM to human health including cardiovascular and pulmonary diseases, respiratory diseases and premature death [23].
The global study presented here shows that utilization of precision Agriculture Technologies enabling sensor based, in-season VRA of Nitrogen fertilizer can contribute to a significant reduction of environmental impacts, and the consequences on public health while increasing the farmers income especially when high rates of fertilizers are used. There are important environmental and socio-economic advantages that can be realized through the wide adoption of precision Agriculture Technologies, along with multiple other complementary practices (e.g. water management, use of nano-fertilizers, genetic breeding) to promote sustainable wheat cultivation while mitigating global food insecurity [24].
Conclusions
This study presents the impact of Variable Rate treatments utilizing an integrated multispectral camera system carrying out real-time applications, in three different regions around the globe, that in comparison with the Fixed Rate operations, achieved to reduce inputs while increasing yield in winter wheat fields. The average fertilizer savings was 9.2%, while the average yield increase was 9.8%. Based on the outcomes of this study it is evident that multiple benefits can be realized by the integration of modern technologies in agriculture. The proprietary algorithms utilized due to their dynamic nature consistently realize savings the magnitude of which is highly dependent on the variability encountered in each field. The correlation between VRA and Yielding shows that there is a tendency for increased yielding in the fields treated with VRA. However, given the multitude of parameters included in the pilots that might affect the results such as different cultivars, different soil profiles, different growth stages, etc. extensive analysis of yield data throughout the years is essential to better understand and possibly model the variability of the results detected.
References
- Sharma L K, Bali S K (2018). A review of methods to improve nitrogen use efficiency in agriculture. Sustainability, 10(1), 51.
- Spiertz J H J (2009). Nitrogen, sustainable agriculture and food security: a review. Sustainable agriculture, 635-651.
- Finger, R., Swinton, S. M., El Benni, N., Walter, A. (2019). Precision farming at the nexus of agricultural production and the environment.
- Bergera K, Machwitzc M, Kyckod M, Kefauvere S C, Van Wittenberghea S, et al. (2022). Multi-sensor spectral synergies for crop stress detection and monitoring in the optical domain: A review Elsevier Inc.
- Pedersen S M, Lind K M (2017). Precision agriculture-from mapping to site-specific application. In Precision agriculture: Technology and economic perspectives (pp. 1-20). Springer, Cham.
- Green, D. R., Hagon, J. J., Gómez, C., & Gregory, B. J. (2019). Using low-cost UAVs for environmental monitoring, mapping, and modeling: Examples from the coastal zone. In Coastal management (pp. 465-501). Academic Press.
- Balafoutis, A. T., Beck, B., Fountas, S., Tsiropoulos, Z., Vangeyte, J., van der Wal, T., & Pedersen, S. M. (2017). Smart farming technologies-description, taxonomy an economic impact. In Precision agriculture: technology and economic perspectives (pp. 21-77). Springer, Cham.
- Guerrero, A., De Neve, S., & Mouazen, A. M. (2021). Current sensor technologies for in situ and on-line measurement of soil nitrogen for variable rate fertilization: A review. Advances in Agronomy, 168:1-38.
- Dahal S, Phillippi E, Longchamps L, Khosla R, Andales A (2020). Variable rate nitrogen and water management for irrigated maize in the Western US. Agronomy, 10(10), 1533.
- Jia H, Guo M, Yu H, Li Y, Feng X, et al. (2016). An adaptable tillage depth monitoring system for tillage machine. Biosystems Engineering, 151:187-199.
- Grisso R D, Alley M M, Thomason W E, Holshouser D L, Roberson G T (2011). Precision farming tools: variable-rate application.
- Geisseler D, Scow KM. Long-term effects of mineral fertilizers on soil microorganisms—A review. Soil Biol. Biochem. 2014, 75:54-63.
- Udvardi, M.K, Brodie, E.L, Riley, W.J, Kaeppler, S.M, Lynch, J.P. Impacts of agricultural nitrogen on the environment and strategies to reduce these impacts. Procedia Environ. Sci. 2015, 29, 303.
- Yadav, M. R., Kumar, S., Lal, M.K., Kumar, D., Kumar, R., et al. (2023). Mechanistic Understanding of Leakage and Consequences and Recent Technological Advances in Improving Nitrogen Use Efficiency in Cereals. Agronomy 2023, 13(2), 527.
- Cassman KG, Dobermann AR, Walters DT (2002). Agroecosystems, nitrogen-use efficiency, and nitrogen management. Ambio, 31:132-140.
- Colaço A F, Bramley R G (2018). Do crop sensors promote improved nitrogen management in grain crops?. Field Crops Research, 218:126-140.
- Ma B-L, Wu T-Y, Shang J, 2014. On-farm comparison of variable rates of nitrogen with uniform application to maize on canopy reflectance, soil nitrate, and grain yield. J. Plant Nutr. Soil Sci. 177:216-226.
- Kempenaar C, Been T, Booij J, Van Evert F, Michielsen J M, et al. (2017). Advances in variable rate technology application in potato in The Netherlands. Potato research, 60:295-305.
- Pattey, E., Strachan,I.B., Boisvert, J.B, Desjardins,vR.L, McLaughlin, N.B. (2001). Detecting effects of nitrogen rate and weather on corn growth using micrometeorological and hyperspectral reflectance measurements. Agricultural and Forest Meteorology, 108:85-164.
- Radhakrishnan, S. (2017). Sustainable cotton production. In Sustainable fibres and textiles (pp. 21-67). Woodhead Publishing.
- Savci S (2012). An agricultural pollutant: chemical fertilizer. International Journal of Environmental Science and Development, 3(1), 73.
- Tomich T P, Brodt S B, Dahlgren R A, Scow K M. (Eds.). (2016). The California nitrogen assessment: Challenges and solutions for people, agriculture, and the Univ of California Press.
- Kwok R H F, Napelenok S L, Baker K R (2013). Implementation and evaluation of PM2.5 source contribution analysis in a photochemical model. Atmospheric Environment, 80:398-407.
- Scheer C, Rowlings DW, Antille DL, Migliorati MDA, Fuchs K, et al. (2023). Improving nitrogen use efficiency in irrigated cotton production. Nutrient Cycling Agroecosystems 125:95-106.
