ISSN: 2641-6816
Frequency: Continuous
Format: PDF and HTML
Versions: Online (Open Access)
Year first Published: 2018
Language: English
| Journal Menu |
| Editorial Board |
| Reviewer Board |
| Articles |
| Open Access |
| Special Issue Proposals |
| Guidelines for Authors |
| Guidelines for Editors |
| Guidelines for Reviewers |
| Membership |
| Fee and Guidelines |
 |
Quantitative Analysis of Relationship between Postprandial Plasma Glucose and Food/Meal (Math-Physical Medicine)
Gerald C Hsu*
eclaireMD Foundation, USA
Received Date: April 03, 2020; Accepted Date: April 15, 2020; Published Date: April 24, 2020
*Corresponding Author: Gerald C Hsu, eclaireMD Foundation, USA. Tel: +15103315000; E-mail: g.hsu@eclairemd.com
Citation: Hsu GC (2020) Quantitative Analysis of Relationship between Postprandial Plasma Glucose and Food/Meal (Math-Physical Medicine). Adv Nutri and Food Sci: ANAFS-179.
Abstract
The author has been diagnosed with three chronic diseases including type 2 diabetes (T2D), hypertension, and hyperlipemia. Since 2010, he focused on T2D research to save his life. He collected and processed approximately 1.5 million data regarding his health and life details. In 2014, he developed a mathematical model of the metabolic system known as the math-physical medicine (MPM) approach by applying mathematics, physics, engineering modeling, and computer science such as big data analytics and artificial intelligence. This paper focuses on the quantitative relationship between postprandial plasma glucose and food/meal.
Keywords: Artificial Intelligence; Chronic Diseases; Food; Lifestyle Data; Math-Physical Medicine; Meals; Metabolic Conditions; Metabolism; Nutrition; Postprandial Plasma Glucose; Type 2 Diabetes
Introduction: The author used math-physical medicine to research and identify the quantitative relationship between postprandial plasma glucose (PPG) and food/meal.
Methods
Food is the most important factor of PPG, but it is also difficult to regulate eating habits. He created an artificial intelligent (AI) based software to collect his meal data by utilizing optical physics, signal processing, mathematics, statistics, and machine learning. He then developed a PPG prediction model by combining 6M food nutrition data from the United States Department of Agriculture (USDA) and his ~4,000 meal photos as his food database. Each meal picture links with data, including nation, meal location, food type, menu/dish name, and nutritional ingredients. The system can estimate consumed carbs/sugar amount and then predict PPG value prior to eating.
Results
He selected a period of 1,194 days (6/1/2015-9/7/2018) with 3,721 meals (including snacks) and ~100,000 data for his analysis. There were 86 airline meals consumed during his 94 trips during this period. The summary results are listed by both nation and meal location; then, they were sorted by PPG value with the format of PPG (mg/dL) & carbs/sugar (gram).
By Nation (Table 1):
Nation
No. Meals
PPG (mg/dL)
Carbs/Sugar (grams)
Nation %
USA
2148
117.6
13.0
58%
Taiwan
679
123
14.9
18%
Japan
294
117.4
15.6
8%
Canada
292
115.1
14.3
8%
Other Nations
222
123.7
19.8
6%
Airlines
86
137.3
26.0
2%
Grand Total
3721
119.1
14.5
100%
USA: (117.6, 13.0g)
Taiwan: (123.0, 14.9g)
Japan: (117.4, 15.6g)
Canada: (115.1, 14.3g)
Other Nations: (123.7, 19.8g)
Airlines – Cross nations: (137.3, 26.0g)
In summary, he had 58% of meals within the USA and 42% in other nations.
By Location (Table 2):
Eating Place
No. Meals
PPG (mg/dL)
Carbs/Sugar (grams)
Place %
Home Cooking
2158
113.8
11.5
59%
Chain Restaurant
450
121.2
11.7
12%
Individual Restaurant
967
127.7
20.6
27%
Supermarket
59
130.2
25.7
2%
Airlines
86
137.3
26.0
2%
Grand Total
3634
121.9
14.8
100%
Home Cooking: (113.8, 11.5g)
Chain Restaurant: (121.2, 11.7g)
Individual Restaurant: (127.7, 20.6g)
Supermarket: (130.3, 25.7g)
Airlines: (137.3, 26.0g)
In summary, he had 59% of meals at home and 41% outside.
Conclusion: The analysis (Table 3 and Figures 1, 2) and predicted PPG model (99.9% accuracy) assisted the author to lower his PPG from 279mg/dL to 119mg/dL.
By Nation
Within Each Nation
No. Meals
PPG (mg/dL)
Carbs/Sugar (grams)
Place %
USA
National Total
2148
117.6
13.0
100%
Home Cooking
1389
113.7
11.3
65%
Chain Restaurant
265
120.1
11.0
12%
Individual Restaurant
453
125.6
18.2
21%
Supermarket
40
132.4
27.1
2%
Taiwan
National Total
679
123
14.9
100%
Home Cooking
355
117.4
11.7
52%
Chain Restaurant
87
124
9.0
13%
Individual Restaurant
237
129.9
22.6
35%
Japan
National Total
294
117.4
15.6
100%
Home Cooking
151
110.7
11.6
51%
Chain Restaurant
64
124.2
17.1
22%
Individual Restaurant
71
133.8
25.4
24%
Supermarket
8
126.1
20.9
3%
Canada
National Total
292
115.1
14.3
100%
Home Cooking
220
110
10.8
75%
Chain Restaurant
17
122.1
19.3
6%
Individual Restaurant
55
129.4
25.8
19%
Other Nations
National Total
222
123.7
19.8
100%
Home Cooking
43
116.2
15.2
19%
Chain Restaurant
17
116.3
15.9
8%
Individual Restaurant
151
127.3
21.6
68%
Supermarket
11
125.1
24.2
5%
Air lines
National Total
86
137.3
26.0
100%
Airline In-flight Food
48
134.2
26.4
56%
Airline Lounge Food
14
150.4
35.3
16%
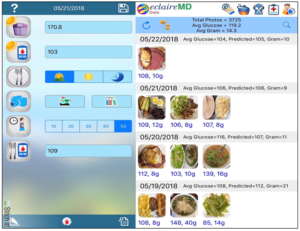
Figure 1: Using AI Glucometer to Predict Glucose Value via Meal Photos.
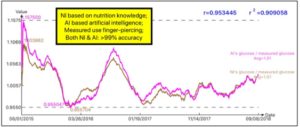
Figure 2: Accuracy Comparison between Nutritional Intelligence (NI) and Artificial Intelligence (AI).