ISSN: 2641-6816
Frequency: Continuous
Format: PDF and HTML
Versions: Online (Open Access)
Year first Published: 2018
Language: English
| Journal Menu |
| Editorial Board |
| Reviewer Board |
| Articles |
| Open Access |
| Special Issue Proposals |
| Guidelines for Authors |
| Guidelines for Editors |
| Guidelines for Reviewers |
| Membership |
| Fee and Guidelines |
 |
Prospective of the Use of Compact/Low Cost Mwir Spectrometer for Food-To-Fuel Assessment
Maria del Sagrario Maldonado Gil1; Pilar Barreiro Elorza1*; Germán Vergara2
1LPF_TAGRALIA, Universidad Politécnica de Madrid, Spain
2NIT technologies
Received Date: April 12, 2021; Accepted Date: April 16, 2021; Published Date: April 27, 2021;
*Corresponding Author: Pilar Barreiro Elorza, Universidad Politécnica de Madrid, Spain. Email: pilar.barreiro@upm.es
Citation: Elorza PB, Vergara G, Maldonado Gil MdS (2021) Prospective of the Use of Compact/Low Cost Mwir Spectrometer for Food-To-Fuel Assessment. Adv in Nutri and Food Sci: ANAFS-207.
DOI: 10.37722/ANAFS.2021201
Abstract
The aim of the present study is to test the feasibility of a compact/low cost MWIR spectrometer in the detection of adulterants in fuels by means of the differentiation between oils and alcohols, and by the other hand, in identifying different kind of edible oils in order to be used for the quality control of oils inside the Food industry.
In this work a set of edible oils together with alcohols were used to assess the ability of a compact and low cost MWIR spectrometer to distinguish between different long-chained alcohols and the fatty acids which compose the vegetable oils.
The results obtained confirm that the compact and low cost MWIR device is able to differentiate between oils and alcoholic compounds and also between long and short chain alcohols by means of chemometrical tools such as a Principal Component and MANOVA analysis.
Keywords: Chemometrics; Fuel and oil adulteration; Middle Infrared spectroscopy
Introduction
Adulteration of automobile fuels i.e. gasoline and diesel is a clandestine and profit oriented operation that leads to increased tailpipe emissions and the consequent illness effects on public health and environment; in addition to damages in the engine. As an example, one of the most usual adulteration in renewable bio fuels such as hydrous ethanol is replacing ethanol by methanol, which is much cheaper but also much more toxic. (Figueiredo et al, 2012). No variations are observed with regards to density or other physical properties of fuels once adulterated. Usually, density remains within the prescribed value. So, for example density test is not a good indicator of diesel adulteration.
Usually, time and reagents consuming techniques are used such as Inductively Couple Plasma Optical Emission Spectrometry (ICP-OES), High Temperature Gas Chromatography (HTGC) and High-Performance Liquid Chromatography (HPLC) at the certificating laboratories of analysis. In contrast, infrared spectroscopy techniques are quick, non-destructive and highly accurate and require little or no pre-treatment of samples (Véras et al. 2011).
By the other hand, regarding to the adulteration of food products, which involves the replacement of high cost ingredients with lower grade and cheaper substitutes (Tay, Singh, Krishnan, and Gore, 2002). Due to its sensory quality and nutritional benefits extra-virgin olive oil is often adulterated with less expensive oils. Actually, blend edible oils can be prepared only for suitable products, but if the resulting blend deviates from the mixture proportions given on the label, or if the blend is traded as genuine, it means the oil is adulterated (Ulberth & Buchgraber, 2000). The edible oils widely employed in virgin olive oil adulteration can be lower quality olive oil (refined or pomace olive oil) or other vegetable or seed oils such as corn, peanut, cottonseed, sunflower, soybean and poppy seed oils (Harwood and Aparicio, 2000). There exist numerous methodologies to detect and quantify vegetable or seed oils in olive oil. Techniques involving application of chromatographic methods are commonly applied (Andrikopoulos, Giannakis, and Tzamtzis, 2001; Christopoulou, Lazaraki, Komaitis, and Kaselimis, 2004; Dionisi, Prodolliet, and Tagliaferri, 1995; Harwood and Aparicio, 2000). There is an increasing demand for the development of new rapid and sensitive methods instead of traditional time-consuming and expensive analysis techniques.
Application of spectroscopy which includes IR techniques combined with chemometric methods is a relatively new approach to determine authenticity of olive oil.
Over the past twenty years the use of the infrared region of the spectrum has grown precipitously for a wide variety of the analytical procedures. Its great development during the last years is tightly linked to the big advances reached in related fields such as chemometrics, computing power and, over all, instrumentation.
MWIR spectroscopy (from 3 to 5 microns) shows a large potential in the current IR devices market, due to its multiple applications (gas detection, chemical analysis, industrial monitoring, combustion and flame characterization, food packaging, etc) and its outstanding performance (good sensitivity, NDT method, velocity of response, among others), opening this technique to very diverse fields of application, such as industrial monitoring and control, agriculture, medicine and environmental monitoring. The need for simpler solutions for analytical measurements has prompted the development of better and more affordable uncooled MWIR detectors, electronics and optics (Linares-Herrero et al., 2013).
In this spectral region several molecular vibration bands exist, such as CH, CH2, CH3, CN, and NCS stretching.
A new MWIR spectrometry device has been developed by the company New Infrared Technologies (Boadilla del Monte, Madrid). This spectrometer is based on a linear array of 128 elements of vapor phase deposited (VPD) PbSe on Silicon, coupled to a linear variable filter (LVF) that works in the spectral range between 3 and 4.6 μm. LVF have been often used in the Near Infrared range (NIR), but the use of a LVF in the Middle Infrared is the novelty presented by this device. This spectrometer, with no moving parts, can be considered a rugged, compact and affordable device.
The new MWIR spectrometer is about a low-cost uncooled MWIR readout module with USB output system, based in microcontroller ARM M3 CORTEX architecture for linear LUXELL FPA (64, 128 and 256 px). In this study, the 128 pixels type was used. The module includes a LUXELL FPA and its band of detection goes from 1 to 5 microns without the LVF. Its peak wavelength of detection is 3.7 microns. The integration time goes from 4 to 20 μs and it is selectable by the user. The frame rate is of 300 frames per second (http://www.niteurope.com/luxell-fpa/).
The figure 1 shows the linear array covered with the LVF (left) and the camera formed by the detector assembled to its 44.8 x 80 mm size metal housing and the optics (right).
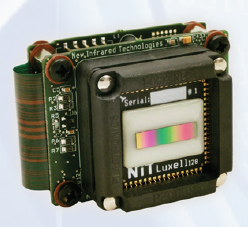

Figure 1: (Left) LUXEL non refrigerated FPA covered by the LVF and assembled to the module. (Right) Camera formed by the module inside the metal housing and the optics of 35 mm.
Nevertheless the narrow wavelength range (3-4.6 microns) and the 60 nm spectral resolution imposed by the LVF suppose a limitation regarding to spectrometer performance. This is the reason why it becomes necessary to use Chemometrics as a complementary tool to analyze chemical species.
Materials And Methods
Samples and experimental set up
Three replicates and three repetitions of each sample (8 edible oils brands x 3 replicates x 3 repetitions = 72 individuals, and 5 alcohols x 3 replicates x 3 repetitions = 45 individuals) were tested with the compact MWIR spectrometer (in total 117 spectra with 128 channels, being one channel an spectral band between 3 and 4.6 microns, with an over 60 nm width).
The set of edible oils consisted of 7 brands from different origins: sunflower, corn, soy, sesame and extra virgin olive oil from three different brands too. They were acquired from local supermarkets.
The alcohols methanol, ethanol, propanol, n-butanol and n-hexanol were bought as laboratory reagents of analysis grade from Panreac® (Barcelona, Spain).
Gasoline samples were taken from commercial fuels for agricultural machinery.
The experimental device consisted on the sensor LUXELL FPA described in the introduction part. Its LVF goes from 2.5 to 4.95 microns, and is connected by an USB 2.0 to a software package NIT SOFTWARE SUITE (Acquisition and visualization SW).
The source of the spectroscopy device was an infrared lamp made of a SiC and a parabolic reflector. The acquisition was done in base frequency mode. The sample was put in the IR light path inside two sapphire wafers.
The oils and alcohols samples were prepared using a Pasteur pipette and spotting a single drop over one of the sapphire wafers used as sample holder and then closing with the other wafer like a “sandwich”. Special care was taken for uniformly sample spreading through the whole surface of the sapphire.
Measurements
The empty sapphire wafers were recorded by the acquisition software during a few seconds for using them as a blank reference.
After that, one single drop of each kind of pure oil was put between the wafers, spread well and then recorded for 1 minute. The same procedure was carried out with the pure alcohols.
The mixtures of oils and ethanol were not tested in this study.
Mathematical analysis
For the mathematical analysis, MATLAB® and Microsoft Office EXCEL were used together with the software package NIT SOFTWARE SUITE®. The first step consisted on the reduction of dimension for the identification of relevant differences according to the chemical species (oil and alcohol) and type (chain length and complexity of the oil mixture) by means of the Principal Component Analysis. Furthermore, MANOVA analysis has been accomplished by addressing the discrimination ability based on the MWIR spectra on liquid samples.
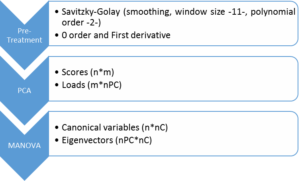
Figure 2: Graphical scheme of the steps followed in the mathematical analysis carried out. The first main step is the pre treatment of the row spectra, by means of a Savitzky-Golay smoothing algorithm. The parameters used for this treatment were a window size of 11 and the curves were fitted to an order 2 polynomial; followed by the first derivative of the spectra.
The second step was the Principal Component Analysis in order to reduce the variable space dimensions, from which a scores matrix of n individuals x m wavelengths was obtained; and a loads matrix with m individuals x nPC principal components.
And by the last the MANOVA analysis was performed, obtaining the canonical variables matrix (n individuals x nC canonical variables) and the eigenvectors matrix (nPC principal components x nC canonical variables).
Principal component analysis
Principal component is a multivariate technique that allows dimensionality decrease without information reduction by means of diagonalization of data variance. Thus several linear combinations of spectral variables are generated with decreasing information weight, while providing non-linear relationship among them. The new variables also called Principal Components retain the spectral variance though they may or may not refer to the information that is required to segregate populations. In cases where the main variance in the data corresponds to the differences in search, this procedure will be sufficient to easily identify the species of interest.
MANOVA analysis
Discriminant analysis is used when two or more groups or clusters or populations are known a priori and one or more new observations are classified into one of the known populations based on the measured characteristics. One-way multivariate analysis of variance (MANOVA) is used to determine whether there are any differences between independent groups on more than one continuous dependent variable by mean of the diagonalization of Wilks lambda matrix. Wilks’ lambda is a test statistic used in multivariate analysis of variance (MANOVA) to evaluate whether there are differences between the means of identified groups of subjects on a combination of dependent variables. In this a linear combination of variables is created that retain the segregation ability instead of data variance. MANOVA is compute preferably in a reasonable amount of independent variables, and thus in the case of NIR it is convenient to apply PCA in advance.
The contribution of the original wavelengths to the canonical variables, can be computed as X (row data matrix)*L (loads matrix) *EV (eigenvectors matrix).
Results And Discussion
After the acquired spectra were pre processed and mathematically analyzed by means of the tools described above (PCA and MANOVA techniques) the results obtained from the PCA which were the main groups, and the results obtained from MANOVA which were the main different classes are described below.
Principal component analysis
(Figure 3) presents the projection of the spectra (n=117): alcohols in blue (45), and oils in red (72), onto three principal component planes: PC1-PC2; PC1-PC3, and PC2-PC3. PC1, PC2 and PC3 respectively refer to 75, 18, and 7 % of data variance. In all three planes a general separation of oils and alcohols can be found, however some of the oil samples (sunflower and sesame ones) appear mixed with alcohols in plane PC1-PC2, some other oils samples appear mixed with alcohols in PC1-PC3 (sunflower, sesame and one of the high quality AOVE) and also several oil individuals (the two AOVE, sesame and corn oils) mix up with oils in plane PC2-PC3. The information retained in PC3-PC2 is not so clearly related with nature of the substance, yet it is of certain relevance (24.4 % of data variance).

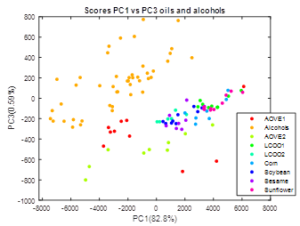
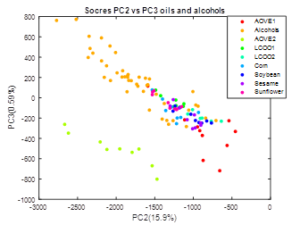
Figure 3. Scatter-plot representation of the scores: AOVE1, AOVE2 = Extra Virgin olive oils (Brand 1 and brand 2); LCOO1, LCOO2= Low cost olive oils (Brand 1 and brand 2); Corn, Soybean, Sesame and Sunflower oils. Up left: PC1 against PC2. This plane retains the most of the variance (98.7%). The segregation is clear between alcohols and oils even when some oils (AOVE2) could be confused with alcohols. Up right: PC1 against PC3. This plane retains less information but is still one of the highest (83.4%). This one also shows a clear segregation between alcohols and vegetable oils, and in this case, no oils can be confused with alcohols. Down: PC3 against PC2.This plane retains the less information (16.5%). These two principal components also give separation between species but not so clear as the other planes, as many samples appear mixed up with the alcohols, excepting the AOVE2. Nevertheless, a clear linear trend is observed in this plane. The samples have a trend to go from negative to positive values of the PC3 scores. Most of the alcohols have a positive value of PC3 while oils have a negative one. AOVE1 and AOVE2 are the oils which have a more negative value of PC3.
MANOVA analysys
(Figure 4) presents the results of MANOVA for the segregation of alcohols and oils. Only the first canonical variable is required for segregation since there are only two categories (100 % of Wilks-lambda retained). Oils present negative canonical values in variable 1, while alcohols show positive ones. Compared to PCA, both groups appear very distant with no overlapping of individuals. This is in accordance with this procedure being a supervised analysis compared the unsupervised nature of PCA. In addition to the nature of the substances (oil or alcohol), a vertical distribution of data is found in both groups, which points to the existence of further sources of variation that are not a priori identified.
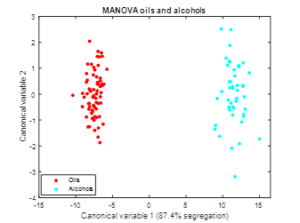
Figure 4. Graphical scattering representation of the 1-way-MANOVA analysis made to the whole data set. The red points (1) and the blue points (2) correspond to the oil and alcohol samples respectively.
For this MANOVA, 10 of the 117 PCs have been used corresponding to 99.9951% of spectral variance. Figure 5 presents the eigenvectors (weight of each PC in the definition of the canonical variable). The absolute value of the eigenvector increases for increasing number of PC as expected, since the amount of information retained by the large PC numbers is very low.
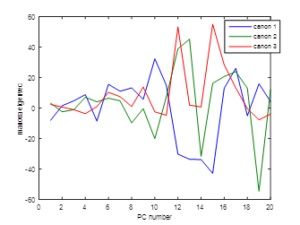
Figure 5. Weight of each principal component contribution to their MANOVA eigenvectors regarding the information given by the canonical variables (canon1 = canonical variable 1, canon 2 = canonical variable 2, canon 3 =canonical variable 3).
The second step in the analysis is the segregation among oils: AVOVE (high quality olive oil from very different varietal origin), LCOO (low cost olive oil), others vegetable oils (sunflower, corn, soybean, and sesame). To this end a new MANOVA is performed on the PC scores based on the previous identification. A main feature from this plot is that both AOVE (first canonical variable >0) can be easily segregated from the rest (C1<0). Moreover, the position of the two LCOO samples suggests adulteration by other vegetable oils that are proximal in the canonical plane (sunflower, and soybean respectively). This fact is confirmed when representing the second and forth canonical variables, since it is feasible to segregate among two large groups: A (sunflower, corn, LCOO1, AOVE2) and B (AOVE1, LCOO2, soybean, sesame).
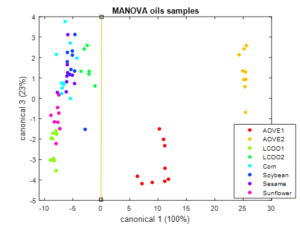
 Figure 6. Graphical scattering representation of the 1-way-MANOVA analysis made to the oils data set, using the canonical variables. The legend displays the different types of oils classified in the analysis.
Figure 7 shows the results of a third MANOVA carried out on alcohols: methanol, ethanol, propanol, n-butanol and n-hexanol. As a main feature, it results feasible to segregate among methanol, ethanol and the longer chained alcohols (propanol, n-butanol and n-hexanol). In order to segregate between the intermediate classes (pronaol, n-butanol and n-hexanol), the plane represented by canonical variables 1 and 3 provides the required segregation power.

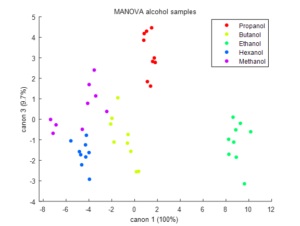
Figure 7: Graphical scattering of the 1-way-MANOVA analysis made to the alcohols data set using the canonical variables: C1 agaist C2 and C1 against C3. The legend shows the alcohol names initials (P = 1-propanol, b = n-butanol, e= ethanol, h =n-hexanol and m = methanol).

Figure 8 summarizes the above mentioned hierarchical segregation procedure, and Table 1 includes the segregation functions.
Figure 8: Mathematical hierarchical segregation procedure carried out from the row spectra to the end classification which predicts potential sources of adulteration between oils, and distinguishes between different chain lengths of alcohols.
| MATHEMATICAL ANALYSIS | FUNCTION (canonical variable value) | INFORMATION PROPORTIONED |
| Global MANOVA | C1>0
C1<0 |
Alcohol
Oil |
| Oil MANOVA | C1>2
C1<2 |
AOVE
Rest of the vegetable oils |
| Oil MANOVA | 0.7*C2-6 | Probable adulteration with A (sunflower, corn, LCOO1, AOVE2 ) |
| Probable adulteration with B (AOVE1, LCOO2, soybean, sesame) | ||
| Alcohol MANOVA | C2>0
C2<0 |
Ethanol and methanol
Propanol, n-butanol and n-hexanol |
| Alcohol MANOVA | 0.5*C1 | Propanol and ethanol |
| Methanol, n-butanol and n-hexanol |
Conclusions
The work carried out in this publication shows the ability of a compact and low cost MWIR uncooled spectrometer to difference between oils and alcohols first, and also among different kinds of oils and alcohols too. The advantage given by this device is its compactness and easy set up, versus other laboratory analytical techniques based on chemical separations such as mass spectrometry or chromatography, which usually result in more accurate results, but also have an extra-cost of reagents (fundamentally the patron substances, which use to be very expensive) and time consuming, in addition to the chemical pre treatment and destruction of the samples. Nevertheless, the resolution is not as good as other devices; that is the reason why this technique must be strongly supported by mathematical chemometrics tools.
So on, this technique goes on research and development by implementing new mathematical tools for the results post processing, the research of complementary software and the implementing of new algorithms for signal processing in the acquisition software.
Bibliography
- Silva AC, Lira Pontes LFB, Pimentel MF, Coelho Pontes MJ (2012) Detection of adulteration in hydrated ethyl alcohol fuel using infrared spectroscopy and supervised pattern recognition methods. Talanta 93:129-134.
- Sousa Fernandes DD, Adriano AG, Bezerra da Costac G, da Silva Gildo William B, Véras G (2011) Determination of biodiesel content in biodiesel/diesel blends using NIR and visible spectroscopy with variable selection. Talanta 87:30-34.
- Dupuy N, Duponchel L, Huvenne JP, Sombret B, Legrand P (1996) Classification of edible fats and oils by principal component analysis of Fourier transform infrared spectra. Food Chemistry 57:245-251.
- Figueiredo Monique KK, Costa-Felix Rodrigo PB, Maggi Luis E, Alvarenga André V, Romeiro GA (2012) Biofuel ethanol adulteration detection using an ultrasonic measurement method. Fuel 91:209-212.
- Guillén MD, Cabo N (2002) Fourier transform infrared spectra data versus peroxide and anisidine values to determine oxidative stability of edible oils. Food Chemistry 77:503-510.
- Lê Thành K, Commandré JM, Valette J, Volle G, Meyer M (2015) Detailed identification and quantification of the condensable species released during torrefaction of lignocellulosic biomasses. Fuel Processing Technology. 139:226-235.
- Linares R, Montojo MT, Baldasano A (2010) [VPD PbSe technology: the road towards the industrial maturity], Infrared Technology and Applications XXXVI, Proc. of SPIE 7660.
- Linares-Herrero, Vergara G, Gutiérrez-Álvarez R, Fernández-Montojo C, Gómez LJ, et al. Variable filter array spectrometer of VPD PbSe.
- José Coelho Pontes M (2012) Detection of adulteration in hydrated ethyl alcohol fuel using infrared spectroscopy and supervised pattern recognition methods. Talanta 93:129-134.
- Mishra P, Cordella Christophe BY, Rutledge Douglas N, Barreiro P, Roger JM et al. (2016) Application of independent components analysis with the JADE algorithm and NIR hyperspectral imaging for revealing food adulteration. Journal of Food Engineering 168:7-15.
- Romeiro Gilberto A (2012) Biofuel ethanol adulteration detection using an ultrasonic measurement method. Fuel. 91:209-212.
- Sharma RK, Wooten Jan B, Baliga VL, Xuehao L, Geoffrey Chan W et al. (2004) Characterization of chars from pyrolysis of lignin. Fuel 83:1469-1482.
- Sipilä K, Kuoppala E, Fagernäs L, Oasmaa A (1998) Characterization of biomass-based flash pyrolysis oils. Biomass and Bioenergy. 14:103-113.
- Yadav SR, Murthy VK, Mishra D, Baral B (2005) Estimation of petrol and diesel adulteration with kerosene and assessment of usefulness of selected automobile fuel quality test parameters. International Journal of Environmental Science & Technology, 1:253-255.
- Yong S Choi, Patrick A Johnston, Robert C Brown, Brent H Shanks, Kyong-Hwan Lee (2014) Detailed characterization of red oak-derived pyrolysis oil: Integrateduse of GC, HPLC, IC, GPC and Karl-Fischer. Journal of Analytical and Applied Pyrolysis 110:147-154.
