Publication Information
ISSN: 2641-6859
Frequency: Continuous
Format: PDF and HTML
Versions: Online (Open Access)
Year first Published: 2018
Language: English
| Journal Menu |
| Editorial Board |
| Reviewer Board |
| Articles |
| Open Access |
| Special Issue Proposals |
| Guidelines for Authors |
| Guidelines for Editors |
| Guidelines for Reviewers |
| Membership |
| Fee and Guidelines |
 |
Presenting a Performance Assessment Protocol and Full Body OpenSim Model for use in Identifying Risk of Injury
Craig M. Goehler1*, Kelly Helm2, Luis Prato3, Anthony Levenda4
1Department of Mechanical Engineering and Bioengineering, Valparaiso University, Valparaiso, IN, USA
2Department of Kinesiology, Valparaiso University, Valparaiso, IN, USA
3Incremedical, Portage, IN, USA
4Lakeshore Bone and Joint Institute, Chesterton, IN, USA
Received Date: October 15, 2019; Accepted Date: October 23, 2019; Published Date: October 30, 2019
*Corresponding author: Craig M. Goehler, Department of Mechanical Engineering and Bioengineering, Valparaiso University, Valparaiso, IN, USA. Tel: +12194646811; Email: craig.goehler@valpo.edu
Citation: Goehler CM, Helm K, Prato L, Levenda A (2019) Presenting a Performance Assessment Protocol and Full Body OpenSim Model for use in Identifying Risk of Injury. Adv Ortho and Sprts Med: AOASM-115.
Abstract
The motivation for this project is the development of quantitative means of assessing human functional movement to be used to inform training protocols, reduce risk of injury, and to enhance performance. The purpose of this article is to describe the methods used in developing such statistical metrics. The full assessment protocol is presented along with a generic full body musculoskeletal model developed in OpenSim. Thirty-nine Division I NCAA student athletes (22 male, 17 female) participated in three rounds of data acquisition sessions. Initial kinematic metrics developed for in-line lunge and deep squat show a range of acceptable values correlating with the ability to perform the assessed movements.
Keywords: Functional Movement Screen; Injury Assessment; Landing Error Scoring System; Musculoskeletal Modelling
Introduction
Athlete safety throughout various sporting environments has been a topic of increasing interest and consequently has been widely discussed and researched. While the bulk of this research has focused on concussion prevention and impact related injuries, overuse and strain injuries actually represent the most common sports related injuries [1]. Many overuse and strain injuries are due to incorrect biomechanics, improper conditioning and stretching, and fatigue [2, 3]. In an attempt to assist with these injuries, Functional Movement Screening (FMS) was developed to gather objective data of human movement patterns with respect to functional performance and injury prevention [2-4]. FMS uses comprehensive functional movements and core stability to establish an individual’s functional platform. FMS includes a series of seven tests: deep squat, hurdle step, in-line lunge, shoulder mobility, active straight leg raise, push-ups, and rotary stability. Each test is scored on a 0-3 scale with a maximum combined score of 21 where 3 represents movement completion as instructed free of compensation and pain, 2 represents movement completion pain free but with some compensation, 1 represents the inability to complete the movement as instructed, and 0 is assigned when the subject has pain with the movement. Multiple studies have examined the correlation between FMS scores and risk of injury at both the college and professional levels of athletics [5-7]. Statistics indicate that individuals at both levels scoring less than 14 during preseason assessment had a higher risk of injury throughout the season [6, 7]. Additionally, those individuals who scored greater than 15 exhibited an increase in performance ability throughout the season [5]. The FMS scores have also been used to inform off-season strength and conditioning programs at the professional level [8]. These programs differed for each subject based on individual FMS performances and were shown to result in improved FMS scores the following season. These results demonstrate that training programs based on the FMS assessments can lead to a decreased risk of injury over time.
An additional assessment tool for knee related injuries, specifically those related to the ACL, is the Landing Error Scoring System (LESS) [9, 10]. The test consists of both vertical and horizontal movements as the participant jumps from a one foot high plyometric box to a distance of 50% of their height away from the box and then immediately jumps as high as they can vertically. This test is typically scored by a physical therapist based on various qualitative criteria, similar to the FMS. The LESS differs from the FMS in that lower scores correspond to good performances with higher scores representing poor jump mechanics. Data indicates that changes over time in an athlete’s LESS score can be used to estimate a reduction in the risk of an ACL injury.
While the FMS and LESS represent relatively quick and effective assessment methods for identifying risk of injury, the qualitative nature of these tools can lead to difficulties in identifying specific injury risks and in determining subject-specific preventative or corrective measures. For example, two subjects might both receive a 2 on one of the FMS tests but have completely unique forms of compensation due to different individual joint mechanics potentially indicating varying levels or types of injury risks. Task-specific statistical metrics based on the quantitative analysis of these tools can lead to more informed assessment of risk of injury, lead to more effective training protocols, and better inform the individual on improving performance over time. Previous work on individual tasks aimed at quantifying these qualitative tools has been completed by various groups. Butler et al. performed a biomechanical analysis of the deep squat, specifically examining differences in the sagittal plane joint angles across three different groups based on varying scores of the FMS task (either 1, 2, or 3) [11]. Their results demonstrated that individuals who received different FMS scores exhibited varying joint mechanics. The authors concluded that these joint angle differences could lead to more effective intervention strategies. Frost et al. studied the effects of two different intervention programs on FMS scores through changes in spine flexion/extension, lateral bend, axial twist and the positions of the left and right knee joint centres [12]. The authors demonstrated that the statistically observed post-training changes in spine and frontal plane knee motions were not reflected in FMS task performance. It was hypothesized that the FMS tasks alone may not be sufficient to capture personal characteristics or movement patterns for the purpose of designed personalized training programs which suggests that additional tasks such as the LESS or other jump tests may be needed to clarify potential risks of injury. Mizner et al. performed a comparison of two dimensional and three dimensional measurement techniques for predicting knee angle during a drop vertical jump (similar to the first portion of the LESS test) [13]. While the majority of the results were used to validate 2D video-based techniques using the “gold standard” of passive reflective marker-based 3D motion capture, the authors interestingly noted that their results could not be used in determining ACL injury risk. Rather, they concluded that large studies that apply similar techniques and actively track ACL injuries are needed to fill this knowledge gap. Therefore, creating these task-specific statistical metrics is only half of the solution and a component that tracks injuries is needed in order to support the relevance of the data to risk of injury.
This article seeks to establish the assessment protocol currently being implemented by the Valparaiso University Human Movement Research Laboratory (HMRL) to develop a set of statistical metrics for use in assessing risk of injury. This protocol primarily focuses on overuse injuries in the lower extremities. Additionally, this article will introduce the full body musculoskeletal model developed in OpenSim used to determine the individual joint mechanics through subject-specific inverse kinematic simulations. Three rounds of completed assessments will be discussed from data acquisition through musculoskeletal simulations and statistical analysis. Initial metrics for the in-line lunge and deep squat will be presented along with examples of how such metrics can be used moving forward.
Methods
Development of Assessment Protocol
The main goal of the HMRL is to utilize quantitative techniques to collect human movement data that will be used to inform training protocols that will result in a reduced risk of injury and increased performance. After several preliminary sessions with different equipment configurations and after studying a variety of screening tests, the assessment protocol was finalized and approved by the Valparaiso University Institutional Review Board (IRB) as follows [14-22]:
- Procedure explanation and signing of informed consent.
- Pre-screening: hurdle step, deep squat, in-line lunge, shoulder mobility.
- FMS tests: hurdle step (right and left leg), deep squat, in-line lunge (right and left leg).
- Jump tests: single leg hop (right and left leg), box jump, LESS.
The order of the movements performed in Steps 3 and 4 was determined based on minimizing the overall time of the complete assessment, maximizing the efficiency of moving testing equipment into and out of the recording volume, and minimizing the chance for fatigue throughout the assessment. Steps 1 and 2 of the protocol are completed prior to attaching the passive reflective markers and surface electromyogram (sEMG) electrodes for the recorded sessions in order to determine if the subject is capable of completing the tasks without pain and with minimal risk of injury.
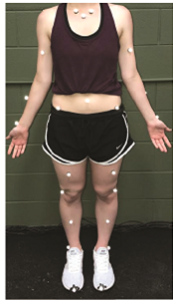
After the subject completed the pre-screening trials without experiencing any pain, they were affixed with 28 passive reflective markers via hypoallergenic double-sided tape (shown in Figure 1A): 2 on the torso, 6 on each upper extremity, and 7 on each lower extremity. Then 16 DelsysTrigno Wireless sEMG electrodes were attached to the lower extremities of the subject via hypoallergenic double-sided tape: 8 on each leg isolating the excitation signals of the gluteus maximus, gluteus medius, rectus femoris, vastuslateralis, vastusmedialis, biceps femoris, and the lateral and medial heads of the gastrocnemius muscles. A static trial of the subject standing with all markers in view was recorded to be used for scaling purposes during data analysis. Subjects were instructed on how to perform each of the desired assessment tasks. Each subject performed three trials of each task. During each trial, the subject was qualitatively scored on their performance, three-dimensional positioning of each reflective marker was recorded using the VICON Nexus software (shown in Figure 1B), muscle activity was recorded using the DelsysEMG Works Acquisition software, and live video was recorded using off the shelf cameras to be used for any future qualitative referencing or comparisons. If the subject reported any pain or trouble completing the exercise, their results were not included in the final metric and the subject was recommended to seek medical attention as a precaution. The successful tasks were added to a growing library of data with which a quantified metric of healthy athletes can be created.
 (A)
(A) 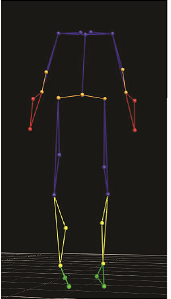 (B)
(B) 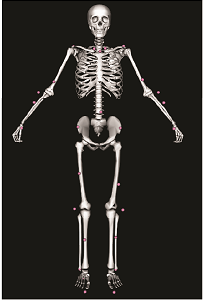 (C)
(C)
Figure 1: Placement of 28 passive reflective markers: (A) on the human subject, (B) in VICON Nexus, and (C) in OpenSim.
Kinematic Model
Full body joint kinematics were analyzed using a custom musculoskeletal model developed by the HMRL in OpenSim. OpenSim is a freely available, open-source software platform developed by the SimTK group out of Stanford University [23]. The software is used to model, simulate, and analyse complex musculoskeletal systems in a virtual environment. The SimTK group worked diligently to ensure that the software remains easy to use for researchers of all backgrounds and education levels. This combination of availability and accessibility makes OpenSim an ideal tool for studying musculoskeletal problems across a variety of disciplines.
The generic full body kinematic model (shown in Figure 1C) was constructed in OpenSim using modified versions of existing models [23-25]. The model for the torso originated in the gait2354_simbody.osim model provided in the Models folder in OpenSim version 3.1 [23, 24]. Only minor changes to the degrees of freedom between the ground and the model were made to the existing model. The lower extremity models were modified from the Both Legs.osim model which was also provided in the Models folder in OpenSim version 3.1 [23, 24]. All muscles were removed and any associated body that did not directly contribute to joint kinematics was also removed, including the patella, in order to minimize the constraints that were enforced during inverse kinematic simulations. The joint angle limits were also modified to account for more flexible subjects. The right upper extremity model was based on the MoBL_ARMS.osim model developed in OpenSim version 2.4 [25]. Similar to the lower extremity model, all muscles were removed and any associated body or moving muscle point that did not directly contribute to joint kinematics was removed which resulted in even fewer constraints to enforce during simulations. The left upper extremity model was created by mirroring the right upper extremity model across the sagittal plane. This complete full body model was updated to work in OpenSim version 3.3.0.
The collected data files containing the three-dimensional positioning of each marker throughout each trial were processed, filtered, exported and converted to ensure compatibility with OpenSim. For each subject, the generic full body model was scaled using the static trial. The Inverse Kinematics Tool calculated the complete set of joint angles using the subject-specific model for each trial of each movement. These simulation results were exported for further statistical analysis.
Data Analysis
Each of the assessed movements requires a unique set of metrics based on the potential injuries that can be inferred from that specific task. The initial metric development presented in this article is based on the joint mechanics determined from the motion capture data and OpenSim inverse kinematic simulations. The sEMG data will be analyzed in future studies and correlated with the joint mechanic metrics.
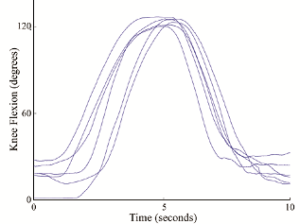
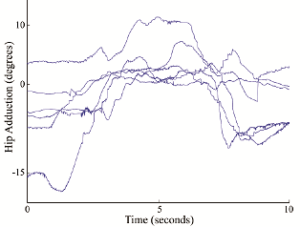
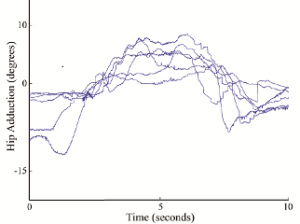
The complete set of joint angle metrics for a given task are sorted into two different subcategories that can be used to evaluate risk of injury: metrics that provide a quantitative measure for the successful completion of that motion, and metrics that outline an acceptable level of compensation to complete the motion. In order to identify which statistical measures (i.e. maximum, minimum, average, standard deviation, range, etc…) are the primary components of interest required to place each joint angle into one of the metric subcategories, plots of individual degrees of freedom were generated for each specific motion that included trials from multiple subjects. This process is illustrated for two different joint angles in Figure 2. Knee flexion and extension (shown in Figure 2A as an absolute degree of freedom in the sagittal plane) can be seen to start at different points for each subject based on anatomical differences, but each subject follows a similar trend when flexing the knee during the in-line lunge and attains a similar maximum flexion value. This led the authors to conclude that the maximum absolute value of knee flexion/extension would be a valuable metric for the in-line lunge. Hip abduction and adduction (shown in Figure 2B) as an absolute degree of freedom in a non-sagittal plane) does not appear to share any similarities across subjects. However, when each trial is centred about the trial mean (shown in Figure 2C) as a relative degree of freedom in a non-sagittal plane) each subject can be observed moving through a similar range of joint angles with a similar variation from the mean value. This led the authors to conclude that the range and standard deviation of hip abduction/adduction would be a valuable metric for the in-line lunge. A similar process was performed for each degree of freedom across the various assessment tasks.
For in-line lunges and deep squats, successful completion of the motion is dictated by the maximum absolute values of the sagittal degrees of freedom: hip flexion/extension, knee flexion/extension, and ankle flexion/extension. The non-sagittal degrees of freedom, such as lumbar extension and hip abduction/adduction, illustrate the level of compensation required to complete the motion. For these joint angles, each subject might start the motion in a different absolute position based on anatomical differences in order to maintain balance. Therefore, the two statistical components of interest are relative entities: the joint angle range and the joint angle standard deviation. The range represents the largest change in each joint angle with larger values suggesting a potential loss of balance. The standard deviation represents how much each joint angle varies throughout the motion with larger values suggesting larger continuous compensation. Smaller values of both range and standard deviation identify the subject’s ability to complete the motion while maintaining consistent balance.
Previous work completed in the HMRL showed no statistically significant differences between the joint angle statistics across genders and the different sports, and these values can therefore be combined into a single set of metrics [17, 20, 21]. Additionally, healthy athletes should demonstrate limb symmetry when completing the various assessment tasks. As such, it would make sense to combine the selected joint angle statistics across the lower extremities where appropriate. Statistical tests were also completed to verify that limb symmetry could be incorporated into the metrics [17, 19-22]. For deep squats, each joint angle statistic for the left lower extremity was combined with the corresponding value for the right lower extremity. For in-line lunges, the joint angle statistics for the front leg (left leg for left lunge and right leg for right lunge) were combined, and the values for the back leg (right leg for left lunge and left leg for right lunge) were also combined. The results presented in this article represent a single set of statistical metrics that can be utilized for assessing either leg, any gender, or any sport.
(A) (B)
 (C)
(C)
Figure 2: Sample plots comparing multiple subjects performing the in-line lunge: (A) knee flexion/extension, (B) hip abduction/adduction, and (C) hip abduction/adduction centered about trial mean.
Subjects
The initial metrics presented in this article use data collected in the HMRL from the first three years of the study using the presented assessment protocol. In order to maximize subject availability, Division I NCAA student athletes were recruited from various teams whose respective off-seasons aligned with the scheduled data acquisition sessions. Potential subjects were excluded from participating in the study if they were not healthy at the time of the session, they had a history of significant lower extremity injury, or if they experienced any pain during the pre-screening session. The first round of assessments occurred during September, October, and November 2015 and included 16 subjects from the Valparaiso University Swim Team (10 male, 6 female) ranging from 18 to 22 years of age. The second round of assessments occurred during September and October 2016 and included 10 subjects from the Valparaiso University Tennis Team (2 male, 8 female) ranging from 18 to 22 years of age. The third round of assessments occurred during September and October 2017 and included 13 subjects from the Valparaiso University Track Team (10 male, 3 female) ranging from 18 to 22 years of age. Informed consent forms approved by the Valparaiso University IRB were signed by each subject prior to participation in the study.
Results and Discussion
The initial set of metrics for the in-line lunge are shown in Table 1 and the initial set of metrics for the deep squat are shown in Table 2. Each metric represents a range of acceptable values based on the data collected from healthy male and female athletes across all three sports that received FMS scores of 2 or 3 (successful completion of the task with little or no compensation). Individual statistical values that fall outside these metrics will constitute a warning to the researcher/trainer/medical provider. Such warnings will assist in developing training protocols specific to that athlete aimed at minimizing risk of injury across that specific joint.
Two examples of athletes that received FMS scores of 1 (failure to adequately complete task) while attempting the deep squat are presented in Table 2. Note that statistical values that indicate warnings due to falling outside the acceptable ranges are shaded grey in the table while statistical values that are lower than the compensatory degree of freedom metrics (suggesting even less compensation which is good) are denoted with asterisks. While both subjects received the same qualitative score, the statistical data highlights that each individual failed for different reasons. Subject a fell outside the acceptable ranges for hip flexion/extension, knee flexion/extension, and ankle flexion/extension for both legs. Interestingly, Subject A demonstrated lower statistical values across a number of the compensatory degrees of freedom most likely due to the lack of ability to successfully complete the task. Due to these results, a trainer might work with Subject A on improving flexibility, strength, and control across all three joints of the lower extremity for both legs. Conversely, Subject B fell outside the acceptable ranges for only hip flexion/extension for both legs and standard deviation of hip abduction/adduction for the left leg. Subject B also demonstrated lower statistical values for some of the compensatory degrees of freedom. These different results suggest that a trainer might work with Subject B on improving flexibility, strength, and control only at the hip joints for both legs.
This article introduced the assessment protocol currently being implemented by the Valparaiso University HMRL to develop a set of statistical metrics for use in assessing risk of injury along with the full body musculoskeletal model developed in OpenSim used to determine the individual joint mechanics through subject-specific inverse kinematic simulations. Initial metrics for the in-line lunge and deep squat were presented along with examples of how such metrics can be utilized. While the use of these initial metrics is limited to a very specific subject population of Division I NCAA student athletes, the results are promising and suggest that the presented protocol can be applied to a variety of subject populations to develop similar injury assessment metrics. (FMS 1) (FMS 1)
Successful Completion Of Motion
Front Leg
Back Leg
Hip Flexion/Extension
Max
80.5 – 100.0
-5.9 – 17.1
Knee Flexion/Extension
Max
119.5 – 127.7
103.4 – 118.0
Ankle Flexion/Extension
Max
32.4 – 44.6
47.2 – 56.4
Level of Compensation Required to Complete Motion
Lumbar Extension
Range
9.2 – 22.1
StDev
2.6 – 7.2
Lumbar Bending
Range
6.1 – 17.4
StDev
1.4 – 5.3
Lumbar Rotation
Range
3.5 – 14.3
StDev
0.8 – 4.3
Front Leg
Back Leg
Hip Abduction/Adduction
Range
7.7 – 19.5
5.4 – 19.2
StDev
1.7 – 6.2
0.8 – 6.3
Hip Rotation
Range
9.5 – 18.6
6.1 – 16.1
StDev
2.5 – 6.0
1.3 – 4.9
Subtalar Ankle Angle
Range
11.7 – 23.3
5.7 – 20.5
StDev
2.9 – 7.4
1.0 – 6.7
Successful Completion of Motion
SUBJECT A
SUBJECT B
METRIC
Left Leg
Right Leg
Left Leg
Right Leg
Hip Flexion/Extension
Max
91.1 – 117.4
81.235
80.900
67.723
61.392
Knee Flexion/Extension
Max
114.3 – 143.8
95.858
97.969
123.51
116.597
Ankle Flexion/Extension
Max
39.6 – 51.6
37.517
38.895
48.857
49.428
LEVEL OF COMPENSATION REQUIRED TO COMPLETE MOTION
Lumbar Extension
Range
21.0 – 64.9
23.464
28.162
StDev
5.3 – 19.9
7.075
9.447
Lumber Bending
Range
4.2 – 21.3
4.736
9.310
StDev
0.9 – 5.2
1.044
1.677
Lumber Rotation
Range
4.9 – 24.4
3.469*
7.942
StDev
0.7 – 7.2
0.808
1.536
Left Leg
Right Leg
Left Leg
Right Leg
Hip Abduction/Adduction
Range
11.6 – 26.7
10.87*
6.150*
24.143
18.229
StDev
3.2 – 8.7
2.694*
1.344*
9.705
3.684
Hip Rotation
Range
20.1 – 37.2
20.323
13.811*
26.161
11.424*
StDev
5.9 – 13.7
6.857
4.250*
8.055
4.062*
Subtalar Ankle Angle
Range
9.7 – 23.0
18.163
9.301*
9.583*
13.542
StDev
1.7 – 7.4
5.143
2.761
3.630
2.942
Conflict of Interest Disclosure: We have no conflict of interests to disclose and the manuscript has been read and approved by all named authors.
Acknowledgements
The authors would like to acknowledge all of the undergraduate research students for their assistance in collecting and analyzing the data over the past several years, specifically Eric Honert (BSME 2014), Lauren Knop (BSME 2015), Alexander Kozlowski (BSME 2016), Rebekah Koehn (BSME 2017), and Sarah Griffin (BSBE 2020) for their contributions to the protocol development and their tireless dedication to the project.
References
- DiFiori JP, Benjamin HJ, Brenner JS, Gregory A, Jayanthi N. et al. (2014) Overuse injuries and burnout in youth sports: a position statement from the American Medical Society for Sports Medicine. British Journal of Sports Medicine 48: 287-301.
- Cook G, Burton L, Hoogenboom B (2006) Pre-Participation Screening: The Use of Fundamental Movements as an Assessment of Function – Part 1. North American Journal of Sports Physical Therapy 1: 62-72.
- Cook G, Burton L, Hoogenboom B (2006) Pre-Participation Screening: The Use of Fundamental Movements as an Assessment of Function – Part 2.North American Journal of Sports Physical Therapy 1: 132-139.
- Cook G, Burton L, Fields K, Kiesel K (1998) The functional movement screen. Danville, VA: Athletic Testing Services, Inc.
- Budnar RG, Birdwell R, Moody C, Hill DW, Duplanty AA (2013) Functional Movement Screen Scores in Collegiate Track and Field Athletes in Relation to Injury Risk and Performance. International Journal of Exercise Science: Conference Proceedings, 2(5), Article 68.
- Chorba RS, Chorba DJ, Bouillon LE, Overmyer CA, Landis JA (2010) Use of a Functional Movement Screening Tool to Determine Injury Risk in Female Collegiate Athletes. North American Journal of Sports Physical Therapy 5: 47-54.
- Kiesel K, Plisky PJ, Voight ML (2007) Can Serious Injury in Professional Football be Predicted by a Preseason Functional Movement Screen? North American Journal of Sports Physical Therapy 2: 147-158.
- Kiesel K, Plisky P, Butler R (2011) Functional movement test scores improve following a standardized off-season intervention program in professional football players. Scandinavian Journal of Medicine and Science in Sports 21: 287-92.
- Padua DA, Marshall SW, Boling MC, Thigpen CA, Garrett WE Jr (2009) The Landing Error Scoring System (LESS) is a Valid and Reliable Clinical Assessment Tool of Jump-Landing Biomechanics: The JUMP-ACL Study. The American Journal of Sports Medicine 37: 1996-2002.
- Padua DA, Boling MC, Distefano LJ, Onate JA, Beutler AI. Et al. (2011) Reliability of the Landing Error Scoring System-Real Time, a Clinical Assessment Tool of Jump-Landing Biomechanics. Journal of Sport Rehabilitation 20: 145-156.
- Butler RJ, Plisky PJ, Southers C, Scoma C, Kiesel KB (2010) Biomechanical analysis of the different classifications of the Functional Movement Screen deep squat test. Sports Biomechanics 9: 270-279.
- Frost DM, Beach TA, Campbell TL, Callaghan JP, McGill SM (2017). Can the Functional Movement Screen be used to capture changes in spine and knee motion control following 12 weeks of training? Physical Therapy in Sport 23: 50-57.
- Mizner RL, Chmielewski TL, Toepke JJ, Tofte KB (2012) Comparison of Two-dimensional Measurement Techniques for Predicting Knee Angle and Moment during Drop Vertical Jump. Clinical Journal of Sport Medicine 22: 221-227.
- Honert E, Powell B, Goehler CM (2013) Estimating Individual Joint Contributions to Recorded Upper Extremity Movements using OpenSim. Proceedings of the ASME 2013 Summer Bioengineering Conference, Sun River, OR.
- Honert E, Aguilar F, Kozlowski A, Goehler CM. (2014) Estimating Upper Extremity Joint Contributions in Functional Motions to Create a Metric for Injury Prevention using OpenSim. Proceedings of the 7th World Congress of Biomechanics, Boston, MA.
- Kozlowski A, Koehn R, Knop L, Helm K, Prato L, et al. (2015) Estimating Joint Contributions in Functional Motions to Create a Metric for Injury Prevention using Motion Capture and OpenSim: A Preliminary Study. Proceedings of the 39th Annual Meeting of ASB, Columbus, OH.
- Koehn R., Kozlowski A., Valbuena R, Helm K., Prato L., et al. (2016) Developing Statistical Metrics of Joint Mechanics for use in Assessing Risk of Injury: An Initial Study to Determine Gender-Based Differences. Proceedings of the 40th Annual Meeting of ASB, Raleigh, NC.
- Miller B, Larson J, Austin M, Helm K, Prato L. et al. (2016, August). Developing Quantifiable Assessment and Training Protocols for Injury Prevention. Proceedings of the 40th Annual Meeting of ASB, Raleigh, NC.
- Valbuena R, Koehn R, Goehler CM (2017) Comparing Inertial Measurement Unit and Optical Infrared Passive Marker-Based Motion Capture Systems for Injury Prevention. Proceedings of the 41st Annual Meeting of ASB, Boulder, CO.
- Austin M, Profitt M, Helm K, Prato L, Levenda A, et al. (2018) Differences in Knee Flexibility during Functional Movements between Track and Field Athletes Based on Event Participation. Proceedings of the 42nd Annual Meeting of ASB, Rochester, MN.
- Harrold K, Noel R, Helm K, Prato L, Levenda A,et al. (2018) Determining Kinematic Parameters that Dictate Successful Completion of the Hurdle Step Functional Movement. Proceedings of the 42nd Annual Meeting of ASB, Rochester, MN.
- Valbuena R, Griffin S, Goehler CM (2018) Comparing Inertial Measurement Unit and Optical Infrared Passive Marker-Based Motion Capture Systems: Studying the Effects of Subject Preparation Variability. Proceedings of the 42nd Annual Meeting of ASB, Rochester, MN.
- Delp SL, Anderson FC, Arnold AS, Loan P, Habib A, et al. (2007) OpenSim: Open-source Software to Create and Analyze Dynamic Simulations of Movement. IEEE Transactions on Biomedical Engineering, 54: 1940-1950.
- Delp SL, Loan JP, Hoy MG, Zajac FE, Topp EL (1990) An interactive graphics-based model of the lower extremity to study orthopaedic surgical procedures. IEEE Transactions on Biomedical Engineering 37: 757-767.
- Saul KR, Hu X, Goehler CM, Vidt ME, Daly M, et al. (2015) Benchmarking of Dynamic Simulation Predictions in Two Software Platforms Using an Upper Limb Musculoskeletal Model. Computer Methods in Biomechanics and Biomedical Engineering 18: 445-1458.
