Publication Information
Frequency: Continuous
Format: PDF and HTML
Versions: Online (Open Access)
Year first Published: 2019
Language: English
| Journal Menu |
| Editorial Board |
| Reviewer Board |
| Articles |
| Open Access |
| Special Issue Proposals |
| Guidelines for Authors |
| Guidelines for Editors |
| Guidelines for Reviewers |
| Membership |
| Fee and Guidelines |
 |
Physiological and Economic Aspects of Lettuce Production under Deficit Water and Nitrogen Conditions
Ansari M1, Chaichi MR1*, Bhandari S3, Raheja A4
1&2Plant Science Department, Don Huntley College of Agriculture, California State Polytechnic University, Pomona, USA
3Aerospace Engineering Department, California State Polytechnic University, Pomona, USA
4Department of Computer Science, College of Science, California State Polytechnic University, Pomona, USA
Received Date: October 27, 2020; Accepted Date: November 03, 2020; Published Date: November 12, 2020;
*Corresponding author: Chaichi MR, Plant Science Department, Don Huntley College of Agriculture, California State Polytechnic University, Pomona, USA. Email: mrchaichi@cpp.edu
Citation: Chaichi MR, Ansari M, Bhandari S, Raheja A (2020) Physiological and Economic Aspects of Lettuce Production under Deficit Water and Nitrogen Conditions. Adv Agri Horti and Ento: AAHE-135.
Abstract
This paper presents research on lettuce production’s physiological and economic aspects under deficit water and nitrogen conditions. Lettuce (Lactuca sativa L. var. longifolia) is an essential crop for the economy of California. Two experiments were conducted during fall 2017 and spring 2018 to evaluate the effect of different water applications (0, 25, 50, and 100% of required water to replenish weekly crop evapotranspiration). Nitrogen fertilizer levels (0, 25, 50, and 100 percent of nitrogen required for optimum plant growth based on soil chemical analysis) on lettuce optimize the best water and nitrogen level to achieve the highest input efficiency economically justifiable yield. Soil moisture followed a decreasing trend as the irrigation level decreased, while there was no identical trend in soil moisture content in response to nitrogen treatments. The highest leaf water potential was measured for 100% nitrogen application (N100), whereas the lowest one was recorded in the plants with zero nitrogen (N0). The higher irrigation levels caused lower leaf water potential in lettuce, while the zero irrigation level (IR0) demonstrated the highest leaf water potential. Across all treatments, leaf chlorophyll content was more significantly affected by irrigation levels compared to nitrogen treatments. The higher irrigation and nitrogen levels up to 100% produced the highest lettuce yield. However, the highest water and nitrogen use efficiency was recorded at IR50N25 treatment in both growing seasons. The same treatment produced an economically justifiable yield.
Keywords: Chlorophyll; Lettuce; Nitrogen; Physiology; Water; Yield Economy
Introduction
Lettuce (Lactuca sativa L. var. longifolia) is an essential crop for California’s economy with about $2 billion annual revenue. Lettuce is full of minerals, including calcium, phosphorous, potassium, zinc, iron, vitamins like thiamin and vitamin B-6, and E. Lettuce is one of the most useful vegetables that reduce blood cholesterol control anxiety. The large quantity of nitrogen accumulates in the ecosystem through fertilizer use causes excellent human health and environmental aspects. On the contrary, a limited amount of nitrogen adversely affects crop yield and yield components. Senyigit et al. (2013) believe that there are strict limits on the lettuce nitrogen content because of its potentially adverse effect on human health. One of the nitrogen properties is its mobilization when it interacts with water. Hence, the higher irrigation level cannot guarantee the most nitrogen availability for a vegetable such as lettuce. Thus, it is necessary to determine the most efficient irrigation levels and nutrients, such as nitrogen, to achieve the optimum yield (Chaichi et al., 2011).
Turner et al. (2012) showed significant effects of nitrogen treatments on lettuce growth’s morphological and physiological characteristics. He reported that dry matter increased over time in control, while it decreased in N- limited lettuce. Stefanelli (2012) reported that adding nitrogen and irrigation at a moderate level caused a significant increase in lettuce yield, height, root depth, leaf area, calcium, zinc, and copper, but did not significantly affect leaf water potential. Grafton (2013) demonstrated that nitrogen fertilizer caused a significant increase in tomato yield, yield components, and chlorophyll content, while it did not significantly affect the water potential. Moussa (2015) reported that if the recommended amount of nitrogen fertilizer (200 kg·N·ha−1) were used as a standard for comparison, lettuce would have significantly more prolonged and broader leaves and higher shoot due to higher concentrations of nitrate. Lindsay et al. (2016) declared that an efficient fertilizer application is crucial to sustainable agriculture because it can reduce the negative effect of fertilizer waste on the environment. Further research indicated a slow-release nitrogen fertilizer application produced more biomass in lettuce than nitrogen fertilizer injected in the soil (Krzebietke 2008; Monaghan 2013 and Cantliffe et al. 2016).
Konstantopoulou et al. (2012) reported that fertilizing nitrogen in lettuce caused higher nitrate concentration in lettuce leaves, higher content of photosynthetic rate, and leaf chlorophyll content while decreased leaf water potential. They also reported that the photosynthetic and chlorophyll ratio was higher in spring than in autumn or winter in lettuce. Liu et al. (2014) demonstrated that the total nitrogen concentration in soil and the nitrate concentration in lettuce increased as nitrogen fertilizer increased. Tsiakaras et al. (2014) found that nitrogen application resulted in a significant increase in chlorophyll content in lettuce while a significant decrease in the leaf water potential. Fox et al. (2017) demonstrated a simple linear relationship between plant N concentration and relative growth rate (RGR).
Dilgado et al. (1992), in an experiment with different water stress treatments on tobacco, concluded that the difference between photosynthesis rate per leaf surface unit for water stress and non- water stress plants were not significant, but the pattern of the change of photosynthesis rate was 45% higher in non-water stress than water stress plants. Sanchez (2000) showed that the interaction of irrigation and nitrogen fertilizer in lettuce caused the highest yield and yield components compared to the sole application of either irrigation or nitrogen fertilizer. Godsey et al. (2003) found that the corn leaves’ water content decreased with the lower irrigation levels. Aggelides et al. (2008) supported his results, demonstrating that leaf nitrogen, leaf water, and Chlorophyll content decreased at the highest soil moisture tension (-100 KPa), while lettuce leaf water potential increased at the same soil moisture condition. Amer et al. (2009) found that the maximum cucumber yield was obtained with adequate water applied with higher N fertilizer application rates. Campos et al. (2011) also reported that the lowest irrigation level increased the photosynthesis rate at the early corn growing season, whereas it decreased at the end of the growing season.
There has been considerable research about the interaction of different fertilizers and irrigation levels on various types of vegetables in the United States and other parts of the world. However, there has not been much research about the interaction of nitrogen and irrigation levels on lettuce in an efficient water and fertilizer use system. This project aims to investigate a compromise between water and N fertilizer application to achieve optimum resource consumption and lettuce production for precision agriculture (Bhandari et al., 2018).
Materials and Methods
A research project was designed to study the interaction effect of irrigation systems and nitrogen fertilizer on lettuce physiological characteristics, including leaf chlorophyll content, leaf water potential, nitrogen use efficiency, soil moisture content, and economical production justification in two growing seasons (fall 2017 and spring 2018) at Spadra Farm in Pomona, California.
Soil samples were collected and analyzed to evaluate the level of different nutrients, including nitrogen. Also, the irrigation water nitrogen level was tested to ensure N treatments’ accuracy in the project. Both soil and water nitrogen levels were low enough as a suitable zone to allow for the application of nitrogen treatments in both cycles. In the fall 2017 experiment, a field with a size of 1360 m2 (14639 ft2) was prepared on October 2nd, and lettuce (Lactuca sativa L. var. longifolia) seedlings were transplanted to the field on October 5th. Establishment irrigation was carried out to help the plants to get settled for two weeks. Then, irrigation treatments were applied to the plants from October 26th to December 14th.
In the spring 2018 experiment, a field with an area of 1360 m2 (14639 ft2) was prepared. On February 07th, lettuce (Lactuca sativa L.) variety longifolia with 65-70 days of the growing period from transplanting to harvesting, was transplanted to the field on February 15th. A general irrigation application was carried out to help the plant get settled (4-6 leaf-stage) for two weeks. Then irrigation treatments were applied to the plants from March 08th to May 05th.
The irrigation application was conducted in the form of the dripped irrigation system in both experimental research sites. A dripped tape irrigation from Valplastic USA Company was used in the experimental plot. The tapes were laid out alongside the planting rows with 12 inches apart emitters with a flow rate of 0.27 gph (gallon per hour) and eight psi (0.55 bar) pressure.
Nitrogen fertilizer treatment levels were determined based on the soil lab recommendation. The nitrogen fertilizer used in the research was a slow-release coated granule urea (GAL-Xe ONE) with 46% pure nitrogen, provided by J. R. Simplot Company. The fertilizer treatments were applied in bands of 3cm apart from the planting rows and 5cm deep in the soil. The N fertilizer was applied to the soil on October 23rd for the fall and March 05th for the spring experiments.
Treatments were arranged in a strip plot based on a randomized complete block design with three replications. The main plots were assigned to four nitrogen fertilizer levels consisting of a control (no fertilizer), 25, 50, and 100 percent of nitrogen required for optimum plant growth based on soil chemical analysis. The irrigation treatments consisting of four irrigation levels of control (0 percent), 25, 50, and 100 percent of required water to replenish weekly crop evapotranspiration were assigned to the subplots within the main plots in the dripped irrigation system.
Every single plot contained three rows of lettuce for which there was 90 cm (2.95 ft) buffer space between the rows and 25 cm (10 inches) buffer space between each plant on the rows. Irrigation was scheduled based on a water balance, calculated as the sum of estimated daily crop evapotranspiration (ETc), subtracting the fraction of rainfall not exceeding the field capacity (Di Paolo and Rinaldi, 2008; El-Hendawy and Schmidhalter, 2010). Actual crop water use requirements for lettuce was determined according to the crop evapotranspiration (ETc), estimated from the potential evapotranspiration (ETo), and using the crop coefficients (Kc) proposed using the following equation:
Eq. (1) ETc = ETo×Kc
The parameter (ETo) was calculated using the Penman-Monteith method (Allen et al., 1998) using the daily data obtained from California Irrigation Management Information System (CIMIS) that was recorded at the Cal Poly Pomona’s weather station. The Kc is defined as the ratio of the crop evapotranspiration rate to the reference evapotranspiration rate. The localized step-wise Kc of Southern California was used in this study (Allen et al., 1998). The water requirement for individual plots was measured for weekly irrigation. The amount of water application base for each treatment was also calculated using the following Eq.:
Eq. (2) In =0.623 x A x Kc x ETo / IE
In the above equation, In is the volume of irrigation water (Gal), 0.623 is the constant of the equation, A is the plant canopy area (ft2), Kc is the crop coefficient, ETo is the potential evapotranspiration (inch), and IE is the irrigation efficiency.
The lettuce yield and yield components were measured after 8 to 10 weeks of each experimental commencement. Agronomic characteristics including biomass, water use efficiency, nitrogen use efficiency, plant height, leaf number, and physiological characteristic such as leaf chlorophyll content (Spectrophotometry), leaf water content, and water potential as well as soil moisture content were measured weekly. Water potential was measured using a WPC4 Water Potential Meter, and chlorophyll content was measured using SPAD 502DLPlus chlorophyll meter (Bhandari et al., 2018).
The lettuce chlorophyll content and water potential were also compared with the remote sensing data obtained using a multispectral sensor aboard an unmanned aerial vehicle (UAV). The data was helpful, validating the lettuce yield, and yield components measured in the field. Therefore, any significant correlation between the two data sources is expected to establish a standard model used to predict lettuce yield and its components in the same conditions to save more money, time, and energy.
The data were analyzed by SAS statistical program, the means were compared by LSD (least significant difference) procedure, and the diagrams and figures were created and analyzed by the Microsoft Excel program.
Leaf Water Potential
The leaf water potential was significantly (p<0.05) affected by nitrogen treatments during the spring experiment (Figure 1). The highest leaf water potential was seen with the N100 level, whereas the lowest one was recorded with N0. Nitrogen fertilizer has the most significant effect on leaf water potential than phosphorus and potassium fertilizers in lettuce (Tzortzakis, 2009). He also reported that higher nitrogen fertilizer caused a significantly higher nutrient concentration in lettuce, which increased the leaves’ water potential. It seems that a higher concentration of nitrogen has caused the leaf to absorb and hold the water more tightly (Figure 1).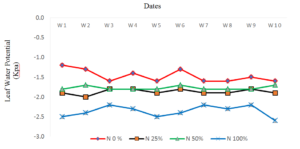
Figure 1: The sampling period (growing season) and nitrogen treatments on leaf water potential in lettuce, fall 2017 experiment.
Week 1 (W1): 03/08/2018, W2: 03/15/2018, W3: 03/22/2018, W4: 03/29/2018, W5: 04/05/2018, W6: 04/12/2018, W7: 04/19/2018, W8: 04/26/2018, W9: 05/03/2018, W10: 05/10/2018
(Figure 2) shows that during the spring growing season, higher irrigation levels caused lower leaf water potential in lettuce, while IR0 demonstrated the highest leaf water potential. It could be concluded that IR100 treatment provided enough water to overcome a higher leaf water potential (Figure 2). Stefanelli et al. (2011) showed that leaf water tension in lettuce was increased as irrigation levels decreased from IR100 to IR0. Tandon (2005) demonstrated that control non-irrigation (IR0) caused the highest leaf water potential and the lowest yield in lettuce compared to other corresponding irrigation treatments. He reported that high leaf water potential under IR0 could lead to the lower yield in lettuce.
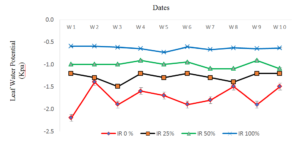
Figure 2: The sampling period (growing season) and irrigation treatments on leaf water potential in lettuce, spring 2018 experiment.
W1: 03/08/2018, W2: 03/15/2018, W3: 03/22/2018, W4: 03/29/2018, W5: 04/05/2018, W6: 04/12/2018, W7: 04/19/2018, W8: 04/26/2018, W9: 05/03/2018, W10: 05/10/2018
Leaf Chlorophyll Content
In the fall growing season, the leaf chlorophyll content demonstrated a decreasing trend as the irrigation levels increased. In the spring growing season, the leaf chlorophyll content also decreased while the irrigation treatments increased where IR0 and IR25 demonstrated the highest leaf chlorophyll content than the other corresponding treatments. Nitrogen treatments significantly (p<0.05) affected leaf chlorophyll content. The highest and lowest chlorophyll content was measured in N50 and N0 treatments, respectively.
The leaf chlorophyll content followed a decreasing trend up to the fifth week during the fall season across all the nitrogen treatments. However, it seems that as the plant reached higher developmental stages of growth, the chlorophyll content increased across all the nitrogen fertilizer treatments (Figure 3).
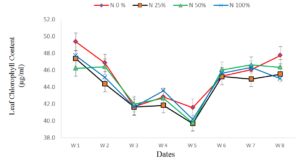
Figure 3: The sampling period (growing season) and nitrogen treatments on leaf chlorophyll content in lettuce, fall 2017.
W1: 10/26/2017, W2: 11/02/2017, W3: 11/09/2017, W4: 11/16/2017, W5: 11/22/2017, W6: 11/30/2017, W7: 12/07/2017, W8: 12/14/2017
Different nitrogen treatments did not significantly affect the lettuce chlorophyll content up to the fourth week of the spring season sampling period. However, there was a significant reduction in N0 compared to other nitrogen treatments since then. The difference was even more significant between N0 and N50 towards the latest weeks (Figure 4).
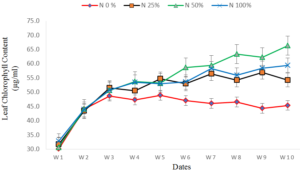
Figure 4: The sampling period (growing season) and nitrogen treatments on leaf chlorophyll content in lettuce, spring 2018 experiment.
W1: 03/08/2018, W2: 03/15/2018, W3: 03/22/2018, W4: 03/29/2018, W5: 04/05/2018, W6: 04/12/2018, W7: 04/19/2018, W8: 04/26/2018, W9: 05/03/2018, W10: 05/10/2018
Nitrogen is one of the most important essential elements to produce leaf chlorophyll (Zhou et al. 2014). Applying nitrogen fertilizer in Urea’s form caused a significantly higher leaf chlorophyll content in lettuce (Sabat et al. 2015 and Coria et al. 2009). Sandra (2005) showed that increasing N50 to N100 led to two times higher leaf chlorophyll content than increasing N30 to N50 in lettuce.
The plant chlorophyll content followed a decreasing (W1 to W5) and increasing trend (W5 to W8) in response to different irrigation treatments during the fall season. It is worth mentioning that the chlorophyll content under IR100 treatment was significantly lower compared to the other irrigation treatments all through the growing season (Figure 5).
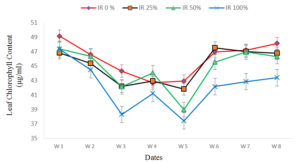
Figure 5: The sampling period (growing season) and irrigation treatments on leaf chlorophyll content in lettuce, fall 2017 experiment.
W1: 10/26/2017, W2: 11/02/2017, W3: 11/09/2017, W4: 11/16/2017, W5: 11/22/2017, W6: 11/30/2017, W7: 12/07/2017, W8: 12/14/2017
The irrigation treatments demonstrated a generally increasing trend in the leaf chlorophyll content during the spring growing season. IR50 and IR100 treatments showed a significantly lower leaf chlorophyll content compared to IR25 and control (No irrigation) from week eight to week ten (Figure 6).
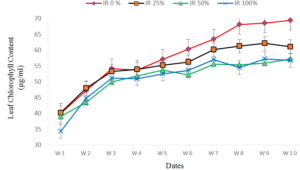
Figure 6: The sampling period (growing season) and irrigation treatments on leaf chlorophyll content in lettuce, spring 2018 experiment.
W1: 03/08/2018, W2: 03/15/2018, W3: 03/22/2018, W4: 03/29/2018, W5: 04/05/2018, W6: 04/12/2018, W7: 04/19/2018, W8: 04/26/2018, W9: 05/03/2018, W10: 05/10/2018
A higher water volume could explain the significantly lower concentration of leaf chlorophyll content in IR50 and IR100 in the leaf, which decreased the concentration of nutrients and chlorophyll. Our results correspond to Hoque et al. (2010) findings, which demonstrated that the concentration of chlorophyll in lettuce decreased at higher levels of irrigation treatment than control (IR0). Andriolo et al. (2005) also reported a higher volume of water content in lettuce leaf showed lower chlorophyll concentration. Sefer (2009) showed that IR100 led to significantly lower chlorophyll content in corn leaf than IR50.
Nitrogen Use Efficiency
Understanding the significance of nitrogen use efficiency is important because it demonstrates the system’s capability to produce lettuce dry matter per unit of nitrogen fertilizer used. During the fall experiment, increasing nitrogen fertilizer in each irrigation level decreased nitrogen use efficiency in lettuce (Figure 7). The least nitrogen use efficiency (8.8 kg DM/kg N) occurred in control irrigation treatment (IR0) while receiving the highest level of nitrogen (N100), whereas the highest efficiency of nitrogen use (46.8 kg DM/kg N) was observed in IR50 and IR100 receiving N25 treatment (Figure 7). From the environmental and economic point of view, it seems that the best nitrogen use efficiency was achieved in IR50N25 treatment.
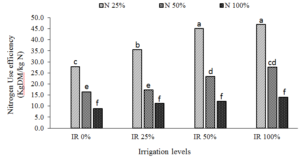
Figure 7: Interaction effect of irrigation and nitrogen treatments on nitrogen use efficiency (Kg DM/Kg N) in lettuce biomass (dry matter) yield, fall experiment 2017.
No significant difference (p≤0.05) between treatments with the same letters.
The same trend of nitrogen use efficiency as the fall experiment was observed in the spring experiment. Nitrogen use efficiency followed an increasing trend as irrigation levels increased (Figure 8). However, higher levels of nitrogen in each irrigation level demonstrated a decreasing trend in nitrogen use efficiency. The highest nitrogen use efficiency was similarly observed in IR50N25 and IR100N25 treatments. However, IR50N25 treatment was the most suitable treatment to achieve the optimum lettuce biomass yield (Figure 8). From the environmental and economic perspective, the best nitrogen use efficiency was achieved in IR50N25 treatment. The lowest nitrogen use efficiency was recorded in lettuce’s highest nitrogen fertilizer level (Sandra, 2005 and Francesco et al., 2013).).
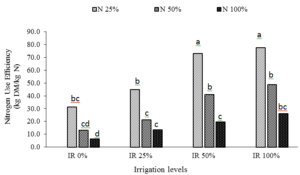
Figure 8: Interaction effect of irrigation and nitrogen treatments on nitrogen use efficiency (kg DM/kg N) in lettuce biomass (dry matter) yield, spring experiment 2018.
No significant difference (p≤0.05) between treatments with the same letters.
Soil Moisture
The soil moisture content did not follow any significant trend in response to different nitrogen treatments in the fall and spring growing seasons (Figures 9 and 10). However, N0 treatment demonstrated the highest soil moisture content than other corresponding nitrogen treatments in both growing seasons. In the fall experiment, N0 treatment showed the highest soil moisture content in week 7 and week 7 sampling periods (Figures 9).
One of the nitrogen fertilizer properties is to absorb soil moisture (Bowden et al. 2004). It seems that increasing the nitrogen level decreased the moisture content of the soil. The highest soil moisture content was measured for N0 treatment in both growing seasons. Burton et al. (2002) reported that soil moisture content was increased as nitrogen and phosphorous fertilizer levels decreased (Burton et al. 2002 and Ding et al. 2007). Chu et al. (2004) demonstrated that N100 and N75 treatments decreased the soil moisture in Japanese Andisol, whereas N0 and N10 treatments held the highest moisture in the soil. Rodrigues et al. (2011) showed that the lower nitrogen fertilizer (Urea) treatments caused higher soil moisture and olive biomass in a four-year study.
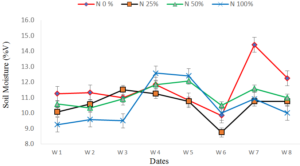
Figure 9: The sampling period (growing season) and nitrogen treatments on soil moisture content, fall 2017 experiment.
W1: 10/26/2017, W2: 11/02/2017, W3: 11/09/2017, W4: 11/16/2017, W5: 11/22/2017, W6: 11/30/2017, W7: 12/07/2017, W8: 12/14/2017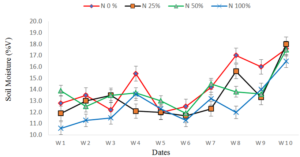
Figure 10: The sampling period (growing season) and nitrogen treatments on soil moisture content, spring 2018 experiment.
W1: 03/08/2018, W2: 03/15/2018, W3: 03/22/2018, W4: 03/29/2018, W5: 04/05/2018, W6: 04/12/2018, W7: 4/19/2018, W8: 04/26/2018, W9: 05/03/2018, W10: 05/10/2018
In both fall and spring growing seasons, the soil moisture content followed a significant increasing trend as the irrigation levels increased. The Highest soil moisture content was seen in IR100 and the lowest in IR0. The IR100 treatment showed the highest soil moisture content compared to other corresponding treatments. However, there was no increasing or decreasing trend in the soil moisture content from IR25 to IR100 (Figures 11 and 12).
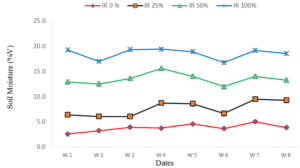
Figure 11: The sampling period (growing season) and irrigation treatments on soil moisture content, fall 2017 experiment.
W1: 10/26/2017, W2: 11/02/2017, W3: 11/09/2017, W4: 11/16/2017, W5: 11/22/2017, W6: 11/30/2017, W7: 12/07/2017, W8: 12/14/2017
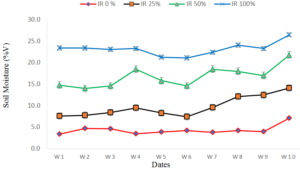
Figure 12. The sampling period (growing season) and irrigation treatments on soil moisture content, spring 2018 experiment.
W1: 03/08/2018, W2: 03/15/2018, W3: 03/22/2018, W4: 03/29/2018, W5: 04/05/2018, W6: 04/12/2018, W7: 04/19/2018, W8: 04/26/2018, W9: 05/03/2018, W10: 05/10/2018
The soil moisture content was well responsive to the irrigation treatments through the fall and spring growing seasons (Figures 11 and 12). The highest soil moisture content was seen for IR100 treatment, while the lowest content was recorded for the control treatment (IR0). The soil used in both experiments was clay loam, a moderate-heavy texture containing more micro rather than meso and macro-pores, which increased the soil moisture storage capacity (Messing 1977., Rawls et al. 1989., Kattere et al. 2002 and Madi et al. 2016). That could better explain the higher moisture content at the higher irrigation treatments (IR100 and IR50). Ansari et al. (2011) demonstrated that soil water content was significantly higher at IR100 treatment than other corresponding treatments in a silty clay loam under carbonate calcium and gypsum treatments.
Crop Production Economics
From an economic point of view, there was no significant difference in yield income among IR100N0, IR100N25, IR50N25, IR50N50, and IR50N100 treatments in the fall and spring experiments (Figures 13 and 14). Despite IR100N50 and IR100N100 treatments achieved the highest yield income, these treatments cannot be environmentally justified, inefficient water, and nitrogen use strategy. Based on these results, we could conclude that IR50N25 treatment provided a justifiable yield income per hectare in both fall and spring experiments. One of the most crucial issues in California agriculture is water shortage and nitrogen fertilizer pollution from the environmental perspective. It could be justifiable to consider IR50N25 treatment as the most efficient water and nitrogen treatment (based on both experiments’ biomass graphs).
The total water used in the fall experiment was 851.7 m3/ha (91052.3 gallons/acre) in IR100N100 treatment. It should be considered that IR50N25 treatment was the most water and nitrogen fertilizer efficient treatment, which saved 425.8 m3/ha of water (50%) in lettuce production. This result is critically important in California’s agricultural system. It should be considered that the savings in water resources in this treatment (50% compared to control) and nitrogen fertilizer (75% compared to control), a crucial environmental goal, will be achieved in the California lettuce production industry.
The total water used in the spring experiment was 1557.5 m3/ha (166507 gallons/acre) for IR100N100 treatment. The same results and comparisons of fall could also be applied in the spring experiment. Water saving of 778.8 m3/ha (50%) in the spring experiment is most important in California agriculture under water shortage conditions.
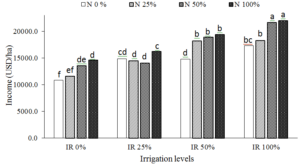
Figure 13: Interaction effect of irrigation and nitrogen treatments on income (USD) in lettuce biomass (dry matter) yield, fall experiment 2017.
No significant difference (p≤0.05) between treatments with the same letters.
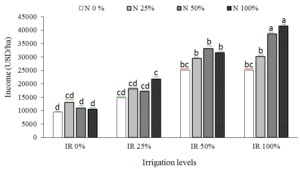 Figure 14: Interaction effect of irrigation and nitrogen treatments on income (USD) in lettuce biomass (dry matter) yield, spring 2018 experiment.
No significant difference (p≤0.05) between treatments with the same letters.
Conclusions
Different irrigation and nitrogen treatments significantly affected lettuce yield and yield components in both fall and spring experiments. It seems that higher irrigation and nitrogen levels up to 100% produced the highest lettuce yield. However, the most efficient water and nitrogen fertilizer use in lettuce was recorded at IR50N25 treatment in both the growing seasons. Since California’s most crucial agricultural concern is to achieve the best water and nitrogen use efficiency, IR50N25 treatment could be recommended for lettuce production under this experiment’s environmental conditions. This recommendation is for water and nitrogen savings and preferably for more environmentally friendly practice with economically justifiable yield. Measuring leaf chlorophyll content by the chlorophyll meter and UAV-based remote sensing technique revealed that the leaf chlorophyll content was more significantly affected by irrigation levels than nitrogen treatments.
References
- Aggelides S, Assimakopoulos L, Kerkides P, Skondras A (2008) Effect of water potential on the nitrate content and the yield of lettuce. Communications in Soil Science and Plant Analysis Journal, 302:235-243.
- Allen RG, Pereira LS, Raes D, Smith M (1998) “Crop evapotranspiration: guidelines for computing crop water requirements.” Irrigation and Drainage Paper No.56, Food and Agriculture Organization of the United Nations, Rome, Italy.
- Amer H, Sally A, Hatfield J (2009) Effect of Deficit Irrigation and Fertilization on Cucumber. Publications from USDA-ARS / UNL Faculty Paper 1349.
- Andriolo JL, Daluz GL, Witter MH, Godoi RS, Barros GT et al. (2005) Growth and yield of lettuce plants under salinity. Bras 23:931-934.
- Ansari M, Shirani H, Dashti H, Tajabadipur A (2011) Effect of Calcium Carbonate and Gypsum on Yield, Yield Elements, Iron, Copper, and Zinc Uptake by Corn at Two Soil Textures. JWSS, (1557) 171-181.
- Bhandari S, Raheja A, Chaichi MR, Green RL, Espinas A et al. (2018) Effectiveness of UAV-Based Remote Sensing Techniques in Determining Lettuce Nitrogen and Water Stresses. Proceedings of 14thInternational Conference on Precision Agriculture, Montreal, Canada.
- Campos C, Fernandes P, Gheyi H, Blanco FF, Belém GC et al. (2006) Yield and fruit quality of industrial corn under saline irrigation. Sci 63:146-152.
- Chaichi MR, Rostamza M, Jahansouz MR, Alimadadi A (2011) Forage quality, water use, and nitrogen utilization efficiencies of pearl millet grown under different soil moisture and nitrogen levels. Agricultural Water Management 98:1607-1614.
- Fox RH, Walthall C (2017) Crop monitoring technology to assess nitrogen status, nitrogen in agricultural systems, American Society of Agronomy, Agronomy Monograph 49:647-674.
- Grafton M, Yule I, Lockhart J (2013) An economic analysis of the topdressing industry, in Farming’s Future: Minimizing Footprints and Maximizing Margins, Occasional Report No. 23, ed. by Currie LD and Christensen CL. Fertilizer and Lime Research Centre, Palmerston North, New Zealand, 4:405-412.
- Hoque MM, Ajwa H, Othman M, Smith R, Cahn M (2010) Yield and postharvest quality of lettuce response to nitrogen, phosphorus, and potassium fertilizers. HortScience10:1539-1544.
- Konstantopoulou E, Kapotis G, Salachas G, Petropoulos SA, Chatzieustratiou E et al. (2012) Effect of nitrogen application on growth parameters, yield and leaf nitrate content of greenhouse lettuce cultivated during three seasons. Journal of Plant Nutrition 35:1246-1254.
- Krzebietke S (2008) Response of butter lettuce to different forms of nitrogen fertilizers with chlorine and sulfate. Journal of Elementology. 13:581-588.
- Lindsey AJ, Steinke K, Rutan J, Thomison PR (2016) Relationship between DGCI and SPAD Values to corn grain yield in the eastern corn belt, crop, forage, and turf management.
- Liu CW, Sung Y, Chen BC, Lai HY (2014) Effects of Nitrogen Fertilizers on the Growth and Nitrate Content of Lettuce (Lactuca sativa L.). International Journal of Environmental Research and Public Health 11:4427-4440.
- Madi R, Rooij GHD, Mielenz H, Mai J (2016) Parametric soil water retention models: a critical evaluation of expressions for the full moisture ranges. Hydrology and Earth System Sciences, doi:10.5194/hess-2016-168.
- Monaghan J, Daccache A, Vickers L (2013) More’ crop per drop’: constraints and opportunities for precision irrigation in European agriculture. J Sci Food Agric 93:977-
- Moussa M, Taylor GW, Abuleil AM (2015) An integrated system for mapping red clover ground cover using unmanned aerial vehicles: A case study in precision agriculture, IEEE Conference on Computer and Robot Vision, Halifax, Nova Scotia 277-284
- Sabat T, Kaniszewski S, Dyśko J (2015) Effect of flood fertigation on the yield of greenhouse lettuce grown in different substrates. J. Elem 20:407-416.
- Sanchez C (2000) Response of lettuce to water and nitrogen on sand and the potential for leaching of nitrate-N. HortScience, 35:73-77.
- Sandra HB (2005) Hunger signs in crops, a Symposium, 3rd David Mckay Co. Inc. USA.
- Sefer B, Mansurolu GS, Kara M, Önder S (2009) Responses of lettuce to irrigation levels and nitrogen forms. African journal of agricultural research 4:1171-1177.
- Senyigit U, Kaplan D (2013) Impact of different irrigation water levels on yields and some quality parameters of lettuce under unheated greenhouse condition. Polska Akademia Nauk Oddzial, W. Krakowie, S 97-107.
- Stefanelli D, Bradly S, Winkler S, Jones RB, Tomkins B (2012) Lettuce (Lactuca sativa L.) growth and quality response to applied nitrogen under hydroponic conditions. Acta Horticulture Journal, 927:353-360.
- Swain C, Jayasuriya H, Salokhe V, Jayasuriya PW (2016) Suitability of Low-Altitude remote sensing images for estimating nitrogen treatment variations in rice cropping for precision agriculture adoption. Journal of Applied Remote Sensing 1:35-47.
- Tandon HL (2005) Micronutrient in soil, crops, and fertilizers. Fertilizer Development and Consultation Organization, New Delhi, India.
- Tsiakaras G, Spyridon A, Khan E (2014) Effect of GA 3 and nitrogen on yield and marketability of lettuce (Lactuca sativa). Journal of Crop Science, 8:127-132.
- Zhang L, Zhang G, Wang Y, Chen B, Zhou Z et al. (2013) Effect of soil salinity on physiological characteristics of functional leaves of cotton plants. Plant Res, 126:293-304.