ISSN: 2641-6816
Frequency: Continuous
Format: PDF and HTML
Versions: Online (Open Access)
Year first Published: 2018
Language: English
| Journal Menu |
| Editorial Board |
| Reviewer Board |
| Articles |
| Open Access |
| Special Issue Proposals |
| Guidelines for Authors |
| Guidelines for Editors |
| Guidelines for Reviewers |
| Membership |
| Fee and Guidelines |
 |
Physicochemical Properties and Sensory Analysis of Cashew Apple (Anacardiumoccidentale L.) – Mango (Mangiferaindica) Blends Jam
Chay Chim1*, Lun Channa1, Ly Phanna1, Thorng Puthearith1, Dizon Erlinda I2.
1* Faculty of Agro-Industry, Royal University of Agriculture, Phnom Penh, Cambodia
2Institute of Food Science and Technology, College of Agriculture and Food Science, University of the Philippines Los Baños, College, Laguna – 4031, Philippines
Received Date: July 23, 2021; Accepted Date: August 03, 2021; Published Date: August 12, 2021
*Corresponding author: Chay Chim, Faculty of Agro-Industry, Royal University of Agriculture, Phnom Penh, Cambodia. Email: chaychim@rua.edu.kh
Citation: Chim C, Channa L, Phanna L, Puthearith T, ErlindaI D (2021) Physicochemical Properties and Sensory Analysis of Cashew Apple (Anacardiumoccidentale L.)-Mango (Mangiferaindica) Blends Jam. Adv in Nutri and Food Sci: ANAFS-216.
DOI: 10.37722/ANAFS.2021302
Abstract
The study was conducted to evaluate the physicochemical and sensory properties of cashew apple-mango blends jam. Different ratios of cashew apple: mango purees (100:0, 70:30, and 50:50 and level of citric acid 0.1, 0.2, and 0.3 percent) were used to determine the physicochemical properties and sensory analysis of jams. Results of statistical analyses revealed that except for moisture content (MC) and water activity (Aw), significant differences exist among samples in terms of physicochemical and antioxidant properties. The MC of samples ranged from 26.35-30.20%; Aw, 0.80-0.84; pH, 3.73-4.50; titratable acidity, 0.56-0.84%; total soluble solids, 63.30 to 67.43 °Brix; total sugar, 51.02 to 58.71%; reducing sugar, 10.38-12.52%; vitamin C content, 45.66 to 72.76 mg/100g; and total phenolic content, 1.95 to 2.47mgGAE/mL. Microorganisms were not detected in the samples after processing. However, the natural acid content of cashew apple was found not enough to provide suitable acid taste in the jam, hence, addition of citric acid was done to enhance the taste of the final products. Sensory evaluation revealed that high proportion of cashew apple in the formulations was commented by most panelists to have acrid taste and objectionable odor resulting in low scores particularly for overall acceptability. Results show that T6 where the ratio of cashew apple: mango (50:50) received the highest consumer preference among treatments in terms of color, sourness, sweetness, texture, taste, and general acceptability. Utilization of cashew apple into high valued products like jams or other similar products will not only help in the reduction of wastage of these fruits, but it will also serve as additional source of income for the local famers and the country as a whole. Future studies should be conducted in the production of processed products using local raw materials, including optimization of processing parameters and development of proper packaging to be more competitive in the international markets.
Introduction
Cashew apples are highly nutritious compared to many other tropical fruits besides possessing obvious health merits [1]. It is also reported to have anti-bacterial, antioxidant and anti-mutagenic properties. It is quite unfortunate that the country is wasting such an excellent fruit, causing economic loss to the farmers and the country. Hence, an attempt was made to produce certain value enhanced products from cashew apple such as cashew apple juice, cashew apple jelly and cashew apple jam employing certain processing technologies paving way for the availability of the products all year round, reducing postharvest losses and better remunerative returns to the farmers. The fresh ripe cashew apples are wasted since it quickly spoiled under the tree due to the fast enzymatic and microbial reactions in the fruits dueto its nutritive values similar to other kinds of fruits which are commonly high in vitamins and minerals. In terms of pectin content there is somewhat conflicting claims among previous studies. Throgpanich et al. (1990) [2] reported that jam from cashew apple contained high pectin content while Emelike and Akusu (2019) [3] reported otherwise. Their study revealed that lemon has high pectin strength, mangoand guava have medium while cashew apple, pineapple, and sour-sop have weak pectin strength. Throgpanich et al. (1990) [2] also conducted the organoleptic test and results revealed that the jam was quite acceptable in terms of texture, color and taste. However, the odor was acceptable only to panelists who are accustomed to its strong natural unique odor. Besides production of the cashew apple jam in its pure form having distinctive odor, the combination of cashew apple with other local fruits especially those that contain low or no pectin would enhance the sensory qualities of the final products. For example, ripe mango known to have relatively low pectin might pairs well with other fruits high in pectin like cashew apple. The blending of cashew apple with mango puree will results in higher acidity or lower pH that enhances gel properties, and likewise improves the sensory attributes (e.g. color, taste, texture, among others) than the control. This might provide advantages to the food industries and the local farmers as well. Firstly, this will provide maximum utilization of harvested cashew apple; secondly, to produce milder odor of cashew apple jams acceptable to majority of people; and lastly, to reduce the added pectin in the mixed fruit jam.
Thus, this study aimed to determine the suitable proportion of ripe cashew apple and mango that will give the best quality product(s) through evaluation of their physicochemical properties, microbial load and sensory qualities.
Materials and Methods
Materials
The raw materials (Figure 1) used in the study consist of red cashew apple (M23) from Kosal Farm, Preasvihear province. On the other hand, ripe mangoes were purchased from the local market. Freshly-harvested ripe cashew apples were placed in coolers and immediately transported to the laboratory for analysis. Other samples were kept in the freezer (-18°C) for future studies.
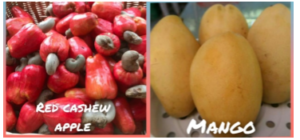
Figure 1: The cashew apple (red) and mango varieties used in the study.
Preparation of Samples
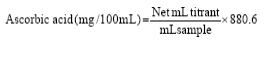
The fully ripe fresh cashew apples were washed, cored, cut into small pieces and blended with water at the proportion of 1 part fruit to 0.85 part water (1:0.85). Ripe mangoes, on the other hand, were cut into halves and flesh was scooped out with spoon and blended to produce the puree. Then the cashew apple purees were mixed with mango purees at different ratios and mixed with refined sugar as shown in Table 1. Pectin was added last during cooking in order to check the level of pectin from cashew apple for jam making. The citric acid was added also at different levels as shown in Table 1. Heating of mixtures from different treatments were done with constant stirring until the total soluble solids obtained were not less than 65oBrix. Then the jams were aseptically packed in 200-gram capacity preserving bottles for further analysis and sensory evaluation. 70 50 Table 1: Cashew apple-mango jam formulations. Physicochemical Properties Analysis Determination of pH The pH of jam samples was determined using a pH meter (pH meter C861, Consort, bio block, Belgium) according to the AOAC (1995) [4] method. The instrument was calibrated using two buffer solutions (pH 7.0 and 4.0) before pH of the samples were measured. The measurement was made by immersing the electrode in 10g of sample and the reading was repeated three times. Determination of Total Soluble Solids (TSS) The TSS of samples was determined as described by Soyer et al. (2003) [5] using a hand refract meter (Model Pal-BX/RI) equipped with a digital display. Determination of Titratable Acidity The titratable acidity (TA, expressed as % citric acid) was determined by placing samples in a beaker and titrating with standardized 0.1 N sodium hydroxide solution to pH 8.2 ± 0.1 (AOAC, 2000) [6]. Determination of Moisture Content The moisture content of the jam samples was analyzed using MB series moisture analyzer (Model OHAUS M23). Determination of Water Activity The water activity (Aw) of the jam samples was determined using Smart water activity meter (Model Pawkit Aqualab). Determination of Reducing Sugar and Total Sugar The concentration of D-glucose in the jam samples was determined before and after hydrolysis of sucrose by β-fructosidase (invertase) [7]. The content of D-fructose from cashew apple-mangojam was determined subsequent to the determination of D- glucose, after isomerization of the D-glucose by phospho-glucose isomerase [8]. The concentration of D-sucrose was determined by the method of Outlaw and Mitchell (1988) [9]. The total sugars were assayed by the phenol sulfuric acid method [10]. Antioxidant Analysis Vitamin C Analysis Vitamin C of the samples was determined by iodine titration [6, 11]. To 25 mL of sample in a 150 mL beaker was added 35 mL starch-sulfuric acid solution. The resulting solution was titrated with standardized 0.1 M iodine solution (covered from light), while stirring until the first stable blue color appeared. For the blank, samples were replaced with distilled water. Ascorbic acid (mg/100 mL) was calculated from the formula: Determination of Total Phenolic Content The total phenolic content of samples was determined by Folin-Ciocalteu method following the procedure of Teresa Escribano-Bailón et al. (2002). The jam was diluted with 97% of ethanol and then 0.5 mL of the samples, 2.5 mL of Folin-Ciocalteu’s phenol reagent (Sigma-Aldrich) and 2.5ml of 7.5% Na2CO3 were added. After standing for 20 mins, the absorbance readings were measured at 760 nm (Shimadzu UV-1601 spectrophotometer) with water plus reagent as blank samples. Total phenolic content was computed in a standard curve with gallic acid as reference phenol. The results were expressed as gallic acid equivalents (mgGAE/100ml). Microbiological Analyses Microbial analysis of the processed cashew apple-mangoblends jam samples was conducted simultaneously with physicochemical analysis. Ten (10) g of the samples was aseptically transferred to 90mL sterile 0.1% peptone water, as diluent. Decimal dilutions in diluents solution were prepared and standard pour plating technique was carried out in appropriate agar media [12]. After the required incubation time and temperature, enumeration of different kinds of microorganisms was performed. The Total Viable Count (TVC) was enumerated following the method by Maturin and Peeler (2001), Marotz et al. (2001), and Mortor (2001); and yeast and mold counts using the method of Touma et al. (2001); and Beuchat and Cousin (2001) [13-17]. The coliforms and E. coli were enumerated as described by Feng et al. (2001); and Kornacki and Johnson (2001) [18, 19]. Pathogenic bacteria such as Staphylococcus, Salmonella spp., were determined following the methods described by Andrews et al. (2001) [20]. Sensory Analysis of Cashew Apple-Mango Blends Jam The sensory evaluation of the organoleptic characteristics of cashew apple-mango blends jam samples was carried out at the Faculty of Agro-Industry, Royal University of Agriculture, Dongkor District, Phnom Penh, Cambodia. A hedonic test on a linear 9-point scale (Table 2) assessed the degree of appreciation of organoleptic characteristics using the method described by Stone and Sidel (1992) [21]. It was applied more specifically to cashew apple jam by Talasila et al. (2011) [22]. Figure 2: The red cashew apple-mango blends jam from different treatments. T0 = 100% RCAP,1% PT, 50% RS; T1 = 70% RCAP, 30% RMP, 0.1% CA, 1% PT, 50% RS; T2 = 70% RCAP, 30% RMP, 0.2% CA, 1% PT, 50% RS; T3 = 70% RCAP, 30% RMP, 0.3% CA, 1% PT, 50% RS; T4 = 50% RCAP, 50% RMP, 0.1% CA, 1% PT, 50% RS; T5 = 50% RCAP, 50% RMP, 0.2% CA, 1%PT, 50% RS; T6 = 50% RCAP, 50% RMP, 0.3% CA, 1% PT, 50% RS Table 2: The 9-point hedonic scale. Taste Panelists: Thirty (30) individuals were chosen at random as panelists. The panel was composed of individuals who have not been trained in the chosen organoleptic characteristics for a particular product. Scorecard Sheet: The assessment of cashew apple-mango blends jam samples was based on color, taste, odor, sourness, sweetness, texture and overall acceptability using a linear hedonic scale (Table 2). This 9-point scale ranged from “extremely poor” (points 1) to “extremely good” (points 9) [22, 23]. The range of scores for color varied from “extremely discolored light yellow-brown” to “extremely colored, yellow-brown”. For the taste, the range was from “extremely bitter” to “extremely sweet”. As to the odor, sourness, sweetness, texture and overall acceptability the range of scores varied from “extremely unpleasant” to “extremely pleasant”. Preparation and Presentation of Jam Samples: The evaluation tests of jam samples were conducted in a ventilated room, free of odors and other disruptions that could affect the panel’s perception. Acceptability tests were conducted under white light. The jam samples were placed in white transparent plastic cups and separately served to every taster. A score sheet was provided to each panelist including a glass of water used to wash the mouth in between tasting the samples. Statistical Analysis Results and Discussion Physicochemical Properties The results of analysis on the physicochemical and antioxidant properties of cashew apple-mango blends jam (Table 3) showed that except for moisture content (%) and water activity highly significant differences (P<0.5)exists among samples. The moisture content (MC) and water activity (Aw) of samples ranged from 26.35-30.20% and 0.80 – 0.84, respectively. These values confirmed that jam is classified as intermediate moisture food (IMF) or semi-moist food with MC ranging from 15-40% and Aw of 0.60-0.84. IMFs are shelf-stable food products and are edible without rehydration. Further, the proportion of cashew apple and mango purees and amount of citric acid added in the formulation did not affect the MC and Aw of the products. The pH varied from 3.73 to 4.50, with the highest value obtained from control sample (T0 = pH 4.50) due to the absence of citric acid and the pH of pure cashew apple is inherently high. In treatments with higher amount of citric acid added and with higher proportion of mango the pH values were significantly lower ranging from 3.73 to 3.8 in T3, T5 and T6 samples, respectively. It is important to note that the fresh cashew apple puree has higher pH value (pH 4.50) than mango puree (pH 3.60).According to Codex Alimentarius, the pH <3.35is most suitable for good quality jam. The pH level is an important factor for optimum gel condition of jam [24]. The jam samples in this study though showed pH values above the recommended level but are within the acidic pH range and thus, are desirable for the inhibition of bacterial growth. In the case of titratable acidity (TA), values obtained ranged from 0.56 to 0.84%. The TA (expressed as % citric acid) showed the organic acid present in the samples. In general, the organic acids are intermediates of metabolic processes; it affects the growth of microorganisms and enhanced the preservation quality of jam products. Acids also contribute to the sensory quality properties of food samples [25]. Ellouz et al. (2011) [26] reported that the TA in sour orange jam sample was 49.92l/g. In pure cashew apple jam, Emelike and Akusu (2019) [3] obtained 3.30% TA. The TA is usually provided by the fruit which contains citric acid and tartaric acid [27] and related to the type and species of the fruits. The total soluble solids (TSS) are made up of sugars which can be monosaccharide, disaccharides and oligosaccharides. Aside from acid, the TSS helps increase the consistency and mass to the product and also promotes gelling [28]. A jam should have a TSS of at least 65% to producea satisfactory gel. The TSS (°Brix) level of cashew apple-mango blend jams after cooking obtained values that ranged from 63.30 to 67.43 °Brix which fall in general to the acceptable values of good quality jam. Moisture Content (%)ns AW ns (oBrix) (%) TS (%) (%) Vit.C (mg/100g) 54.79c,d 1.95e
Treatment
Ingredients (%)
Ripe Cashew apple puree (RCAP)
Ripe mango puree
(RMP)Citric acid (CA)
Pectin (PT)
Refined Sugar (RS)
T0
100
–
–
1
50
T1
30
0.1
T2
0.2
T3
0.3
T4
50
0.1
T5
0.2
T6
0.3

Color
Extremely discolored
Very discolored
Discolored
Rather (quite) discolored
Neitherdiscolored nor colored
Rather colored
Colored
Very colored
Extremely colored
1
2
3
4
5
6
7
8
9
Taste
Extremely bitter
Very bitter
Bitter
Rather (quite) bitter
Neither bitter nor sweet
Rather sweet
Sweet
Very sweet
Extremely sweet
1
2
3
4
5
6
7
8
9
Odor
Extremely unpleasant
Very unpleasant
Unpleasant
Rather (quite) unpleasant
Neither unpleasant nor pleasant
Rather pleasant
Pleasant
Very pleasant
Extremely pleasant
1
2
3
4
5
6
7
8
9
Sourness
Extremely unpleasant
Very unpleasant
Unpleasant
Rather (quite) unpleasant
Neither unpleasant nor pleasant
Rather pleasant
Pleasant
Very pleasant
Extremely pleasant
1
2
3
4
5
6
7
8
9
Sweetness
Extremely unpleasant
Very unpleasant
Unpleasant
Rather (quite) unpleasant
Neither unpleasant nor pleasant
Rather pleasant
Pleasant
Very pleasant
Extremely pleasant
1
2
3
4
5
6
7
8
9
Texture
Extremely unpleasant
Very unpleasant
Unpleasant
Rather (quite) unpleasant
Neither unpleasant nor pleasant
Rather pleasant
Pleasant
Very pleasant
Extremely pleasant
1
2
3
4
5
6
7
8
9
Overall acceptability
Extremely unpleasant
Very unpleasant
Unpleasant
Rather (quite) unpleasant
Neither unpleasant nor pleasant
Rather pleasant
Pleasant
Very pleasant
Extremely pleasant
1
2
3
4
5
6
7
8
9
The data generated in the study were statistically processed in duplicate with the SPSS 11.19 statistical software. The significance of the parameters was assessed by the Duncan’s test at 5% threshold. The analysis of variance (ANOVA) allowed to process data from the evaluation of physicochemical, antioxidant and sensory properties of the jam samples. Although significant differences (α <0.05) was obtained, the ANOVA test is supplemented by Turkey’s post ANOVA test to identify the variable(s) with very significant differences from the control values.
Physiochemical Properties and Antioxidant Analysis of Cashew Apple-Mango Jam
Treatment
Physicochemical properties
Antioxidant properties
pH
TSS
TA
RS
TPC (mgGAE/ml)
T0
28.15
0.84
4.50a
65.90a,b
0.63a,b
57.36a
12.52a
72.76a
2.46a
T1
26.35
0.81
4.10b
66.70a,b
0.56b
58.71a
10.38c
61.19b,c
2.13c
T2
26.35
0.83
4.03a,b
67.33a
0.63a,b
56.89a
11.96b
2.21b
T3
28.15
0.82
3.73c
65.60a,b
0.65a,b
56.59a
11.49b
67.58a,b
2.47a
T4
27.95
0.80
4.00b
67.43a
0.70a,b
55.21a,b
11.41b
45.66d
2.06d
T5
30.20
0.83
3.80c
63.30b
0.63a,b
51.83b
11.60b
66.67a,b
2.00e
T6
28.15
0.84
3.80c
63.90a,b
0.84a,b
51.02b
11.66b
47.49d
Values in the same column having different superscript are significantly different at 5% level of probability (p≤0.05).
Note:-
TSS: Total soluble solids;
TA : Titratable acidity (expressed as citric acid);
TS : Total sugar;
Aw : Water activity
RS: Reducing sugar;
TPC: Total phenolic content
pH of fresh cashew apple puree = 45; pH of fresh mango puree = 3.60
T0 = 100% RCAP, 1% PT, 50% RS; T1 = 70% RCAP, 30% RMP, 0.1% CA, 1% PT, 50% RS; T2 = 70% RCAP, 30% RMP, 0.2% CA, 1% PT, 50% RS; T3 = 70% RCAP, 30% RMP, 0.3% CA, 1% PT, 50% RS; T4 = 50% RCAP, 50% RMP, 0.1% CA, 1% PT, 50% RS; T5 = 50% RCAP, 50% RMP, 0.2% CA, 1%PT, 50% RS; T6 = 50% RCAP, 50% RMP, 0.3% CA, 1% PT, 50% RS
The total sugars (TS) include sugars inherent in foods and beverages as well as added sugars. The results of TS analysis revealed that the jam samples contained 51.02 to 58.71%. Aisou (2013) [29] recorded a level of 68g/100g for a jam-based orange, lemon, and grapefruit pulp. The recordable differences could be caused by the sugar addition during the jam-making process [30]. The sugar attracts water molecules, which concentrates the pectin molecules and promotes gelling [28]. The sugar addition is necessary in order to preserve the jams satisfactorily.
Reducing sugars are carbohydrates containing a terminal aldehyde or ketone group which can undergo oxidation reactions. The reducing sugar (RS) content of the jam samples ranged from 10.38% -12.52 % with the control (T0) indicated significantly higher value than the rest of the samples. According to May and Stains by (1986) [31] the acidity associated with a high temperature causes the inversion of 30-50% of added sucrose. The inversion of sucrose has its consequences: i) increased sweetness: fructose is sweeter than sucrose; and ii) obtaining a solution containing more dry matter: fructose and glucose which are more soluble than sucrose.
Antioxidant Properties
The vitamin C content of jams in different treatments differs significantly which ranged from 45.66 to 72.76 mg/100g. Cashew apple juice has been found to have high levels of vitamin C at 203.5 mg/100 mL which was more than four times higher than the juices of orange (54.7 mg/100 mL), grape (45.0 mg/100 mL), lemon (33.7 mg/100 mL), mango (30.9 mg/100 mL), and pineapple (14.7 mg/100 mL) [32]. In general, the results show that the higher the amount of cashew apple puree, the higher is the vitamin C content of the jam samples with T0 having the highest value. The tremendous decrease in vitamin C content in jam can be attributed to the application of heat treatment in the desamerization of processing and probably is mainly due to oxidation of vitamin C. According to Dupaigne (1969) [33], degradation of naringine during desamerization is accompanied by loss of vitamin C. The variability of the ascorbic acid content of the fruits is also influenced by the seasonal and annual variations in the degree of sunshine and humidity, the variety of the fruit, the position of the fruits on the tree, and their degrees of ripeness [34]. Other factors may also be involved such as the sensitivity of ascorbic acid to oxidation by air and in an aqueous medium. Quantification is also influenced by the assay method, which is itself dependent on the complexity of the plant material [35].
The total phenolic content of jam samples also differs significantly among samples which ranged from 1.95 to 2.47mgGAE/ml. Klopotek et al. (2005) [36] reported that treating strawberry at 80°C for 15 minutes causes a 30% loss of phenolic compounds. Water is a source of degradation of phenolic compounds; in the presence of water, an enzymatic activity may quickly cause irreversible changes in antioxidants, such as oxidation which leads to their decomposition or polymerization [37].
Microbial Load of Cashew Apple-Mango Blends Jam
The microbial analysis of jam samples revealed absence of any microorganisms tested (total viable count, yeast & mold, salmonella, coliform and E. coli) in final products. Jams are very stable products, given the low pH and the high sugar content. In addition, the water activity of the jams (0.80 – 0.84) in this study suggests that the products are below the minimum Aw for most bacteria however susceptible to some yeast and mold growth. The only categories that could cause spoilage are wild yeasts and fungi that can be easily taken cared of with low air content in container. Gould (1989) [38] reported that food preservation is best achieved when the processor takes account of the type and concentration of antimicrobial agent, storage time and temperature, food pH and buffering capacity, integrity of food and presence of other agents for shelf life [39-44].
Sensory Analysis of Cashew Apple-Mangoblends Jam
Sensory evaluation was conducted to identify the most acceptable proportion of cashew apple: mango purees for jam making. Except for odor, all sensory attributes tested (color, sourness sweetness, texture, taste and overall acceptability) were found significantly different among treatments (Table 4). The sensory scores for color ranged from 5.40 – 7.27 with pure RCAP (T0) as least preferred and T6 as most preferred. Sourness and sweetness of jam samples ranged from 5.13 – 7.53 and 5.67 – 7.13, respectively. Texture and taste were scored from 5.53 – 7.27 and 5.33 – 7.60, respectively. The overall acceptability was rated as 5.33 – 7.60 suggesting that T6 with blends of50% cashew apple and 50% mango (50:50) with added citric acid (0.3%) rated the most acceptable for panelists. To sum up, the appropriate ratio of making jam was T6 as perceived by panelists in terms of color, sourness, sweetness texture, taste and overall acceptability of the final products. It is also important to note that increasing the level of mango puree in the formulation resulted in more yellowish color of the jams [45-47].
Treatment
Color
Odorns
Sourness
Sweetness
Texture
Taste
Overall Acceptability
T0
5.40c
5.60
5.13c
5.67b
5.53b
5.33b
5.33c
T1
5.87b,c
5.93
6.00b,c
5.93b,c
6.27a,b
6.20a,b
6.20b,c
T2
6.00a,b,c
5.60
6.13b,c
6.20b,c
6.40a,b
6.47a,b
6.47b
T3
6.00a,b,c
5.47
6.73a,b
6.00a,b
6.80a
6.47a,b
6.47a,b
T4
6.53a,b,c
6.00
5.53b,c
5.73b
6.40a,b
5.93b
5.93b,c
T5
6.87a,b
6.13
6.07b,c
6.27a,b
6.20a,b
6.33b
6.33b
T6
7.27a
6.53
7.53a
7.13a
7.27a
7.60a
7.60a
Values in the same column having different superscript are significantly different at 5% level of probability (p≤0.05)
T0 = 100% RCAP, 1% PT, 50% RS; T1 = 70% RCAP, 30% RMP, 0.1% CA, 1% PT, 50% RS; T2 = 70% RCAP, 30% RMP, 0.2% CA, 1% PT, 50% RS; T3 = 70% RCAP, 30% RMP, 0.3% CA, 1% PT, 50% RS; T4 = 50% RCAP, 50% RMP, 0.1% CA, 1% PT, 50% RS; T5 = 50% RCAP, 50% RMP, 0.2% CA, 1%PT, 50% RS; T6 = 50% RCAP, 50% RMP, 0.3% CA, 1% PT, 50% RS
Conclusion
This study revealed that acceptable jams can be produced from cashew apple blended with mango or other tropical fruits with relatively high antioxidant properties. The physicochemical and antioxidant properties were significantly different among samples. If properly processed, the jams undoubtedly will have long storage life due to low acid values coupled with high sugar content preventing growth of food microorganisms. The most acceptable treatment for cashew apple-mango blend jam was T6 (50:50). Addition of 0.3% citric acid in the formulation is necessary to enhance the sensory attributes of jams especially texture and taste. Utilization of cashew apple into high valued products like jams or other similar products will not only help in the reduction of wastage of these fruits, but it will also serve as additional source of income for the local famers and the country as a whole.
Acknowledgement
The author is address their sincere thanks toCambodia Higher Education Improvement Project (Credit No. 6221-KH) for availability of fund in the work. Their thanks are also to Royal University of Agriculture for facilitate the fund.
Reference
- David CT, Prasad SM (2015) Value Added Product from Cashew Apple. Acta Hort, Proc. 1st IS on Cashew Nut, ISHS.
- Trongpanich K, Silavanich C, Lertpanapong S (1990) Jam from cashew apple. Kasetsart Journal. (Natural Science 24: 297-305.
- Emelike NJT, Akusu OM (2019) “Quality attributes of jams and marmalades produced from some selected tropical fruits”, Journal of Food Processing and Technology, 10: 790.
- AOAC (1995) Official Methods of Analysis, (16th Edn.), Association of Official AnalyticalChemists, Arlington, VA (1995).
- Soyer Y, Koca N, Karadeniz F (2003) Organic acid profile of Turkish whites grapes and grapes juices, Journal of Food Composition and Analysis 16: 629-636.
- AOAC (2000) Official Methods of Analysis. 17th Edn., Association of Official Analytical Chemists, Arlington, VA., USA.
- Kunst A, Draeger B, Ziegenhorn J (1988) D- Glucose. In Methods of Enzymatic Analysis (Bergmeyer, H. U., ed.), 3rd ed., Vol.VI, pp. 163- 172.
- Beutler HO (1988) D-Fructose. In Methods of Enzymatic Analysis (Bergmeyer, H. U., ed.), 3rd ed., Vol.VI, pp. 321-327, VCH Publishers (UK) Ltd., Cambridge, UK.
- Outlaw WH, Mitchell CT (1988) Sucrose. In Methods of Enzymatic Analysis (Bergmeyer, H. U., ed.), 3rd ed., Vol.VI, pp. 96-103, VCH Publishers (UK) Ltd., Cambridge, UK.
- Dubois M, Gilles KA, Hamilton JK., Rebers PA, Smith F (1956) Colorimetric method for determination of sugars and related substances, Analytical Chemistry, 280, 350-356.
- Food Chemicals Codex (1996) Food and Nutrition Board Institute of Medicine National, Academy of Sciences. 14th Edn., National Academy Press, Washington, DC., USA., pp: 33.
- Spiros P, Hondrodimou OL, Drosinos EH (2010) Development of the microbial community during spontaneous cauliflower fermentation, Food Research International 43: 1098-1103.
- Maturin L, Peeler JT (2001) Aerobic Plate Count. Bacteriological Analytical Manual. US Food and drug Administration.
- Marotz J, lubert C, Eisenbeiss W (2001) Effective Object Recognition for Automated Counting of Colonies in Petri Dishes (automated colony counting). Computer Methods and Programs in Biomedicine 66: 183–198.
- Mortor DR (2001) Aerobic Plate Count. In: Compendium of Methods for the Microbiological Examination of Foods. Ed: Frances Pouch Downes and Keith Ito, American Public Health Association, Washington, D. C. 20001-3710.
- Touma V, Stack ME, Mislivec PB, Koch HA, Bandler R (2001) Yeasts, Molds and Mycotoxins. Bacteriological Analytical Manual. US Food and drug Administration.
- Beuchat LR, Cousin MA (2001) Yeasts and Molds. Compendium of methods for the Microbiological Examination of Foods. American Public Health Association, Frances Pouch Downes, Keith Ito, Washington, DC.
- Feng P, Jinneman K, Weagant SD (2001) Escherichia coli. Bacteriological Analytical Manual. US Food and drug Administration.
- Kornacki JL, Johnson JL (2001) Escherichia coli. Compendium of Methods for the Microbiological Examination of Foods.American Public Health Association, Frances Pouch Downes, Keith Ito, Washington, DC.
- Andrews WH, Jacobson A, Hammack T (2001) Salmonella. Bacteriological Analytical Manual. US Food and drug Administration.
- Stone H, Sidel JL (1992) The roles of sensory evaluation in the food industry. Food Quality and Preference 23: 65-73.
- Talasila U, Vechalapua RR, Khasim BS (2011) Preservation and shelf life extension of cashew apple juice. Internet Journal of Food Safety 13: 275-280.
- AFNOR (2000) General guidelines for performing hedonic tests in a sensory or indoor sensory evaluation laboratory involving consumers. Compendium of standards 6: 1-60.
- Olufemi AO, Oluwaseun OG, Elizabeth OM, Grace OF (2018) “Functional jam production from blends of banana, pineapple and watermelon pulp,” International Journal of Food Science and Biotechnology, vol. 3: pp. 7–14.
- Al-Farsi M, Alasalvar C, Morris A, Baron M, Shahidi F (2005) “Compositional and sensory characteristics of three native sun–dried date (Phoenix dactylifera) Varieties grown in Oman,” Journal of Agricultural and Food Chemistry, vol. 53: pp. 7586-7591.
- Ellouze H, Belkacem A, Rekik B (2011) “Variation in physicochemical and sensory quality of sour orange (Citrus aurantium) marmalade from the Cap Bon region in North-East Tunisia,” Fruits, vol. 66: pp. 315-325.
- Esteve M, Frigola JA, Rodrigo C, Rodrigo D (2005) “Effect of storage period under variable conditions on the chemical and physical composition and colour of Spanish refrigerated orange juices,” Food and Chemical Toxicology, vol. 43: pp. 1413-1422.
- Oakenfull D, Glicksman M (1987) “Gelling agents,” CRC Critical Reviews in Food Science and Nutrition, vol. 26: pp. 1-25.
- Aissou H (2013) “Caractérisation et comparaison de trois types de pulpes (orange: Citrus sinensis, citron limon, pamplemousse: citrus maxima) et essai de fabrication de confitures,” Thèsed’ingénieuren technologiealimentaire, Université Mouloud Mammeri, Tizi Ouzou, Algerie, 2013.
- Igual M, Garcia–Martinez E, Camacho MM, Martinez-Navarrete N (2013) “Jam processing and storage effects on β-carotene and flavonoids content in grapefruit,” Journal of Functional Foods, vol. 5: pp. 736–744.
- May CD, Stainsby G (1986) “Factors affecting pectin gelation,” in Gums and Stabilisers for the Food Industry, G. O. Phillips, D. J. Wedlock, and P. A. Williams, Eds., pp. 515–523, Elsevier Applied Science, London, UK, 1986.
- Akinwale TD (2000) Cashew apple juice. “It’s uses in fortifying the nutritional quality of some tropical fruits”. European Food Research Technology 211: 205-207.
- Dupaigne P (1969) La Désamérisation des Produitsd’Agrumes par voieEnzymatique, InstitutFrançais des Auditeurs et Contrôleurs Internes, France.
- Iordanescu O, Alexa E, Roxana M, Mariana-Atena P (2012) “Bioactive compounds and antioxidant properties at different maturity stages of apple cultivars from Romania,” Journal of Food, Agriculture and Environment, vol. 10: pp. 147–151.
- Raghu V, Platel K, Srinivasan K (2007) “Comparison of ascorbic acid content of Emblica officinalisfruits determined by different analytical methods,” Journal of Food Composition and Analysis, vol. 20: pp. 529-533.
- Klopotek, Y, Otto K, Bohm V (2005) “Processing strawberries to different products alters contents of vitamin C, total phenolics, total anthocyanins, and antioxidant capacity,” Journal of Agricultural and Food Chemistry, vol. 53: pp. 5640–5646.
- Benmeziane F, Djermoune–Arkoub Boudraa AT, Bellaagoune A (2018) “Physicochemical characteristics and phytochemical content of jam made from melon (Cucumismelo),” International Food Research Journal, vol. 25: pp. 133–141.
- Gould GW (1989) Heat induced injury and inactivation. Inn Mechanism of Action of Food Preservation Procedures. G.W. Gould, (ed), Elsevier Applied Science, London, 1989 pp 173-117.
- APHA (2001) Compendium of methods for the microbiological examination of foods. American Public Health Association, Washington, DC.
- Danijela, B, Branka L, Verica D (2009) “Free radical scavenging activity and phenolic content in strawberry fruit and jam,” Agriculturae Conspectus Scientificus, vol. 74: pp. 155–159.
- Diop AG, Sakho M, Dornier M (2005) Study of the baobab fruit and the transformation of the pulp into nectar. Regional Scientific and Pedagogical Seminar (GP3A) at the University of Ouagadougou (Burkina- Faso) (2005): 6.
- Plessi M, Bertelli D, Albasini A (2007) “Distribution of metals and phenolic compounds as a criterion to evaluate variety of berries and related jams,” Food chemistry, vol. 100: 419–427.
- Ranganna S (1986) Handbook of analysis and quality control for fruit and vegetable products. McGraw-Hill, New Delhi, India.
- Sadasivam S, Manickam A (2008) Biochemical methods. New Age International, New Delhi, India.
- Stone H, Sidel JL (1993) Sensory evaluation practices. Elsevier Academic Press, San Diego, USA.
- Teresa Escribano-Bailón M, Celestino S-B, Rivas-Gonzalo JC (2004) Anthocyanins in cereals. Journal of Chromatography A 1054: 129-141.
- Touati N, Tarazona-Diaz MP, Aguayo E, Louaileche H (2014) “Effect of storage time and temperature on the physicochemical and sensory characteristics of commercial apricot jam,” Food Chemistry 145: 23–27.
- Waterhouse A (2002) Determination of total phenolics. In: Wrolstad RE (ed) Current protocols in food analytical chemistry. John Wiley and Sons, New York, pp I.1.1.1–I.1.1.8.
