Publication Information
Frequency: Continuous
Format: PDF and HTML
Versions: Online (Open Access)
Year first Published: 2019
Language: English
| Journal Menu |
| Editorial Board |
| Reviewer Board |
| Articles |
| Open Access |
| Special Issue Proposals |
| Guidelines for Authors |
| Guidelines for Editors |
| Guidelines for Reviewers |
| Membership |
| Fee and Guidelines |
 |
Organic Aquaculture Production in Italy from 2015 to 2018: Species Production and Nutritional Quality Aspects
Domitilla Pulcini, Luca Buttazzoni, Sebastiana Failla, Michela Contò, Fabrizio Capoccioni*
Consiglio per la Ricerca in Agricoltura e l’Analisi dell’Economia Agraria, Centro di Ricerca di Zootecnia e Acquacoltura, Via Salaria 31, 00015 Monterotondo (Rome), Italy
Received Date: February 13, 2020; Accepted Date: February 20, 2020; Published Date: March 07, 2020
*Corresponding author: Fabrizio Capoccioni, Consiglio per la Ricerca in Agricoltura e l’Analisi dell’Economia Agraria, Centro di Ricerca “Zootecnia e Acquacoltura”, Via Salaria 31, 00015 Monterotondo (Rome), Italy.
Citation: Pulcini D, Buttazzoni L, Failla S, Contò M, Capoccioni F (2020) Organic Aquaculture Production in Italy from 2015 to 2018: Species Production and Nutritional Quality Aspects. Jr Aqua Mar Bio Eco: JAMBE-101. Tel: +390690090263, 3470852870; Email: fabrizio.capoccioni@crea.gov.it
Abstract
The present study aims a comprehensive description of the Italian organic aquaculture sector, within the national aquaculture framework, in terms of production units and volumes during the four years period 2015-2018. This survey allowed to collect results about species produced and farm number and distribution at regional level. During the field activities a first assessment of nutritional quality of gilthead seabream (Sparus aurata L.), one of the most important marine fish species farmed in Italy, was carried out and evidenced a fatty acids signature comparable with conventional fillets, with even PUFA W-3 (EPA and DHA) and W-3/W-6 yield values significantly higher. From 2015 to 2018 total Italian aquaculture production remained stable, while organic seafood production slightly increased. In 2016, Italy was the fourth larger producer of farmed seafood in UE, and among the first five producers of organic seafood (8,196.5 tons, in particular bivalve molluscs and rainbow trout). Organic aquaculture is considered as a potentially fast-growing sector. In Italy, the demand for organic aquaculture products, in particular mussels, is increasing.
Keywords: Aqua feed; Gilthead Seabream; Organic Mariculture; Polynsaturated Fatty Acids; Sustainability
Introduction
Driven by increasing human population, supposed to reach 9.6 bln in 2050, resulting higher demand for seafood (finfish and shellfish) cannot be met by fisheries only. Aquaculture is a credible substitute for fisheries: since 1980, aquaculture production grew at an average annual rate of about 8%, contributing nearly half of the total seafood supply in 2016 (FAO 2018) [1]. Since 1960, the annual increase in seafood consumption worldwide overcame population growth (from 9 kg in 1961 to 20 kg in 2016 –FAO 2018), exceeding meat consumption, and (all terrestrial species together). Estimates for 2030 forecast further growth (FAO 2018). Aquaculture needs to nearly double in the next 15 years to ensure the global seafood supply (World Bank 2013) [2], but in order to achieve the benefits of a robust aquaculture sector over the long term industry must respect ecological limits to growth.
Although aquaculture production may have an adverse impact on the environment, on disease outbreaks and on small pelagic fish stocks, used as fishmeal source [3, 4] most of the available data indicate that aquaculture has a lower ecological footprint (in terms feed efficiency, eutrophication, freshwater consumption and land use) than other animal farming systems [5-7].
Aquaculture represents one of the pillars of the EU’s Blue Growth strategy. EU fosters the sustainable development of the sector that, however, is stagnating, in contrast with the rest of the world [8, 9]. Local and sustainable seafood is even more requested by European consumers [10]. Specificities of EU aquaculture products (attention to animal health and welfare, high consumer protection standards, reduction of environmental impacts) must be correctly addressed and communicated to consumers, thus improving their competitiveness with imported products (COM (2013) 229 – Strategic Guidelines for the sustainable development of EU aquaculture) [11, 12].
The EU global organic market is growing at a very high rate (7.4% in 2014), and organic farmland increased by 7.5 million hectares in 2016, one million of which were in Europe. In 2016, after USA, Germany and France were the second and the third largest organic market across all products worldwide. Italy was the sixth country in this rating and Switzerland registered the highest per capita consumption of organic food worldwide in 2016 [13]. Production of sustainable and certified seafood has grown rapidly over the past decade, driven mainly by Japan, North America and Europe, and now represents a significant portion of global production. Almost 80% of certified seafood comes from wild catch production, reflecting its major role in the context of sustainability, but certified aquaculture has grown at an average rate of 76% per year from 2003 to 2015. Only 0.3% of the global supply for certified aquaculture came from organic production in 2015 (EUMOFA 2017) [14].
Organic aquaculture represents one of the models of sustainable aquaculture, combining high environmental standards and carefulness to animal welfare with intensive production. Organic aquaculture is getting established in the main organic food markets: European production increased by 30% annually from 1998 to 2007. This growth is the result of consumer and market reaction to concerns on sustainability, environmental impacts of aquaculture, poor texture of farmed fish, food contamination and animal welfare [15, 16]. However, the EU organic production was only 4.7% of the total aquaculture production in 2015 (EUMOFA 2017) [14], despite the expected growth was very higher [17, 18]. Several causes might be responsible of the slow growing of organic aquaculture: i) organic farms are less profitable and margin are not enough to cover over-costs linked to organic production [19]; ii) the delay with which regulations for production have been issued; iii) lack of harmonization of organic standards for aquaculture certification [20]. European organic regulation for aquaculture production came into force in 2007 (EC No. 834/2007) and was successively implemented by EC No. 710/2009. After a more than ten years process of review a text for new organic regulation has been approved (EU No. 2018/848) which shall enter into force on 1st January 2021. It represents an important regulatory framework for guiding and controlling food processing activities for organic food, including aquaculture products [21, 22].
According to the last available EUMOFA report (2017), the top species produced in Europe were salmon (9% of total EU salmon production), mussel (4%), carp (8%), trout (3%), sea bass and seabream (1%). Italy was rated sixth among the ten countries with the largest aquaculture production worldwide, with about 6,000 tons in 2016 [13]. Considering the annual relative increment of organic aquaculture production from 2012 to 2015, Italy experienced a very high increase between 2012 and 2013 (166%), followed by a decrease of 44% in 2013-2014 and of 4% in 2014-2015. Such great oscillation is mainly due to the small number of organic farms which has more than doubled from 17 to 41 between 2013 and 2018 [23, 24].
In this background, since the standards for organic production have been developed only in recent times and fish feed improvement is ongoing, data about nutritional quality of organic fillets of main farmed species are scarce. Up to date, many studies on the substitution of fishmeal and fish oil, declining in availability and increasing in prices, with vegetable protein sources and plant derived oils in formulated feed for aquaculture have shown limited effects on growth and feed conversion efficiency by fish. However, at the same time, several authors brought to the attention significant effects on the fatty acid composition of the fish fillets [25], mainly affected by fish oil substitution. Vasconi et al. (2017) [26] highlighted how the reduction in the use of marine-derivate ingredients in the feed formulation for marine fish had determined a modification in the fatty acid profile of gilthead seabream, with a prevalence of oleic and linoleic acid and a decrease of EPA and DHA in farmed fish. The substitution of fishmeal and fish oil with plant alternatives in conventional feedstuffs has been deeply investigated in the last years, whilst nutrition in organic aquaculture has been poorly studied [16]. European regulation requires, for carnivorous species, aquafeeds consisting of fishmeal and fish oil (certified as coming from sustainable fisheries) to maintain animal health and satisfy specific nutritional needs. Plant feed ingredients coming from organic production can be added up to a rate of 60%. Replacement of fish oil with plant derived oils does not seem to affect growth, but the fatty acid profile of the final product is the result of the diet composition, thus reduction in long chain PUFAs could be observed [25, 27, 28].
The aims of this paper were: 1) to present the most updated picture of the Italian organic aquaculture production (species volumes produced, number of farms and distribution) at regional level, and compare these data with overall production, in order to highlight possible trends; 2) to carry out a first assessment of fatty acids composition in organic fillets of gilthead seabream farmed in a certified off-shore mariculture compared to conventional ones. A well-balanced fatty acids composition (W-3W-6 in particular) is the most important nutritional characteristic in fish fillets, giving an added value to these products. Therefore, such indication is needed to evaluate the nutritional quality of the final product and the intrinsic value carried out by organic aquaculture products.
Materials and Methods
Aquaculture Production Data
Data on total Italian aquaculture production (2015-2018) were obtained from national data collection program under Reg. EC No. 762/2008. According to this Regulation, the survey was a census personally carried out by data collectors in all the single aquaculture companies registered and active in Italy. Aquaculture production data means the live weight in tons at first sale, which issued as a proxy for the real off-farm production volume. This criterion includes exported production and excludes unsold production. Live weight includes all shells and bones. Only production for human consumption is considered, while ornamental or functional species, as well as feed production, are excluded.
Detailed data on Italian organic aquaculture (number of certified farms, certification bodies, species produced, total and commercialized annual production) were commissioned for the first time by the Italian Ministry of Agriculture under the BioBreed-H2O Project for the biennium 2015-2016. The list of certified farms has been built cross-referencing data from the aquaculture data collection (EC No. 762/2008) and checklists provided both by certification bodies and by the National Information System on Organic Agriculture (SINAB). The survey was a census, and each company was directly contacted in order to fill a questionnaire about information above mentioned. Total organic aquaculture production of main species has also been preliminary collected under the national data collection program (Reg. EC No. 762/2008) in the 2018.
Nutritional Quality of Organic Seabream Fillets
A first assessment of nutritional quality of organic gilthead seabream (Sparus aurata, L.) was carried out on samples provided by a commercial Italian mariculture, Cooperativa Maricoltura e Ricerca, located at Capraia island (within the National Park of Tuscan Archipelago), Tuscany. The farm has eight 22 m diameter sea cages located in the Portovecchio bay, over a 40 m depth sea bottom. Fish density did not exceed 15 kg×m-3. One of the cages was assigned to seabream organic production, certified by CCPB S. r. l., based on EC No. 834/2007 (recently amended by EU No. 2018/848, entering into force in 2021) and EC No. 710/2009. Conventional and organic seabream fillets, differing only for the feed formula, were compared in terms of nutritional quality. Organic fish was fed with a certified organic aqua feed for marine species (Skretting Emerald Marine®). Conventional fish was fed with a fish meal and oil based aqua feed for marine fish (Skretting MRF Marine 3P®). A total of eight specimens at commercial size (n=4 for each treatment, conventional vs. organic) were sampled and live chilled in ice bath during commercial catch operation. Fish were filleted and fillets stored at -80°C until laboratory analysis to evaluate nutritional quality were carried out. Proximate analysis (AOAC, 1995) [29], fatty acids composition [30] and total phosphorous content (AOAC 1995) were determined in organic and conventional fish fillets and feedstuffs. Non-parametric Mann-Whitney test was performed to test differences between treatments in fillet lipid content and between each fatty acid content. Statistics were performed using Stat view (SAS).
Results and Discussion
Italian Aquaculture Production (2015-2018)
Total Italian aquaculture production during the four years period considered in this study remained almost constant between 142,000 and 156,000 tons of live weight. Crustacean farming in Italy is marginal and total production during the reference period ranged between 7 and 15 tons. On the other hand, fish production was stable (~50,000-55,000 tons), while mollusc sector displayed the highest production but widest fluctuations too (for instance an increase of about 11,000 tons between 2016 and 2017). This may be explained by fluctuating environmental factors that are able to condition shellfish annual production by affecting both natural recruitment and growth performances (i.e. water temperature, pH, phytoplankton concentration) [31, 32]. Moreover, also adverse weather conditions could impact shellfish harvesting and production, since in Italy traditional mussel farming is mainly artisanal [33].
Total organic aquaculture production almost doubled from 2015 (5,477.2 tons) to 2018 (11,163.6 tons). In 2015, 29 organic aquaculture facilities were certified, but only 26 effectively producing. In 2016, the number of certified facilities remained substantially the same (31), 25 of which effectively operating (BioBreed-H2O Research Project) [34]. The most represented sector in 2015 and 2016 was mussel farming, with respectively 12 and 14 certified farms (10 active in 2016), followed by aquaculture in transitional waters (“vallicoltura”, i.e. fish farming in coastal lagoons, 11 and 10 certified “valli”, respectively in 2015 and 2016), mariculture (just one off-shore sea-cage system in 2015 and three, two of which active, in 2016), and three trout farms. In 2018 the number of organic certified farms was 31 (data from national aquaculture data collection – EC No. 762/2008). For the 2015-2016 and 2018, a deeper detailed picture was achieved about organic production, as reported below.
Molluscs
Italian certified farms in 2016 produced three bivalve molluscs’ species: Mytilus galloprovincialis, Ruditapes philippinarum and Ostrea edulis. The 14 facilities were located mainly in the north of Italy (Veneto and Emilia Romagna), only one in the south of the country (Puglia) (Figure 1). Compared to 2015, the number of certified farms decreased from 19 to 15. For 2015, data about annual production volumes were available for 12 farms, while for 2016 nine farms provided data (Table 1). Mussel production has steadily increased, with 4,877.0 tons in 2015 (5.3% of total molluscs’ aquaculture production), 6,143.15 in 2016 (7.3% of total molluscs’ aquaculture production) and 7758, 2 in 2018 (8.4% of total molluscs’ aquaculture production). Clam farming had an exponential increase, from 20.0 tons in 2015, 278.6 in 2016, to 2 and 290.7 in 2018. Such increase can be explained by the fact that in 2017 a certified clam hatchery started the production and supplied several organic farms in the upper Adriatic coast. Oyster represent a very small and steadily production in Italy (4.5-5.0 tons), but demand for European flat oyster is increasing due to the health issues plaguing cupped oyster (Crassostea gigas). One of the molluscs farming was specifically dedicated to larval clam farming, and production started in 2017.
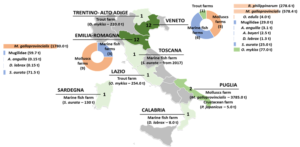
Figure 1: Number and geographical distribution of Italian organic farms and production volumes (metric tons) per species per region (year 2016).
Fish
Italian organic fish aquaculture production is dominated by rainbow trout (Oncorhynchus mykiss). Organic production of this species was constant: 349.8 tons in 2015 (1% of total rainbow trout Italian aquaculture production – 36,345.0 tons), 353.1 tons in 2016 (1.5% of total rainbow trout Italian aquaculture production – 35,655.0 tons) and 322.5 tons in 2018 (1.05% of total rainbow trout Italian aquaculture production – 33,806.1 tons). Three farms were certified for organic production in 2016, located in Lazio, Veneto and Trentino-Alto Adige (Figure 1).
Organic aquaculture of marine fish showed an appreciable increase in 2018 with respect of 2015 and 2016, considering that in 2018 only main species have been assessed (572.9, 595.5, 669.5 tons for 2015, 2016 and 2018, respectively). Italian certified farms in 2016 produced two marine fish species (Sparus aurata and Dicentrarchus labrax), several brackish species (Mugilidae and Atherina boyeri) and one catadromous species (Anguilla anguilla), some of them with very marginal production volumes. The 12 facilities were located mainly in the north of Italy (Veneto and Emilia Romagna), two in the centre (Toscana and Sardegna), and one in south Italy (Calabria) (Figure 1). Three of the above-mentioned facilities are off-shore sea cages, the other nine are certified “valli”. Data about annual production volumes were available for 10 farms. Production was dominated by gilthead seabream, with 133.8 tons in 2015 (1.8% of total S. aurata aquaculture production – 7,350.00 tons), 137.0 in 2016 (1.8% of total S. aurata aquaculture production – 7,600.00 tons) and 222.5 in 2018 (3% of total S. aurata aquaculture production – 7,316.3 tons). European seabass had a marginal role in organic production in 2015 and 2016 (9.5 and 10.4 tons respectively), but in 2018 production reached 124.5 tons (2.2% of total D. labrax aquaculture production – 5, 738, 1). A certified mariculture, in fact, finished the growth phase and started to sell product. Mullets, sand smelt and European eel were typical brackish water productions, with a limited local market and very marginal production (Table 1).
2015
2016
2017
2018
Total aquaculture production (tons)
148,138.8
141,897.8
156,307.2
142,726.4
Fish
55,251.7
53,803.8
55,271.5
50,163.0
Mollusc
92,872.0
88,805.6
99,738.2
92,550.8
Crustacean
15.2
8.4
7.4
12.6
Total organic aquaculture production (tons)
5,477.2
8,960.4
NA
9,765.6
Number of certified organic farms
29
31
NA
31
Oncorhynchus mykiss
349.8
353.1
322.5
Dicentrarchus labrax
9.5
10.4
124.5
Sparus aurata
133.8
137.0
222.5
Anguilla anguilla
1.2
3.6
NA
Mugilidae
78.6
88.9
NA
Atherina boyeri
0.0
2.5
NA
Salvelinus
1.0
0.0
NA
Mytilusgallo provincialis
4,877.0
8,092.4
7,758.2
Ostrea edulis
1.3
4.0
13
Ruditapes philippinarum
20.0
263.6
1,320.4
Penaeus japonicus
5.0
5.0
4.5
Crustaceans
Italian crustacean production, even if increasing in the last years (from 9.4 tons in 2013 to 15.2 tons in 2016), is of minor relevance respect to the other productions. There is only one organic extensive farm producing Penaeus japonicus (about 5 tons, between 2015 and 2018), located in Puglia.
Nutritional Quality of Organic Gilthead Seabream
Results of nutritional quality analysis of feedstuffs and gilthead seabream fillets are detailed in Table 2. Statistical differences were tested between S. aurata fillets organically and conventionally farmed. Crude protein, lipids and ash did not show any significant difference between groups, while, among FAs, W-3 and W-3/W-6 yield values were significantly higher in organic fillets. Focusing on single FAs, organic fillets showed significantly higher amounts of PUFA W-3 (EPA: 145.36 ± 36.0 mg×100g-1 in conventional fillets versus 371.15 ± 56.57 mg×100g-1 in organic ones; DHA: 421.31 ± 120.96 mg×100g-1 in conventional fillets versus 762.10 ± 96.32 mg×100g-1 in organic ones), and on the other hand, W-6 PUFAs displayed significantly lower values with respect of those conventionally farmed.
Although these differences could primarily be due to aqua feeds formulations, the case of organic gilthead seabream investigated in this study is an example of how combined advances in organic feed formulation and good farming practices could result in higher levels of essential W3 fatty acids (EPA, DPA and DHA) (Table 2). This leads to a more balanced W3/W6 ratio, as previously reported for organic seabream juveniles [35], and as recommended in order to prevent many chronic diseases of high prevalence in Western societies [36]. SL = 32.35 ± 1.63 W = 882.07 ± 84.86 SL= 29.25 ± 0.96 W = 659.50 ± 26.15
Conventional Aquafeed
Organic Aquafeed
Conventional Seabream
Organic Seabream
(n = 8)
(n = 8)
Dry Matter
92.67 %
91.34 %
28.29 %
25.53 %
Moisture
7.33 %
8.66 %
74.47 %
71.71 %
Ash
6.83 %
10.49 %
1.53 %
1.33 %
Crude Protein
64.82 %
59.61 %
19.01 %
22.07 %
Crude Fiber
3.5 %
3.0 %
0.0 %
0.0 %
Lipid Content
17.52 %
18.24 %
4.99 ± 1.92 %
4.89 ± 0.49 %
Phosphorous
0.94
1.47
221.12 ± 37.11
281.12 ± 22.86*
SFA
15.35 %
21.95 %
17.23 ± 0.70 %
19.04 ± 0.48 %
MUFA
39.75 %
27.13 %
41.71 ± 0.92 %
34.35 ± 0.98 %
PUFA
44.89 %
50.92 %
41.07 ± 1.51 %
46.61 ± 1.11 %
W-6
24.87 %
24.91 %
18.77 ± 0,30 %
12.63 ± 0.91 %
W-3
19.54 %
25.4 %
21.46 ± 1.34 %
33.19 ± 1.94 %*
EPA
3.59 %
6.80 %
2.11 ± 0.10 %
5.76 ± 0.58 %
DHA
2.78 %
3.54 %
6.27 ± 0.70 %
12 ± 1.12 %
W-3W-6
0.79
1.02
1.14
2.63*
SL = Standard Length (cm); W = Weight (g). * indicates statistically significant differences (p < 0.05, Mann-Whitney test).
Moreover, in organic seabream fillets, higher, even if not statistically significant, levels of phosphorus have been found. Phosphorous is a chemical element that is essential to life because of its role in numerous key molecules, required in large amounts by living organisms. Although results obtained are limited to a single Italian organic fish farm, this case study is emblematic: organic certification symbolizes sustainability of raw materials used for feed formulation, fish welfare and nutritional quality of end products.
Conclusions
Organic production should combine best environmental and climate action practices, high level of biodiversity, the preservation of natural resources and the application of high animal welfare standards and high production standards (EC No. 834/2007). Data about Italian organic aquaculture collected from 2015 to 2018 showed that this production is still a small percentage of total aquaculture production. This situation is consistent with European markets, where it remains at low volumes in absolute terms [19]. At present, the national aquaculture statistics data collection under Regulation (EC) No 762/2008 does not foresee any specific request for reporting data on organic production (i.e., volumes in tons, value in euro/tons and number of production units). In fact, data collection about organic seafood production has been carried out only under specific and time-limited surveys, but, considering that this sector is relatively young and the expected growth is high [37], such data should be included within the EUROSTAT yearly data collection, in order to monitor the evolution of European organic aquaculture.
Concerning the nutritional qualities of organic final products, further research on the effects of fish diets on the organoleptic characteristics of fillets are needed to give an added value to final products, in order to improve competitiveness and profitability of organic fish farming.
Disclosure Statement: The authors declare that they have no conflict of interest or benefit that would be arisen from the direct applications of this research.
Ethical Approval: This article does not contain any studies with animals performed by any of the authors.
Acknowledgments: This work was supported by the Italian “Ministero delle politiche agricole, alimentari e forestali (Mipaaf)” [Project BioBreed-H2O, DM n. 89486; Project AQUADATA; DM n.22660].
References
- FAO (2018) The State of World Fisheries and Aquaculture. Food and Agriculture Organization of the United Nations, Rome.
- World Bank 2013 Fish to 2030. Prospects for Fisheries and Aquaculture. Agriculture and environmental services discussion paper No. 3. Washington, DC.
- Naylor RL, Goldburg RJ, Primavera JH, Kautsky N, Beveridge MCM, et al, (2000) Effect of aquaculture on world fish supplies. Nature 405:1017-1024.
- Sapkota A, Sapkota AR, Kucharski M, Burke J, McKenzie S, et al. (2008) Aquaculture practices and potential human health risks: current knowledge and future priorities. Environ Int 34: 1215-1226.
- Boyd CE, Tucker C, Mcnevin A, Bostick K, Clay J (2007) Indicators of resource use efficiency and environmental performance in fish and crustacean aquaculture. Rev Fish Sci 15: 327-360.
- Hall SJ, Delaporte A, Phillips MJ, Beveridge M, O’Keefe M, et al. (2011) Blue frontiers: Managing the Environmental Costs of Aquaculture. WorldFish Center, Penang, Malaysia.
- Lorenzen K, Beveridge MCM, Mangel M (2012) Cultured fish: Integrative biology and management of domestication and interactions with wild fish. Biol Rev 87: 639-660.
- EU 2007 Council Regulation (EC) No 834/2007 of 28 June 2007 on Organic Production and Labelling of Organic Products and Repealing Regulation (EEC) No 2092/91. Official Journal of the European Union, Luxembourg.
- EU 2009 Commission Regulation (EC) No 710/2009 of 5 August 2009 Amending Regulation (EC) No 889/2008 Laying Down Detailed Rules for the Implementation of Council Regulation (EC) No 834/2007, as Regards Laying Down Detailed Rules on Organic Aquaculture Animal and Seaweed Production. Official Journal of the European Union, Luxembourg.
- Zander K, Feucht Y (2018) Consumers’ Willingness to Pay for Sustainable Seafood Made in Europe. J int food agribus mark 30: 251-275.
- COM 2013 229 final. Communication from the Commission to the European Parliament, the Council, the European Economic and Social Committee and the Committee of the Regions. Strategic Guidelines for the sustainable development of EU aquaculture.
- COM 2012 494 final. Communication from the Commission to the European Parliament, the Council, the European Economic and Social Committee and the Committee of the regions. Blue growth. Opportunities for marine and maritime sustainable growth.
- Willer H, Lernoud J (2018) The World of Organic Agriculture. Statistics and Emerging Trends 2018. Research Institute of Organic Agriculture (FiBL), Frick and IFOAM – Organics International, Boon.
- EUMOFA 2017 EU organic aquaculture.
- Mente E, Karalazos V, Karapanagiotidis IT, Pita C (2011) Nutrition in organic aquaculture: an inquiry and a discourse. Aquacult Nutr 172011e798e817.
- Mente E, Stratakos A, Boziaris IS, Kormas KA, Karalazos V, et al. (2012) The effect of organic and conventional production methods on seabream growth, health and body composition: a field experiment. Sci Mar 76: 549-560.
- Nizza A (2012) What future for organic aquaculture? J Aquacult Res Dev 3: 103.
- Prein M, Bergleiter S, Ballauf M, Brister D, Halwart M, et al. (2012) Organic aquaculture: the future of expanding niche markets. In: Subashinghe RP, Arthur JR, Bartley DM, De Silva SS, Halwart M, Hishamunda N, Mohan CV, Sorgeloos P (Eds.). Farming the Waters for People and Food. Proceedings of the Global Conference on Aquaculture 549-567.
- Gambelli D,Vairo D,Solfanelli F,ZanoliR (2019) Economic performance of organic aquaculture: a systematic review.
- Lembo G, Jokumsen A, Spedicato MT, Facchini MT, Bitetto I (2018) Assessing stakeholder’s experience and sensitivity on key issues for the economic growth of organic aquaculture production. Mar Policy 87: 84-93.
- UN 2013 Department of Economic and Social Affairs, Population Division. World Population Prospects: The 2012 Revision, key findings and advance tables. Working Paper No. ESA/P/wp.227.
- UN 2015 Transforming Our World: The 2030 Agenda for Sustainable Development (A/RES/70/1). UN, New York, USA.
- SINAB 2018. BIO in cifre – Anticipazioni 2018.
- Sicuro B (2019) An overview of organic aquaculture in Italy. Aquaculture 509: 134-139.
- Glencross BD (2009) Exploring the nutritional demand for essential fatty acids by aquaculture species. Rev Aquacult 1: 71-124.
- Vasconi M, Caprino F, Bellagamba F, Moretti VM (2017) Fatty acid composition of gilthead seabream (Sparus aurata) fillets as affected by current changes in aquafeed formulation. Turk J Fish Aquat Sc 17: 451-459.
- Bell JG,Waagbø R (2008) Safe and nutritious aquaculture produce: benefits and risks of alternative sustainable aquafeeds, In: Holmer M et al. (Eds.), Aquaculture in the Ecosystem. Springer, Netherlands, pp 185-225.
- Turchini GM, Torstensen BE, Ng W-K (2009) Fish oil replacement in finfish nutrition. Rev Aquac 1: 10-57.
- AOAC (1995) Official Methods of Analysis. 16th Edition, Association of Official Analytical Chemists, Washington DC.
- Folch J, Less M, Stanley HS (1957) A simple method for the isolation and purification of total lipids from animal tissues. J Biol Chem 226: 497-509.
- Le Corre N, Martel AL, Guichard F, Johnson LE (2013) Variation in recruitment: Differentiating the roles of primary and secondary settlement of blue mussels Mytilus spp. Mar Ecol Progr Ser 481: 133-146.
- Kapsenberg L, Miglioli A, Bitter MC, Tambutte´ E, Dumollard R, et al. (2018) Ocean pH fluctuations affect mussel larvae at key developmental transitions. Proc R Soc B 285: 20182381.
- Caroppo C, Giordano L, Palmieri N, Bellio G, Bisci AP, et al. (2012) Progress towards sustainable mussel aquaculture in Mar Piccolo, Italy. Ecology and Society 17: 10.
- BioBreed-H2O Research Project.
- Capoccioni F, Contò M, Failla S, Buttazzoni L, Pulcini D (2017) Growth of wild gilthead seabream (Sparus aurata) juveniles for organic aquaculture. Isr J Aquacult-Bamid.
- Simopoulos AP (2002) The importance of the ratio of omega-6/omega-3 essential fatty acids. Biomed Pharmacother 56: 365-379.
- Willer H, Lernoud J (2019) The World of Organic Agriculture. Statistics and Emerging Trends 2019. 20 edition. Research Institute of Organic Agriculture FiBL and IFOAM Organics International, Frick and Bonn.
