
OCT4 Expression Regulated Apoptosis and Cell Cycle in Myeloma Cells
Sorush Niknamian1, 2, 3*
1Department of Cell and Molecular Biology, Royal Society of Biology (RSB), Washington DC, USA
2Board Member of Weston A Price Foundation, Washington DC, USA
3Member of Federal Health Professionals at US Army Forces of the United States of America, USA
*Corresponding author: Sorush Niknamian,
Department of Cell and Molecular Biology, Royal Society of Biology (RSB), Washington DC, USA
Board Member of Weston a Price Foundation, Washington DC, USA
Member of Federal Health Professionals at US Army Forces of the United States of America, USA. Email: so.niknamian@gmail.com
Citation: Niknamian S (2019) OCT4 Expression Regulated Apoptosis and Cell Cycle in Myeloma Cells. Curr Res in Onco: CRIO-107.
Abstract
Purpose: OCT4 gene is specifically expressed in embryonic stem cells and plays a very important role in the proliferation, differentiation, and self-renewal of these cells. The abnormal expression of the OCT4 gene has been observed in most malignancies. Expression of this gene can affect the proliferation and apoptosis of malignant cells by activating various signaling pathways. The proliferation and excessive accumulation of myeloma cells in the bone marrow causes the essential complications of multiple myeloma. Genetic changes and mutations play a role in unscheduled proliferation and diminishing of the apoptosis of the myeloma cells.
Material and methods: In this study, the expression of the OCT4 gene by quantitative PCR and its effects on proliferation, apoptosis, and cell cycle of the myeloma cells by flow cytometry was investigated.
Results: The results of our study indicated that the myeloma cells express the OCT4 gene; and inhibition of the OCT4 gene by siRNA reduced its expression. The siRNA treated myeloma cells indicated decreased proliferation and increased apoptosis.
Conclusion: As with studies in other malignancies, our study also revealed that the OCT4 gene was expressed in the myeloma cells, with evidences of increased proliferation and reduced apoptosis in these cells.
Keywords: Apoptosis; Cell Cycle; Myeloma Cell; OCT4; siRNA
Introduction
Multiple myeloma (MM) is a malignant plasma-cell proliferative disorder with heterogeneous cytogenetic in bone marrow [1]. More than 10% of bone marrow cells are clonal plasma cells [2]. MMis diagnosed with CRAB syndrome, which includes hypercalcemia, kidney failure, anemia, and bone lesions [3]. These abnormalities in the patient are caused by Clonal proliferation of myeloma cells in bone marrow [4]. Various clinical manifestations, variable molecular characteristics, and response to different treatments in patients with MM are observed due to genomics changes and oncogenic somatic mutations [5]. These mutations and genetic alteration cause incompetence in proliferation and apoptosis of the myeloma cells. CCND (Cyclin D), FGFR3 (Fibroblast growth factor receptor), TP53 and c-MYC are the most important genes that change in myeloma cells. Dysregulation of cyclin D gene expression is the most important unscheduled proliferation factor in myeloma cells [6]. The FGFR3 expression increases the proliferation and prevents apoptosis in the myeloma cells [7]. c-MYC proto-oncogene and TP53 play a very important role in the cell cycle and apoptosis of the myeloma cells [8,9]. OCT4 gene expression can affect the signaling pathways of these genes [10]. Failure in proliferation mechanisms and apoptosis and the retention of their self-renewal potential causes the accumulation of myeloma cells in the bone marrow and complications of the disease [11]. Many studies have shown that OCT4 is expressed in human malignancies and plays an important role in tumorigenesis, increasing the proliferation potential and aggressive cancer cells [12]. OCT4 gene plays a very important role in a large number of signaling pathways [13]. The OCT4 in humans is located on chromosome 6 (6p21.31) and is naturally expressed in the early stages of development and during embryonic development [14]. It plays a major role in maintaining the self-renewal of fetal cells, cell proliferation and cellular differentiation [15]. In this study, the expression of the OCT4 gene and its effect on myeloma cells proliferation and apoptosis have been investigated.
Materials and Methods
Cell Lines and Cell Culture
RPMI8226 and U266 cell lines (Cell bank of hematology department, Tarbiatmodares university, Tehran) were grown in complete media consisting of RPMI1640 (Gibco), 2mM L-glutamine (Gibco), 50 U/ml penicillin (Gibco), 50µg/ml Streptomycin (Gibco), and 10% inactivated fetal bovine serum (FBS) (Gibco). The cells were cultured in an incubator filled with 5% CO2 at a temperature of 37˚C.
Small Interfering RNA (siRNA) Experiments
The small interfering RNA (siRNA) against OCT4 (Catalog N: AM16708, Assay ID: 115304, Ambion), the siRNA negative control (Catalog N: AM4621, Ambion), and the lipofectamine RNAiMAXreagent (Thermo Fisher Scientific, USA) were purchased.
Myeloma cells siRNA transfection was performed according to the “LipofectaminRNAiMAX Reagent Protocol” (Thermo Fisher Scientific, USA). Briefly, to prepare the siRNA-lipofectamine complex per well of a 12-well plate, in a tube 5Pmol of siRNA was diluted in 50 µl of Opti-MEM medium (Invitrogen), and in another tube 2µl of lipofectamineRNAiMAX was diluted in 50µl of Opti-MEM medium. The contents of the siRNA and lipofectamine tubes were combined together and gently mixed, followed by 5 min incubation at room temperature.
The 100µl siRNA-lipofectamine complex was added to 2×10⁵ myeloma cells in each well and mixed well and incubated at a temperature of 37°C for 30min.After incubation, to each well was added 2ml of RPMI1640 medium with 10% FBS without antibiotics followed by incubation 37°C with 5% CO2 for 24 hours, 48 hours and 72 hours, respectively. After transfection, cells were analyzed for proliferation, cell cycle, apoptosis, and gene expression.
Real Time PCR Analysis of mRNA Expression
For real time RT-PCR procedures, the total RNA was extracted from myeloma cells using a RNX-Plus solution (SinaClon, Iran), according to the manufacturer’s protocol.
cDNA was synthesized from 1μg total RNA samples using 2-steps RT-PCR Kit (Vivantis). Amplification for real time RT-PCR was performed using RealQ Plus 2x Master Mix Green high ROX (Ampliqon) and aStepOne Real-Time PCR Systems (Applied Biosystems) for signal detection. The primer for OCT4 gene was designed from exon-exon junction and the primer sequences were for OCT4 (forward sequence: 5’-GGTGCCTGCCCTTCTAGGAATG-3’; revers sequence: 5’-TGCCCCCACCCTTTGTGTTC-3’) and β-actin (forward sequence: 5’-TGAAGATCAAGATCATTGCTCCTC-3’; revers sequence: 5’-AGTCATAGTCCGCCTAGAAGC-3’).The relative expression levels of OCT4 gene were compared with β-actin relative expression levels as a reference gene. Relative quantification of gene expression was evaluated using the 2-ΔΔCTmethod [16].
Cell Proliferation Assay
The proliferation of RPMI8226 and U266 cells, after transfections, was determined by using Orangu solution (Cell Guidance Systems).2×104 cells after being transfected by siRNA were seeded into each well of 96-well plates, followed by incubation at 37°C with 5% CO2 for 24 hours, 48 hours and 72hours, respectively. After each time point, 10μL of Orangu solution was added to each well. The plates were incubated for 4 hours at 37°C. The absorbance (OD) was measured using an Anthos 2020 microplate reader (Biochrom) at a wavelength of 450 nm.
Cell Cycle Analysis
Myeloma cells at a density of 2×10⁵ cells/well were treated with siRNA at 24 hours, 48 hours in 12-well plates. After each time point, cells were harvested from plate well and also the floating cells in the medium were collected. They were pelleted by centrifugation, washed twice with PBS, and Fixed in cold 70% ethanol for 30 min at a temperature of 4°C.After fixation, cells were washed in PBS and then incubated with PI (Propidium Iodide) staining solution containing 100μg/mL of RNase and 50μg/mL of PI in PBS, in the dark for 30minutes. Cellular DNA content and cell cycle was analyzed by the BD FACSCaliburflow Cytometer (BD Biosciences), BD Paint-A-Gate Pro software and BD FACSDiva™ software (BD Biosciences). The results were expressed as the percentage of cell population in each phase.
Flow Cytometry Analysis of Apoptosis
Apoptosis analysis of treated myeloma cells with siRNA for 24hours and 48hours was performed according to the manufacturer’s instructions (Annexin V Apoptosis Detection kit FITC, Invitrogen). Briefly, 2×10⁵myeloma Cells were washed with PBS and a binding buffer, and then re-suspended in100µl binding buffer containing 5μL of Annexin V-FITC and incubated at room temperature for 15mins in the dark. After incubation,the cells were washed with binding buffer again,re-suspended in 200µl binding buffer containing 5μL ofPropidium Iodide (PI) and incubated at room temperature for 5mins in the dark. Cells were analyzed using the BD FACSCalibur flow Cytometer (BD Biosciences), BD Paint-A-Gate Pro software and BD FACSDiva™ software (BD Biosciences). Data was expressed as percentage of unstained/single or double stain cells in four populations.
Statistical analysis
Data was analyzed using R version 3.4.3software [17]. Differences between groups were evaluated with analysis of variance (ANOVA) and Tukey test. Results were presented as means± standard deviation (SD). A value of P<0.05 was considered as significant to obtain the statistical significance between treated groups and controls.
Results
Effect of OCT4 siRNA on OCT4 Expression in Myeloma Cells
Expression of the OCT4 gene in the RPMI8226 and U266 myeloma cells is presented in (Figure 1.a). To confirm the accuracy of the expression of the OCT4 gene, human fibroblasts were used as a negative control and the NT2 embryo carcinoma cell line was used as a positive control for OCT4 gene expression.
The expression of OCT4 gene in RPMI8226 and U266 myeloma cells treated with siRNA and in untreated myeloma cells were measured by real time PCR as shown in (Figure 1.b). OCT4 gene expression was significantly decreased in siRNA treated RPMI8226 and U266 myeloma cells compared to the untreated RPMI8226 and U266 myeloma cells(P<0.05).
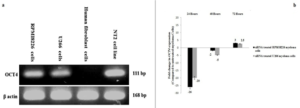
Figure 1: OCT4 siRNA reduced OCT4 expression on myeloma cells. (a) OCT4 and β actin expression was determined using RT-PCR on RPMI8226 and U266 cells. (b) Expression of OCT4 by RPMI8226 and U266 cells after 24, 48 and 72 hours of treatment with OCT4 siRNA. The indicated gene was analyzed using qRT-PCR and the results were normalized to β actin and related to untreated RPMI8226 and U266 cells.
OCT4 down Expression Decrease the Myeloma Cells Proliferation
OD level showed the proliferation rate of myeloma cells. Proliferation rate increased in RPMI8226 and U266 myeloma cells in three groups of untreated myeloma cells, siRNA treated myeloma cells, and siRNA negative control cells at 0, 24, 48 and 72 hours, respectively (Figure 2). As seen, proliferation rate in the two groups of untreated myeloma cells and the siRNA negative control cells in both RPMI8226(Figure 2.a) and U266 (Figure 2.b) cells was roughly identical and showed a uniform trend at the indicated times and no significant difference was observed in the tested times (p> 0.05).There was a one-stop in cell proliferation in the group of siRNA treated myeloma cells in the 24-hour period, and the OD level showed a significant decrease compared to untreated myeloma cells group (p <0.05).This proliferation stop in the first 24 hours caused a decrease in the cell count and, as a result, a decrease in OD level in 48 and 72 hours in the siRNA-treated myeloma cells group compared to the untreated myeloma cells group (p <0.05).
The number of cells counted at 0, 24, 48 and 72 hours in three groups of untreated myeloma cells, siRNA treated myeloma cells and siRNA negative control cells are presented in (Figure 2.c&d). As seen, the number of cells in the siRNA treated myeloma cells group was significantly reduced compared to untreated myeloma cells groups at 0, 24, 48 and 72 hours(p <0.05).There was no significant difference in the number of cells between untreated myeloma cells compared to the siRNA negative control group at the same times (p> 0.05).
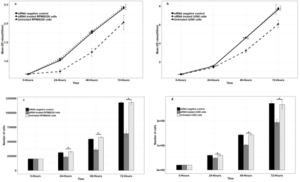
Figure 2: Effect of OCT4 siRNA on the proliferation of RPMI8226 myeloma cells and U266 myeloma cells. (a & b) was determined by Orangu kit OD assay. Data are shown as mean ± SD,*P<0.05. ( c& d) was estimated by cell number. Data are shown as mean ± SD,*P<0.05.
Decrease of OCT4 Gene Expression Induced Myeloma Cells Apoptosis by Annexin V-FITC/ PI Staining
The apoptosis of the RPMI8226 and U266 myeloma cells after 24 hours of treatments presented in (Figure 3). The reduction of the expression of OCT4 in the siRNA treated RPMI8226 myeloma cells group caused a significant increase in the percentage of Early apoptosis cells by 14.8%, Late apoptosis cells by 46.8%, and a decrease in the percentage of live cells by 34.7%in compared to the untreated RPMI8226 myeloma cells group by 5.6%, 2.7% and 87.5% of live cells (P <0.05) (Figure 3.a&b, Figure 4.a). The percentage of early apoptosis cells was reduced by 19%, late apoptosis cells was reduced by 13%, and the percentage of live cells was reduced by 66.9% in the group of siRNA-treated U266 myeloma cells compared to the group of U266 untreated myeloma cells which was reduced by 2.3%, 6.8% and 89.2% (P <0.05) (Figure 3.e&f, Figure 4.c).
The apoptosis of the RPMI8226 and U266 myeloma cells after 48 hours of treatment is presented in (Figure 3). In the group of RPMI8226 cells treated with siRNA, the percentage of early apoptosis cells was increased by 10.6%, late apoptosis cells was increased by 22.3% and the percentage of live cells was decreased by 65% compared to the untreated RPMI8226 myeloma cells group which had values of 2.2%, 4.3% and 91% (P <0.05) (Figure 3.c&d, Figure 4.b). The percentage of early apoptosis cells was increased by 4.3% and late apoptosis cells was increased by 12.8%, the percentage of live cells was decreased by82.2% in the group of siRNA treated U266 myeloma cells compared to the untreated U266 myeloma cells group which had values of 2.5%, 3.8% and 89.9% (P <0.05) (Figure 3.g&h, Figure 4.d).
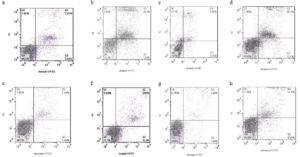
Figure 3: Apoptosis analysis by flow cytometry.(a) untreated RPMI8226 myeloma cells group at 24 hours,(b) siRNA treated RPMI8226 myeloma cells group at 24 hours,(c) untreated RPMI8226 myeloma cells group at 48 hours,(d) siRNA treated RPMI8226 myeloma cells group at 48 hours,(e) untreated U266 myeloma cells group at 24 hours,(f) siRNA treated U266 myeloma cells group at 24 hours,(g) untreated U266 myeloma cells group at 48 hours,(h) siRNA treated U266 myeloma cells group at 48 hours.
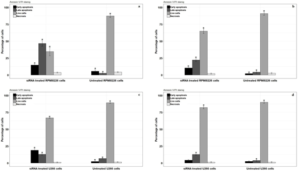
Figure 4: Apoptosis analysis by flow cytometry. (a) RPMI8226 myeloma cell groups at 24 hours (b) RPMI8226 myeloma cell groups at 48 hours (c) U266 myeloma cell groups at 24 hours (d) U266 myeloma cell groups at 48 hours. Data are shown as mean ± SD,*P<0.05.
Effect of Suppression of OCT4on Cell Cycle Myeloma Cells
The cell cycle condition 24 hours after treating the RPMI8266 and U266 myeloma cells with siRNAis presented in (Fig5). The phase G1 cell population in the RPMI8266 myeloma cells treated with siRNA group experienced 41.77% significantly, compared to the untreated RPMI8266 myeloma cells group with 50.49% decrease(P<0.05). Phase S cell population in the RPMI8266 myeloma cells treated with siRNA group and untreated RPMI8266 myeloma cells group, respectively had values of 35.14% and 35.36%, which were almost constant (P>0.05), and the cell population of the G2/M phase in the RPMI8266 myeloma cells treated with siRNA group did not show any significant increase of 18.27% compared to the untreated RPMI8266 myeloma cells group with a value of 15.25% (Figure 5.a&b, Figure 6.a).
The cell population of phases G1 and G2/M in the siRNA treated U266 myeloma cells group, with 56.46% and 16.6%, respectively, did not show any significant decrease compared to the untreated U266 myeloma cells group with 46.66% and 15.82%(P>0.05). Phase S cell population did not show any significant increase in siRNA treated U266 myeloma cells group with 36.34% compared to untreated U266 myeloma cells group with 40.3%(P>0.05) (Figure 5.e&f, Figure 6.c).
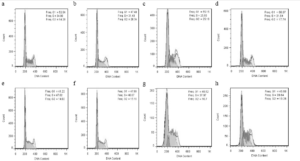
Figure 5: Cell cycle analysis by flow cytometry.(a) untreated RPMI8226 myeloma cells group at 24 hours,(b) siRNA treated RPMI8226 myeloma cells group at 24 hours,(c) untreated RPMI8226 myeloma cells group at 48 hours,(d) siRNA treated RPMI8226 myeloma cells group at 48 hours,(e) untreated U266 myeloma cells group at 24 hours,(f) siRNA treated U266 myeloma cells group at 24 hours,(g) untreated U266 myeloma cells group at 48 hours,(h) siRNA treated U266 myeloma cells group at 48 hours.
The cell cycle state 48 hours after treating the RPMI8266 and U266 myeloma cells with siRNAis presented in (Figure 5). Phase S cell population in the RPMI8266 myeloma cells treated with siRNA group with a value of 33.54% was increased significantly compared to the untreated RPMI8266 myeloma cells group with a value of 26.44%(P<0.05). The cell population of the G1 phase in the RPMI8266 myeloma cells treated with siRNA group did not show a significant increase of 54.01% compared to the untreated RPMI8266 myeloma cells group with a value of 53.42%(P>0.05), and the cell population of the G2/M phase in the RPMI8266 myeloma cells treated with siRNA group did not show a significant decreased of 18.22% compared to the untreated RPMI8266 myeloma cells group with a value of 22.71%(P>0.05) (Figure 5.c&d, Figure 6.b).
The cell population of phases S and G2/M in the siRNA treated U266 myeloma cells group, with 37.58% and 17.48%, respectively, did not show any significant decrease compared to the untreated U266 myeloma cells group with 36.71% and 15.33%(P>0.05). Phase G1 cell population did not show any significant decreased in siRNA treated U266 myeloma cells group with 47.19% compared to untreated U266 myeloma cells group with 49.88%(P>0.05) (Figure 5.g&h, Figure 6.d).
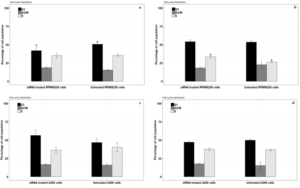
Figure 6: Cell cycle analysis by flow cytometry. (a) RPMI8226 myeloma cell groups at 24 hours, (b) RPMI8226 myeloma cell groups at 48 hours (c) U266 myeloma cell groups at 24 hours (d) U266 myeloma cell groups at 48 hours. Data are shown as mean ± SD,*P<0.05.
Discussion
OCT4 gene is expressed naturally in embryonic stem cells, and the expression of this gene in some cancers and its relation with cancer recurrence, drug resistance, and poor prognosis of cancer have been observed. The expression of the OCT4 gene and its effects on multiple myeloma and myeloma cells proliferation and apoptosis has not been studied before. In this study, for the first time, we examined the expression of the OCT4 gene and its effect on proliferation, cell cycle, and apoptosis of the myeloma cells. Quantitative real-time PCR showed the expression of OCT4 gene in the RPMI8226 and U266 myeloma cells, and the use of OCT4 siRNA on these cells significantly reduced the expression of the OCT4 gene.
To examine whether OCT4 participated in the myeloma cells proliferation, apoptosis and cell cycle, an OCT4 siRNA was transfected into RPMI8226 and U266 cells. Our study showed OCT4 down expression decreased myeloma cells proliferation. Our results showed that at OCT4 siRNA transfected myeloma cells increased apoptosis and altered cell cycle properties by an OCT4 gene silencing. The inhibition of OCT4 expression in the myeloma cells caused increased apoptotic cells and decreased living cells, suggesting that one of the reasons for the decrease in the proliferation rate of the cells is increase in the apoptosis in these cells.The down regulation of the OCT4 gene causes an increase in apoptosis in the cancer cells and thus reduces their invasive power, indicating the role of OCT4 as an invasive factor in cancer cells [18]. Knockdown of the OCT4 gene in breast cancer cells effectively reduced the extent and aggressive power of these cells [19]. OCT4 from the OCT4/Tcl1/Akt signaling pathway plays a role in proliferation and inhibition of apoptosis of embryonic stem cell [20]. In the multiple myeloma, the PI3k/Akt signaling pathway is activated by IL-6 and protects the myeloma cells from apoptosis and increased proliferation of these cells [21]. Inhibition of expression OCT4 reduces expression Tcl1 and increases apoptosis and decreases cell proliferation [22]. Increasing the expression of Survivin in cancer cells also inhibits apoptosis and increases the proliferation of cells and plays a very important role in the progress of cancer [23]. Increased expression of Survivin in multiple myeloma has also been observed [24]. Studies have also shown that over expression of c-MYC through P53 results inhibition of proliferation and increased apoptosis [25]. OCT4 plays an important role in c-MYC expression [26].
Our findings also showed that changes in the cell cycle in the U266 cells line were not significant, but there were significant changes in the RPMI8226 cells in the G1 phase and S phase. It seems that reducing the expression of the CCND gene causes the cells to stop in the G1 phase. Increasing the expression of CCND causes cells to enter the S phase faster than the G1 phase and increase the cell division [27]. Inhibition of the OCT4 expression reduces the CCND expression, and cause leaving the cells in the G1 phase [28]. Inhibiting the expression of the OCT4 gene prolongs the cell division time and also reduces the proliferation of cancer cells [29]. The inhibition of the expression of the OCT4 gene causes the cell cycle to stop, thereby reducing the proliferative capacity and creating a colony in the acute myeloid cell line [30].
Decreased OC4 expression in colorectal metastatic cancer patients who responded well to treatment was observed, of which OCT4 could be used to predict response to treatment in this malignancy [31]. OCT4 is considered as a diagnostic marker with a higher sensitivity to CD30 in detecting the metastatic embryogenesis of carcinoma after chemotherapy [32]. OCT4 has a higher expression in the Lucena cell line, which is the MDR form of the K562 cell line, so that these cells are resistant to chemotherapy and have more aggressive power [33]. In erythroleukemic cells, there is also a significant relationship between OCT4 expression and MDR [34].
Conclusion
Our results showed that the increase in the proliferation of the myeloma cells is due to the decrease in apoptosis and changes in the cellular cycle of these cells, so further studies on the oct4 gene in the myeloma cells can create new pathways in the diagnosis and treatment of patients with multiple myeloma.
Conflict of Interests: There is no conflict of interests between the authors of this manuscript.
Funding Information: There is no funding has been received for this manuscript.
Acknowledgements: We would like to thank Professor Sir John Gurdon, Professor Thomas N Seyfried and Professor Sir Venki Ramakrishnan for their informative help.
References
- Abroun S, Saki N, Fakher R, Asghari F (2012) Biology and bioinformatics of myeloma cell. Lab Hematol 18: 30-41.
- Ríos-Tamayo R, Martín-García A, Alarcón-Payer C, Sánchez-Rodríguez D, de la Guardia AMDVD, et al. (2017) Pomalidomide in the treatment of multiple myeloma: design, development and place in therapy. Drug Des Devel Ther 11: 2399-2408.
- Barley K, Chari A (2016) Diagnostic Advances in Multiple Myeloma. Curr Hematol Malig Rep 11:111-117.
- Malaer JD, Mathew PA (2017) CS1 (SLAMF7, CD319) is an effective immunotherapeutic target for multiple myeloma. Am J Cancer Res 7:1637-1641.
- Laganà A, Perumal D, Melnekoff D, Readhead B, Kidd BA, et al. (2018) Integrative network analysis identifies novel drivers of pathogenesis and progression in newly diagnosed multiple myeloma. Leukemia 32:120-130.
- Maes A, Menu E, Veirman K, Maes K, Vand Erkerken K, De Bruyne E. The therapeutic potential of cell cycle targeting in multiple myeloma. Oncotarget 8: 90501-90520.
- Ishikawa H, Tsuyama N, Liu S, Abroun S, Li FJ, et al. (2005) Accelerated proliferation of myeloma cells by interleukin-6 cooperating with fibroblast growth factor receptor 3-mediated signals. Oncogene 24: 6328-6332.
- Holien T, Sundan A (2012) Oncogene addiction to c-MYC in myeloma cells. Oncotarget 3: 739-740.
- Saki N, Abroun S, Hajizamani S, Rahim F, Shahjahani M (2014) Association of Chromosomal Translocation and MiRNA Expression with The Pathogenesis of Multiple Myeloma. Cell J 16: 99-110.
- de Mel S, Lim SH, Tung ML, Chng WJ (2014) Implications of heterogeneity in multiple myeloma. Biomed Res Int 2014: 232546.
- Kryukov F, Dementyeva E, Kubiczkova L, Jarkovsky J, Brozova L, et al. (2013) Cell cycle genes co-expression in multiple myeloma and plasma cell leukemia. Genomics 102: 243-249.
- Kosaka T, Mikami S, Yoshimine S, Miyazaki Y, Daimon T, et al. (2016) The prognostic significance of OCT4 expression in patients with prostate cancer. Hum Pathol 51: 1-8.
- Greenow K, Clarke AR (2012) Controlling the stem cell compartment and regeneration in vivo: the role of pluripotency pathways. Physiol Rev 92: 75-99.
- Villodre ES, Kipper FC, Pereira MB, Lenz G (2016) Roles of OCT4 in tumorigenesis, cancer therapy resistance and prognosis. Cancer Treat Rev 51: 1-9.
- Tantin D (2013) Oct transcription factors in development and stem cells: insights and mechanisms. Development 140: 2857-2866.
- Schmittgen TD, Livak KJ (2008) Analyzing real-time PCR data by the comparative C(T) method. Nat Protoc 3: 1101-1108.
- Team RC (2017) R: A Language and Environment for Statistical Computing [Internet]. Vienna,Austria: R Foundation for Statistical Computing; 2017.
- Göhring AR, Reuter S, Clement JH, Cheng X, Theobald J, et al. (2017) Human microRNA-299-3p decreases invasive behavior of cancer cells by downregulation of Oct4 expression and causes apoptosis. PLoS One 12: e0174912.
- Kar S, Patra SK (2018) Overexpression of OCT4 induced by modulation of histone marks plays crucial role in breast cancer progression. Gene 643:35-45.
- Matoba R, Niwa H, Masui S, Ohtsuka S, Carter MG, et al. (2006) Dissecting Oct3/4-regulated gene networks in embryonic stem cells by expression profiling. PLoS One 1: e26.
- Hideshima T, Nakamura N, Chauhan D, Anderson KC (2001) Biologic sequelae of interleukin-6 induced PI3-K/Akt signaling in multiple myeloma. Oncogene 20: 5991-6000.
- Hu T, Liu S, Breiter DR, Wang F, Tang Y, et al. (2008) Octamer 4 small interfering RNA results in cancer stem cell-like cell apoptosis. Cancer Res 68: 6533-6540.
- Duffy MJ, O’Donovan N, Brennan DJ, Gallagher WM, Ryan BM (2007) Survivin: A promising tumor biomarker. Cancer Lett 249: 49-60.
- Romagnoli M, Trichet V, David C, Clément M, Moreau P, et al. (2007) Significant impact of survivin on myeloma cell growth. Leukemia 21:1070-1078.
- Hoffman B, Liebermann DA (2008) Apoptotic signaling by c-MYC. Oncogene 27: 6462-6472.
- Kotkamp K, Kur E, Wendik B, Polok BK, Ben-Dor S, et al. (2014) Pou5f1/Oct4 promotes cell survival via direct activation of mych expression during zebrafish gastrulation. PLoS One 9:
- Li Z, Li X, Li C, Su Y, Fang W, et al. (2014) Transcription factor OCT4 promotes cell cycle progression by regulating CCND1 expression in esophageal carcinoma. Cancer Lett 354: 77-86.
- Cao L, Li C, Shen S, Yan Y, Ji W, et al. (2013) OCT4 increases BIRC5 and CCND1 expression and promotes cancer progression in hepatocellular carcinoma. BMC Cancer 13: 82.
- Comisso E, Scarola M, Rosso M, Piazza S, Marzinotto S, et al. (2017) OCT4 controls mitotic stability and inactivates the RB tumor suppressor pathway to enhance ovarian cancer aggressiveness. Oncogene 36: 4253-4266.
- Picot T, Kesr S, Wu Y, Aanei CM, Flandrin-Gresta P, et al. (2017) Potential Role of OCT4 in Leukemogenesis. Stem Cells Dev 26: 1637-1647.
- Padín-Iruegas ME, Herranz-Carnero M, Aguin-Losada S, Brozos-Vazquez E, Anido-Herranz U, et al. (2013) Prognostic value of changes in the expression of stem cell markers in the peripheral blood of patients with colon cancer. Oncol Rep 29: 2467-2472.
- Sung MT, Jones TD, Beck SD, Foster RS, Cheng L (2006) OCT4 is superior to CD30 in the diagnosis of metastatic embryonal carcinomas after chemotherapy. Hum Pathol 37: 662-667.
- Marques DS, Sandrini JZ, Boyle RT, Marins LF, Trindade GS (2010) Relationships between multidrug resistance (MDR) and stem cell markers in human chronic myeloid leukemia cell lines. Leuk Res 34: 757-762.
- Oliveira BR, Figueiredo MA, Trindade GS, Marins LF (2015) OCT4 mutations in human erythroleukemic cells: implications for multiple drug resistance (MDR) phenotype. Mol Cell Biochem 400: 41-50.