Publication Information
ISSN 2691-8803
Frequency: Continuous
Format: PDF and HTML
Versions: Online (Open Access)
Year first Published: 2019
Language: English
| Journal Menu |
| Editorial Board |
| Reviewer Board |
| Articles |
| Open Access |
| Special Issue Proposals |
| Guidelines for Authors |
| Guidelines for Editors |
| Guidelines for Reviewers |
| Membership |
| Fee and Guidelines |
 |
Integration of Pruning in the C4.5 Algorithm to Improve the Accuracy of Health Insurance Classification
Irwan Syah*, Amron, Herry Subagyo
Doctor of Management Program, Dian Nuswantoro University, Indonesia
Received Date: February 02, 2023; Accepted Date: February 09, 2023; Published Date: February 19, 2023;
*Corresponding author: Irwan Syah. Doctor of Management Program, Dian Nuswantoro University, Indonesia. Email: P42202200001@mhs.dinus.ac.id
Citation: Syaha I, Amron, Subagyo H (2023) Integration of Pruning in the C4.5 Algorithm to Improve the Accuracy of Health Insurance Classification. Adv Pub Health Com Trop Med: APCTM-178.
DOI: 10.37722/APHCTM.2023202
Abstract
Quality improvement and patient safety are the main factors that affect hospital performance. Every hospital is required to provide good service that is standardized. One of the parties that influence the success of hospitals in providing good service is health insurance. The decisive factor in making plans for service improvement and improvement is the estimation of feasible and pending data based on claim cases that the Health Insurance Company will handle. Data, information, and knowledge support are essential factors in hospital planning. The amount of data can be used to become information extracted using decision tree data mining techniques. This method can produce more accurate results of feasible and pending classifications and predict patterns affecting claim classification results. In this study, the decision tree algorithm C4.5, integrated with the pruning method, was tested and showed better results than the decision tree algorithm C4.5 without pruning. In addition to better accuracy results, models integrated with pruning have a more concise claim pattern.
Keywords: C4.5; Classification; Data Mining; Decision Tree; Insurance Health
Introduction
Quality improvement and patient safety are the main factors that affect hospital performance. Every hospital is required to provide good service that is standardized. The success of a hospital in providing good service is primarily determined by all parties involved [1]. One of the parties that influence the success of hospitals in providing good service is health insurance. Since January 1, 2014, the government has officially enforced the Social Security Administration (BPJS) to administer the National Health Insurance (JKN) program. [2]. BPJS system services require effective and efficient management of hospitals and health facilities to claim. Data, information, and knowledge support are essential factors in hospital planning. One of the determining factors in making plans for service improvement and improvement is the estimation of feasible and pending data based on claim cases that the Health Insurance Company will handle [3].
The amount of data can be used to become information that can be extracted. One technique that can explore hidden information from multidimensional data sets that have been obtained is data mining techniques. For example, data mining technology can be utilized on claim data. This data will provide information on the factors that influence the results of claims, namely, feasible and pending claims. One of the data mining methods that can be used for data classification is a decision tree.
A Decision Tree is a flowchart structure with a tree (tree), where each internal node indicates an attribute test, each branch represents the test result, and the leaf node represents a class or class distribution [4]. Decision trees tend to be simpler and easier to understand because the structure of a decision tree that resembles a tree shape can be displayed graphically and is very easy to interpret even by ordinary people. Moreover, a decision tree can be used to predict a value [5]. The decision tree method algorithm used in several studies is ID3, J48, Naïve Bayes [6], and C4.5 [4]; [7]; [8]; [9]; [10]. The decision tree and the C4.5 algorithm are two inseparable models; therefore, to build a decision tree, the C4.5 algorithm is needed. The C4.5 algorithm is the development of ID3. Some of the developments carried out by C4.5 are overcoming missing values, continuing data, and pruning [4].
In decision tree C4.5, pruning is part of the decision tree formation process. When forming a decision tree, some nodes are outliers or the result of noise data. Applying pruning to the decision tree can reduce outliers and data noise in the initial decision tree to increase the accuracy of data classification [10]. Pruning is a process carried out to cut or remove some branches (branches) that are not needed. Pruning is done to develop the generalization reliability of the Decision Tree and the accuracy of the Decision Tree predictions by moving nodes that are not needed in the Decision Tree [11]. Branches (branches) or nodes that are not needed can cause the size of the Decision Tree to be very large, and this is called over- fitting [12,13]. For now, overfitting is a research trend among researchers. Over- fitting can produce a suitable model in training data but cannot produce a good tree model when applied to unseen data [14]. Over-fitting is caused by noisy data and irrelevant features [14]. Noisy data will cause misclassification, so that over-fitting will cause a poor level of accuracy in classification.
Research related to the decision tree model [6] describes a comparison of ID3, J48, and Naïve Bayes to detect cases of health insurance fraud. The results of the research are decision tree using ID3 is the algorithm with the best level of accuracy. It takes 0.02 seconds to build the model. ID3 has the highest accuracy level, 100%, and the lowest accuracy is owned by J48, 96,7213%. Research [11] developed the decision tree method for large-scale health insurance claim data. In this study, data on insurance claims used as many as 242,075 data. The decision tree approach can predict the Matthews correlation coefficient (MCC) of 0.426. This method is significantly better than the annual model, which reaches 0.375 for the group of insurance users [12]. In addition, a predictive model that can predict the possibility of claims based on risk factors has been developed. Decision tree analysis was adopted and developed with a predictive model. The error rate in the decision tree is low. It indicates that the model is well validated and suitable for predicting future claims considering the data flow and risk characteristics [13].
Another study [5] proved that the decision tree method is the most straightforward and easily understood structure, requiring the shortest interpretation time compared to the random forest and convolutional neural network methods.
Several studies have been described above to explain that the C4.5 algorithm is still being developed, especially in research, to increase accuracy. This study is expected to predict patterns that affect the results of the classification of eligible and pending claims on BPJS health insurance more accurately. In this study, it is proposed to use the C4.5. Algorithm data mining system with the pruning method to overcome pruning on nodes to improve the performance of the C4.5 algorithm.
Methodology
The research methodology to be carried out includes the dataset used, a general explanation of the method to be used in the study, as well as preliminary research that has been carried out with the experimental results. The data used in this study is secondary data, namely data that is not obtained directly but collected by other parties. The data used is the BPJS Health claim dataset at the Kumala Siwi Hospital as many as 2384 data. The data consists of class variables, LOS, total tariffs, hospital rates, profit, diaglist, proclist, inacbg and labels consisting of eligible and pending claims.
BPJS insurance classification research consists of several stages as follows:
- The first stage, the data to be processed. From the data that has been obtained, not all data will be processed because the research to be carried out has limitations on the data to be used.
- The second stage is handling missing value data. Missing values are incomplete data because the attribute is not recorded or the attribute is not owned and so on. Handling missing values is done by deleting empty records.
- The third stage, determines the attributes that will be used from the first stage.
- Fourth stage, perform data conversion. Data with selected attributes is then changed to facilitate the data mining process on some attributes, because the data will be processed with data mining tools.
A wide variety of modeling techniques are selected and applied to datasets that have been prepared to address appropriate business requirements. The technique used is the classification technique using the C4.5 decision tree method which is optimized using pruning. In this study, the test used is the Confusion matrix. The confusion matrix is used to measure the performance model, because the confusion matrix is a useful tool to analyze well the classifier can recognize tuples/features from different classes [19].
The confusion matrix can help show the details of classifier performance by providing information on the number of features of a class that are classified correctly and incorrectly.
In this study, the test used is the Confusion matrix. The confusion matrix is used to measure the performance model, because the confusion matrix is a useful tool to analyze well the classifier can recognize tuples/features from different classes [20]. The confusion matrix can help show the details of classifier performance by providing information on the number of features of a class that are classified correctly and incorrectly.
Results and Discussion
The data used in this study is secondary data, namely data that is not obtained directly but collected by other parties. The data used is the BPJS Health claim dataset at the Kumala Siwi Hospital, with as many as 544 data. The data consists of class variables of care, LOS, total tariffs, hospital rates, profits, diaglist, proclist, inacbg, and labels consisting of eligible and pending claims. This study aims to determine the pattern of determinants of the outcome of health insurance claims. The researchers used pruning to reduce outliers and data noise in the initial decision tree to increase accuracy in data classification. In addition, researchers use the following methods to improve the results of the classification of health insurance claims.
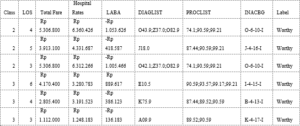
Figure 1: Sample Data.
Data preprocessing is a set of techniques applied to the database to remove noise, missing values, and inconsistent data. Data preprocessing is divided into several steps: cleaning, transformation, and reduction. After the data is preprocessed, the data will be split using cross-validation to separate the testing and training data. After being separated using cross-validation, the next step is calculating the classification using the C4.5 algorithm. Then, it calculates the model performance by creating a confusion matrix, as shown in Table 1.
true Worthy
true Pending
class precision
pred. Worthy
401
51
88.72%
pred. pending
33
59
64.13%
class recall
92.40%
53.64%
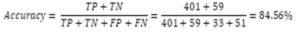
Based on the confusion matrix table data, it can be concluded that:
- True Positive (TP) = 401 data from worthy class that data can predict correctly in the worthy class.
- True negative (TN) = 59 data from one pending class that data can predict correctly in the pending class.
- False positive (FP) = 33 data from conditions in which the worthy class has a wrong prediction in the pending class, while
- False negative (FN) = 51 data from conditions in the pending class, which data is predicted to be wrong in the worthy class.
In addition to the results of accuracy, based on the processed data, the C4.5 algorithm also produces a decision tree that makes a pattern in health insurance claims as below:
Hospital Rates > 674063
| Total Fare > 13813350: Pending
{Worthy=0, Pending=1}
| Total Fare 13813350
| | PROFIT > 7029929: Pending {Worthy=0,
Pending=1}
| | PROFIT 7029929
| | | PROFIT > -5404815
| | | | LOS > 8,500: Pending {Worthy=0, Pending=1}
| | | | LOS 8,500
| | | | | Hospital Rates > 728039
| | | | | | Hospital Rates > 905764.500
| | | | | | | INACBG = A-4-13-I: Worthy {Worthy=4, Pending=0}
| | | | | | | INACBG = A-4-13-II: Worthy {Worthy=1, Pending=0}
| | | | | | | INACBG = A-4-13-III
| | | | | | | | Hospital Rates > 2901067.500: Worthy {Worthy=3, Pending=1}
| | | | | | | | Hospital Rates 2901067.500: Pending {Worthy=0, Pending=2}
| | | | | | | INACBG = A-4-14-I
| | | | | | | | Hospital Rates > 2150624,500: Worthy {Worthy=5, Pending=0}
| | | | | | | | Hospital Rates 2150624.500: Pending {Worthy=0, Pending=1}
| | | | | | | INACBG = A-4-14-II: Worthy {Worthy=1, Pending=0}
| | | | | | | INACBG = B-4-13-I: Worthy {Worthy=8, Pending=0}
| | | | | | | INACBG = B-4-13-II: Worthy {Worthy=1, Pending=0}
| | | | | | | INACBG = B-4-13-III: Worthy {Worthy=2, Pending=0}
| | | | | | | INACBG = B-4-14-I: Worthy {Worthy=3, Pending=0}
| | | | | | | INACBG = B-4-14-II: Worthy {Worthy=1, Pending=0}
| | | | | | | INACBG = D-4-11-I
| | | | | | | Class > 2: Pending {Worthy=0, Pending=1}
| | | | | | | | Class 2: Worthy {Worthy=1, Pending=0}
| | | | | | | INACBG = D-4-11-II: Pending {Worthy=0, Pending=2}
| | | | | | | INACBG = D-4-11-III: Pending {Worthy=0, Pending=1}
| | | | | | | INACBG = D-4-13-I: Worthy {Worthy=1, Pending=0}
| | | | | | | INACBG = D-4-13-II: Pending {Worthy=0, Pending=1}
| | | | | | | INACBG = E-4-10-I
| | | | | | | | PROFIT > 2068458,500: Pending {Worthy=0, Pending=1}
| | | | | | | | PROFIT 2068458,500: Worthy {Worthy=17, Pending=1}
| | | | | | | INACBG = E-4-10-II
| | | | | | | | Class > 2500: Pending {Worthy=2, Pending=3}
| | | | | | | | Class 2,500: Worthy {Worthy=2, Pending=0}
| | | | | | | INACBG = E-4-10-III
| | | | | | | | LOS > 6,500: Pending {Worthy=0, Pending=1}
| | | | | | | | LOS 6,500: Worthy {Worthy=6, Pending=1}
| | | | | | | INACBG = E-4-11-III: Worthy {Worthy=1, Pending=0}
| | | | | | | INACBG = E-4-13-I: Worthy {Worthy=1, Pending=0}
| | | | | | | INACBG = G-4-13-I: Worthy {Worthy=3, Pending=0}
| | | | | | | INACBG = G-4-13-II: Pending {Worthy=0, Pending=1}
| | | | | | | INACBG = G-4-13-III: Pending {Worthy=0, Pending=3}
| | | | | | | INACBG = G-4-14-I: Worthy {Worthy=2, Pending=0}
| | | | | | | INACBG = G-4-14-II: Worthy {Worthy=1, Pending=0}
| | | | | | | INACBG = G-4-22-I: Worthy {Worthy=2, Pending=0}
| | | | | | | INACBG = G-4-23-I: Worthy {Worthy=1, Pending=0}
| | | | | | | INACBG = G-4-26-I: Worthy {Worthy=1, Pending=0}
| | | | | | | INACBG = G-4-26-II: Pending {Worthy=0, Pending=1}
| | | | | | | INACBG = H-1-30-I: Worthy {Worthy=3, Pending=0}
| | | | | | | INACBG = I-4-10-II: Pending {Worthy=0, Pending=1}
| | | | | | | INACBG = I-4-10-III: Worthy {Worthy=2, Pending=0}
| | | | | | | INACBG = I-4-12-I
| | | | | | | | Hospital Rates > 2442651: Worthy {Worthy=2, Pending=0}
| | | | | | | | Hospital Rates 2442651: Pending {Worthy=0, Pending=1}
| | | | | | | INACBG = I-4-12-II
| | | | | | | | Hospital Rates > 5611373,500: Worthy {Worthy=4, Pending=0}
| | | | | | | | Hospital Rates 5611373,500: Pending {Worthy=2, Pending=6}
| | | | | | | INACBG = I-4-12-III
| | | | | | | | Hospital Rates > 3134133: Pending {Worthy=2, Pending=4}
| | | | | | | | Hospital Rates 3134133: Worthy {Worthy=3, Pending=0}
| | | | | | | INACBG = I-4-15-I
| | | | | | | | LOS > 3: Worthy {Worthy=5, Pending=0}
| | | | | | | | LOS 3: Pending {Worthy=0, Pending=1}
| | | | | | | INACBG = I-4-15-II: Worthy {Worthy=2, Pending=0}
| | | | | | | INACBG = I-4-16-I: Worthy {Worthy=2, Pending=0}
| | | | | | | INACBG = I-4-16-III: Pending {Worthy=0, Pending=2}
| | | | | | | INACBG = I-4-17-I: Pending {Worthy=0, Pending=1}
| | | | | | | INACBG = I-4-19-I: Worthy {Worthy=1, Pending=0}
| | | | | | | INACBG = I-4-20-I: Worthy {Worthy=1, Pending=0}
| | | | | | | INACBG = I-4-24-I: Worthy {Worthy=1, Pending=0}
| | | | | | | INACBG = J-1-20-III: Worthy {Worthy=1, Pending=0}
| | | | | | | INACBG = J-4-15-I: Worthy {Worthy=9, Pending=0}
| | | | | | | INACBG = J-4-15-II
| | | | | | | | Hospital Rates > 2707503: Pending {Worthy=0, Pending=1}
| | | | | | | | Hospital Rates 2707503: Worthy {Worthy=1, Pending=0}
| | | | | | | INACBG = J-4-15-III: Pending {Worthy=0, Pending=4}
| | | | | | | INACBG = J-4-16-I: Worthy {Worthy=14, Pending=0}
| | | | | | | INACBG = J-4-16-II
| | | | | | | | PROFIT > 1492330.500: Worthy {Worthy=1, Pending=1}
| | | | | | | | PROFIT 1492330.500: Worthy {Worthy=3, Pending=0}
| | | | | | | INACBG = J-4-16-III
| | | | | | | | LOS > 4,500: Worthy {Worthy=1, Pending=0}
| | | | | | | | LOS 4,500: Pending {Worthy=0, Pending=1}
| | | | | | | INACBG = J-4-20-II: Pending {Worthy=0, Pending=1}
| | | | | | | INACBG = J-4-21-I: Worthy {Worthy=1, Pending=0}
| | | | | | | INACBG = K-1-13-I: Worthy {Worthy=1, Pending=0}
| | | | | | | INACBG = K-1-50-I: Worthy {Worthy=1, Pending=0}
| | | | | | | INACBG = K-4-12-I: Worthy {Worthy=5, Pending=0}
| | | | | | | INACBG = K-4-12-II: Worthy {Worthy=1, Pending=0}
| | | | | | | INACBG = K-4-13-I: Worthy {Worthy=1, Pending=0}
| | | | | | | INACBG = K-4-15-I: Worthy {Worthy=2, Pending=0}
| | | | | | | INACBG = K-4-17-I: Worthy {Worthy=20, Pending=0}
| | | | | | | INACBG = K-4-17-II: Worthy {Worthy=2, Pending=0}
| | | | | | | INACBG = K-4-17-III: Worthy {Worthy=1, Pending=0}
| | | | | | | INACBG = K-4-18-I: Worthy {Worthy=7, Pending=0}
| | | | | | | INACBG = K-4-18-II: Worthy {Worthy=5, Pending=0}
| | | | | | | INACBG = L-1-40-I
| | | | | | | | Class > 2500: Pending {Worthy=0, Pending=4}
| | | | | | | | Class 2,500: Worthy {Worthy=1, Pending=0}
| | | | | | | INACBG = L-4-12-I: Worthy {Worthy=2, Pending=0}
| | | | | | | INACBG = L-4-12-II: Pending {Worthy=0, Pending=1}
| | | | | | | INACBG = L-4-13-I: Pending {Worthy=0, Pending=1}
| | | | | | | INACBG = L-4-14-II: Pending {Worthy=0, Pending=1}
| | | | | | | INACBG = M-1-30-I: Worthy {Worthy=2, Pending=0}
| | | | | | | INACBG = M-4-17-I: Worthy {Worthy=1, Pending=0}
| | | | | | | INACBG = M-4-21-II: Pending {Worthy=0, Pending=1}
| | | | | | | INACBG = N-1-40-I: Worthy {Worthy=1, Pending=0}
| | | | | | | INACBG = N-4-10-II: Worthy {Worthy=4, Pending=0}
| | | | | | | INACBG = N-4-10-III
| | | | | | | | Class > 2500: Pending {Worthy=0, Pending=1}
| | | | | | | | Class 2,500: Worthy {Worthy=1, Pending=0}
| | | | | | | INACBG = N-4-11-I: Worthy {Worthy=1, Pending=0}
| | | | | | | INACBG = N-4-12-I: Worthy {Worthy=3, Pending=0}
| | | | | | | INACBG = N-4-12-II: Pending {Worthy=0, Pending=1}
| | | | | | | INACBG = N-4-12-III: Worthy {Worthy=1, Pending=0}
| | | | | | | INACBG = N-4-13-I
| | | | | | | | Class > 1,500: Worthy {Worthy=2, Pending=0}
| | | | | | | | Class 1,500: Pending {Worthy=0, Pending=1}
| | | | | | | INACBG = N-4-13-II
| | | | | | | | Class > 2,500: Worthy {Worthy=1, Pending=1}
| | | | | | | | Class 2,500: Pending {Worthy=0, Pending=1}
| | | | | | | INACBG = O-6-10-I: Worthy {Worthy=104, Pending=0}
| | | | | | | INACBG = O-6-10-II
| | | | | | | | LOS > 3,500: Worthy {Worthy=7, Pending=0}
| | | | | | | | LOS 3,500: Worthy {Worthy=1, Pending=1}
| | | | | | | INACBG = O-6-10-III
| | | | | | | | Hospital Rates > 6735348.500: Pending {Worthy=0, Pending=1}
| | | | | | | | Hospital Rates 6735348.500: Worthy {Worthy=2, Pending=0}
| | | | | | | INACBG = O-6-13-I: Worthy {Worthy=9, Pending=0}
| | | | | | | INACBG = O-6-13-II
| | | | | | | | Hospital Rates > 4298333: Worthy {Worthy=10, Pending=1}
| | | | | | | | Hospital Rates 4298333: Worthy {Worthy=31, Pending=0}
| | | | | | | INACBG = P-8-08-I: Worthy {Worthy=11, Pending=0}
| | | | | | | INACBG = P-8-08-II: Worthy {Worthy=1, Pending=0}
| | | | | | | INACBG = P-8-11-II: Worthy {Worthy=1, Pending=0}
| | | | | | | INACBG = P-8-12-I: Worthy {Worthy=1, Pending=0}
| | | | | | | INACBG = P-8-12-II: Pending {Worthy=0, Pending=1}
| | | | | | | INACBG = P-8-13-I: Worthy {Worthy=7, Pending=0}
| | | | | | | INACBG = P-8-13-II: Worthy {Worthy=1, Pending=0}
| | | | | | | INACBG = P-8-17-I
| | | | | | | | Class > 1,500: Worthy {Worthy=1, Pending=0}
| | | | | | | | Class 1,500: Pending {Worthy=0, Pending=1}
| | | | | | | INACBG = S-4-12-I: Worthy {Worthy=1, Pending=0}
| | | | | | | INACBG = U-1-15-I: Worthy {Worthy=2, Pending=0}
| | | | | | | INACBG = U-4-11-I: Worthy {Worthy=6, Pending=0}
| | | | | | | INACBG = U-4-11-III: Pending {Worthy=0, Pending=1}
| | | | | | | INACBG = U-4-13-I: Worthy {Worthy=5, Pending=0}
| | | | | | | INACBG = W-1-10-I: Worthy {Worthy=3, Pending=0}
| | | | | | | INACBG = W-1-11-I: Worthy {Worthy=22, Pending=0}
| | | | | | | INACBG = W-1-30-I: Worthy {Worthy=2, Pending=0}
| | | | | | | INACBG = W-4-12-II: Worthy {Worthy=1, Pending=0}
| | | | | | | INACBG = W-4-16-I: Worthy {Worthy=1, Pending=0}
| | | | | | | INACBG = W-4-17-III: Pending {Worthy=0, Pending=1}
| | | | | | Hospital Rates 905764.500
| | | | | | | Hospital Rates > 761097.500: Pending {Worthy=0, Pending=3}
| | | | | | | Hospital Rates 761097.500: Worthy {Worthy=2, Pending=0}
| | | | | Hospital Rates 728039
| | | | | | INACBG = P-8-08-I: Worthy {Worthy=1, Pending=0}
| | | | | | INACBG = P-8-17-I
| | | | | | | PROFIT > 2425042.500: Pending {Worthy=0, Pending=5}
| | | | | | | PROFIT 2425042.500: Worthy {Worthy=1, Pending=0}
| | | PROFIT -5404815
| | | | LOS > 9: Worthy {Worthy=1, Pending=0}
| | | | LOS 9: Pending {Worthy=0, Pending=3}
Hospital Rates 674063
| Hospital Rates > 456674,500: Pending {Worthy=0, Pending=31}
| Hospital Rates 456674,500: Worthy {Worthy=2, Pending=0}
From the research results using the C4.5 algorithm, an accuracy of 84.56 % is obtained. In the next stage, the researcher will compare using the C4.5 algorithm, which is integrated using pruning. Like the previous stages, the data will be preprocessed before processing. Based on the results of the C4.5 modeling with the pruning method calculates the model performance by creating a confusion matrix, as shown in Table 2.
true Worthy
true Pending
class precision
pred. Worthy
423
68
86.15%
pred. pending
11
42
79.25%
class recall
97.47%
38.18%
Based on the confusion matrix table data, it can be concluded that:
- True Positive (TP) = 423 data from worthy class that data can predict correctly in the worthy class.
- True negative (TN) = 42 data from one pending class that data can predict correctly in the pending class
- False positive (FP) = 11 data from conditions in which the worthy class has a wrong prediction in the pending class, while
- False negative (FN) = 68 data from conditions in the pending class, which data is predicted to be wrong in the worthy class.
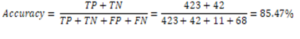
Based on the results of the accuracy value, accuracy can see that the C4.5 method using pruning has a superior accuracy value of 85.47% compared to the C4.5 method without pruning, which only reaches 84.56% accuracy.
In addition to the results of accuracy, based on the processed data, the C4.5 algorithm, which is integrated using pruning, also produces a decision tree that makes a pattern in health insurance claims that is simpler when compared to the C4.5 algorithm as below:
Hospital Rates > 674063
| Hospital Rates > 11544763: Pending {Worthy=1, Pending=3}
| Hospital Rates 11544763
| | Hospital Rates > 728039
| | | Total Fare > 8708350: Pending {Worthy=1, Pending=2}
| | | Total Fares 8708350
| | | | Hospital Rates > 905764.500
| | | | | Hospital Rates > 8857613
| | | | | | Class > 1,500: Worthy {Worthy=2, Pending=1}
| | | | | | Class 1,500: Pending {Worthy=0, Pending=2}
| | | | | Hospital Rates 8857613
| | | | | | LOS > 7,500: Pending {Worthy=1, Pending=2}
| | | | | | LOS 7,500
| | | | | | | LOS > 6,500
| | | | | | | | PROFIT > -2497645.500: Pending {Worthy=0, Pending=3}
| | | | | | | | PROFIT -2497645.500: Worthy {Worthy=4, Pending=0}
| | | | | | | LOS 6,500: Worthy {Worthy=419, Pending=58}
| | | | Hospital Rates 905764.500
| | | | | Hospital Rates > 761097.500: Pending {Worthy=0, Pending=3}
| | | | | Hospital Rates 761097.500: Worthy {Worthy=2, Pending=0}
| | Hospital Rates 728039: Pending {Worthy=2, Pending=5}
Hospital Rates 674063: Pending {Worthy=2, Pending=31}
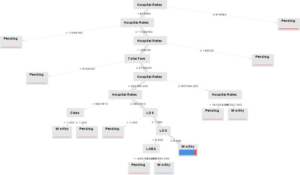
Figure 1: Decision Tree.
Conclusion
Based on the experiment, it was found that the C4.5 algorithm using the pruning method that was tested showed better results when compared to C4.5 without pruning. C4.5 using pruning has shown performance with an accuracy of 85.47%. In addition to higher accuracy, integrating the C4.5 algorithm with the pruning method produces claims patterns that are more concise and easy to understand. A larger dataset with a more significant number of records can be used for further research. In addition, research can be developed using other methods.
Acknowledgement: The researcher would like to thank Dian Nuswantoro University and Kumala Siwi Hospital for supporting and assisting in providing data and information for this research.
References
- Lan, H. Hu, C. Jiang, G. Yang, Z. Zhao, “A comparative study of decision tree, random forest, and convolutional neural network for spread-F identification,” Adv. Sp. Res. 65:2052-2061, 2020.
- Pal and S. Pal, “Application of Data Mining Techniques in Health Fraud Detection,” Int. J. Eng. Res. Gen. Sci. 3:129-137, 2015.
- Xie et al., “Predicting Days in Hospital Using Health Insurance Claims,” IEEE J. Biomed. Heal. Informatics. 19:1224-1233, 2015.
- Xie et al., “Analyzing health insurance claims on different timescales to predict days in hospital,” J. Biomed. Inform., vol. 60, pp. 187-196, 2016.
- K. Frempong, N. Nicholas, and M. A. Boateng, “Decision Tree as a Predictive Modeling Tool for Auto Insurance Claims,” Int. J. Stat. Appl., vol. 7, no. 2, pp. 117-120, 2017.
- H. Farbmacher, L. Löw, M. Spindler, “An explainable attention network for fraud detection in claims management,” Econom., no. xxxx, 2020.
- Marinaccio et al., “Predictors of filing claims and receiving compensation in malignant mesothelioma patients,” Health Policy (New. York)., vol. 124, no. 9, pp. 1032-1040, 2020.
- Vineela, P. Swathi, T. Sritha, and K. Ashesh, “Fraud Detection in Health Insurance Claims using Machine Learning Algorithms,” Int. J. Recent Technol. Eng., vol. 8:2999-3004, 2020.
- C Wang, H Wang, C Zhou, H Chen, “Experience Thinking: Constrained hyperparameter optimization based on knowledge and pruning,” Knowledge-Based Syst., p. 106602, 2020.
- Rayan, “Framework for Analysis and Detection of Fraud in Health Insurance,” pp. 47-56.
- Robson and S. Boray, “Studies in the use of data mining, prediction algorithms, and a universal exchange and inference language in the analysis of socioeconomic health data,” Comput. Biol. Med., vol. 112, no. July, p. 103369, 2019.
- C. Chern, Y. J. Chen, and B. Hsiao, “Decision tree-based classifier in providing telehealth service,” BMC Med. Inform. Decis. Mak. 19:1-15, 2019.
- Sari, E. Gulbandila, and N. Dalkilic, “Risk Assessment with Decision Tree in Professional Liability Insurance: In Accounting,” J. Artif. Intell. 12:18-23, 2018.
- Pandey, A. Saroliya, and R. Kumar, “Analyses and detection of health insurance fraud using data mining and predictive modeling techniques,” Adv. Intell. Syst. Comput., vol. 584, pp. 41- 49, 2018.
- Obodoekwe and D. T. van der Haar, “A critical analysis of the application of data mining methods to detect healthcare claim fraud in the medical billing process,” Lect. Notes Comput. Sci. (including Subser. Lect. Notes Artif. Intell. Lect. Notes Bioinformatics), vol. 11277 LNCS. 320-330, 2018.
- Schulz, I. Lindlbauer, K. Rapp, C. Becker, and H. H. König, “Long-Term Effectiveness of a Multifactorial Fall and Fracture Prevention Program in Bavarian Nursing Homes: An Analysis Based on Health Insurance Claims Data,” J. Am. Med. Dir. Assoc., vol. 18, no. 6, pp. 552.e7-552.e17, 2017.
- Moon and S. K. Lee, “Applying of decision tree analysis to risk factors associated with pressure ulcers in long- term care facilities,” Healthc. Inform. Res., vol. 23, no. 1, pp. 43-52, 2017.
- Brunello E, Marzano A, Montanari, G. Sciavicco, “Decision tree pruning via multi-objective evolutionary computation,” J. Mach. Learn. Comput. 7:167-175, 2017.
- Lan, T., Hu, H., Jiang, C., Yang, G., & Zhao, Z. (2020). A comparative study of decision tree, random forest, and convolutional neural network for spread- F identification. Advances in Space Research, 65:2052-2061.
- Vineela, D., Swathi, P., Sritha, T., Ashesh, K. (2020). Fraud Detection in Health Insurance Claims using Machine Learning Algorithms. International Journal of Recent Technology and Engineering, 5, 2277-3878.