Publication Information
ISSN 2691-8803
Frequency: Continuous
Format: PDF and HTML
Versions: Online (Open Access)
Year first Published: 2019
Language: English
| Journal Menu |
| Editorial Board |
| Reviewer Board |
| Articles |
| Open Access |
| Special Issue Proposals |
| Guidelines for Authors |
| Guidelines for Editors |
| Guidelines for Reviewers |
| Membership |
| Fee and Guidelines |
 |
Healthcare and Educational Needs of Young Children: Time to Deploy SDG Roadmap in Public Schools of Telangana, India
Rayhan Shahid Shanavas1, 2*, Ridah Shaista Shanavas2, Veeresh Pratap3
1Oakridge International School, Bachupally, Telangana 500043, India
2The Synapse Foundation, Bachupally, Telangana 500090, India
3Gokaraju College of Pharmacy, Bachupally, Telangana 500090, India
Received Date: August 31, 2024; Accepted Date: September 14, 2024; Published Date: September 27, 2024;
*Corresponding author: Rayhan Shahid Shanavas, The Synapse Foundation, 114 Road No. 7 Hill Country, Bachupally Hyderabad, Telangana, India, 500090. Email: rayhansshanavas@gmail.com
Citation: Rayhan SS, Ridah Shaista S, Pratap V. (2024) Healthcare and Educational Needs of Young Children: Time to Deploy SDG Roadmap in Public Schools of Telangana, India. Adv Pub Health Com Trop Med: APCTM-206.
DOI: 10.37722/APHCTM.2024204
Abstract
An equitable childhood is a luxury in many countries globally, and India is no different having ranked 111th among 124 countries on the global hunger index. Varied access to resources, both public and at home, as well as the socioeconomic and cultural practices of a region, are critical risk factors for different inequalities. Accordingly, we engaged with eleven public schools primarily catering to families from lower socioeconomic strata and immigrants in the Quthbullapur region of Telangana. The unmet needs ranged from disparate access to nutritious meals, sanitary conditions, educational resources such as notebooks, library, and appropriate student-to-teacher ratio apart from unrecognized intangibles impacting student’s psychological well-being like shoes and identity cards. The data from two schools with ~450 students (45:55 male-to-female ratio; aged 6 to 13) indicated that 49% of students were anemic, 32% were stunted, and 58% were underweight. The choice of sports, subjects, career aspirations, parents’ job profiles, and food consumption habits indicated a socially conservative culture. The anthropometric data, limited exposure to arts, sciences, and physical education, poor socioeconomic background, and conservative culture, all point towards a system harboring a dream gap impacting not just the children but the economic growth of India. The alarming situation highlighted by this study warrants concerted efforts from philanthropists, NGOs, local bodies, and state as well as central government to work seamlessly across SDGs (3, 4, and 10) to build an equitable society.
Keywords: Anemia, Anthropometric, Children, Gender, Schools, SDG, India
Introduction
India is evolving to be a new economic power yet it is a nation where less than 3% of its inhabitants are taxpayers, more than 90% of the population works in the unorganized sector, and 68% lives in rural India [1]. Rural-urban migration (34% urban and 26% rural) is rampant in India primarily for consistent employment, higher incomes, and improved literacy, and yet despite increasing women’s participation in the labor force and reducing fertility rate, more than 30% of even the urban population end up living in slums [2-3]. Evolving infrastructure and systemic issues can be cited for this poor performance but as India holds the position of the most populous country, the youngest country, and a potential global south leader, these challenges must be combated at the grassroot level before forging forward for a place on global leadership platforms.
Seventeen Sustainable Development Goals (SDGs) were established by the United Nations in 2015 [4]. The attainment of these SGDs (especially SDG-3, SDG-4, and SDG-10) of the United Nations agenda highlights the importance of equal access to the required resources, of high quality, by the majority of the population and a need to dynamically implement corrective measures, if a gap is seen, across design, execution as well as adoption. The official wording of SDG-3, regarding “Good Health and Well-being” is: “To ensure healthy lives and promote well-being for all at all ages.” while SDG-4 strives for improvements in education, skill development, and opportunities with formal wordings being: “Ensure inclusive and equitable quality education and promote lifelong learning opportunities for all” and lastly SDG-10 banes discrimination in all shapes and forms, and calls for nations to reduce inequalities in income as well as those based on age, sex, disability, race, ethnicity, origin, religion, or economic or other status within a country [5].
The data published from national health surveys both at the consolidated country and state level, highlights the progress made in the last few decades across multiple dimensions yet we can’t ignore that India ranks 116 among the 166 countries assessed in the SDG index with a score of 71[5]. Despite making significant improvements in maternal mortality, primary school enrollment, and poverty rate, India may struggle to achieve the majority of its goals by 2030 as planned due to the continued challenges it faces with inadequate resourcing and socioeconomic barriers [5]. Additionally, state-level data indicates significantly alarming statistics, a few far from what can be derived or assumed based on the economic contributions, presumptuous culture, and tradition of the place. Eg., Telangana state like other south Indian states culturally is known to respect its women; however recent reports have indicated that domestic violence in Telangana is higher than the national average [6-7]. While multiple initiatives to combat this issue have been initiated, there is a need for a holistic understanding of such challenges to proactively address issues in a multimodal manner and attain a formidable, and sustainable impact.
Central government designs multiple programs to combat the current and potential challenges to achieving success across health, education, and other SDGs, while the state governments adopt and, in many cases, modify the same to suit the local infrastructure and priorities. The failure to attain the SDGs by some of the states and diverse outcomes across other states indicate that while we can design robust initiatives centrally the regional resources to implement them and the cultural practices influence the outcome of these initiatives [8-9]. Hence for the central as well as state-modified policies to be successful in delivering their objectives, local datasets and insights highlighting the need gaps, and tangible as well as intangible drivers and resistors about the key interventions are crucial. Assessing the health of the children enrolled in public schools which cater primarily to families from lower socioeconomic strata and, are the nodal points for all critical interventions that the government of India plans and implements, is one such critical lever to this understanding.
Telangana is a newly formed state that bifurcated from Andhra Pradesh in 2014. Hyderabad, the capital city of the erstwhile combined Andhra Pradesh and the newly formed state of Telangana has been prospering for decades with many international and high-growth domestic companies, especially in Information Technology (IT) and Healthcare housing their large campuses in the city. These have brought in jobs not just in IT, healthcare, and allied sectors but even in the unorganized sector including driving, construction, housing, etc., raising aspirations of the locals and the incoming 36 percent migrant population [10]. Accordingly, government interventions on most SDGs, engaging both local and migrant populations, have received positive reception in the state. It is one of the states with the highest growth in the enrollment of girl children in schools, improvement in literacy rates, and the implementation of a mid-day meals program [11-14].
Yet even Telangana hasn’t crossed the aspirational sixty-four percent cutoff on the attainment of child-related critical SDGs and the situation on the ground does highlight the scope of improvement across many areas [5,11]. As an example, unequal access to the additional resources provided by government and philanthropists continues to exist across institutes cumulatively negating multiple corrective actions the state has implemented [11,14]. While there are model schools equipped with digitized classrooms, there are others where children continue to sit on the floor to study. Similarly, while toilets and drinking water facilities are available, the resources to maintain them are not available to many schools. Accordingly, the current study was conducted to gain qualitative insights into the larger needs, across education, health, and infrastructure, in public school systems and a quantitative assessment in the select primary public schools on the status of children on the indicators of health, fitness, and attainment of their aspirations. The study was conducted in the Quthbullapur region of Telangana, a prime area for migrants so that appropriate and localized interventions both from the government and CSR programs can be effectively implemented.
Methodology
Study Site and Participants
A descriptive method was used to investigate the public schools in the Quthbullapur region of Telangana. There are about 66 schools in this region. Of these, eleven schools were randomly chosen as representatives of the region for initial conversations [Phase I], and subsequently, two primary schools from these were chosen for detailed surveys [Phase II]. A total of 450 school children, 6 years to 13 years old, enrolled across class I to class V, from these two different schools formed the participant pool.
All students present in the specified class on the day of the investigation in a particular school were included in this study. Students were informed about this study and further, it was also informed that this is a voluntary study and that they have the right not to participate in the study. Then the questionnaire was distributed among all the students. The questionnaires that had significant incompletes or of the students who were not interested in participating were excluded from the data analysis.
Sampling and Data Collection
The status of the approved governmental provisions, their availability, and gaps across educational, nutritional, and infrastructure facilities for children in eleven public schools, encompassing both primary and secondary schools, was assessed through qualitative engagement and a mini-survey as a research tool with the school administrators [phase I]. Need gaps, against both the specified questions and those from their recall were mapped and a priority index based on the local understanding was obtained.
Data was collected from the students of two schools in Phase II, using a semi-structured questionnaire across demographics, their likes/dislikes, academic and physical fitness, as well as career aspirations. Family background in terms of parents’ employment, job industry, average weekly food consumption, physical activity, and reasons to miss school, etc were also collected.
The anthropometric analysis is accepted as an effective tool for the assessment of nutritional status, growth, and development of children, and hence the anthropometric measurements were taken following a standard protocol [15]. The height of the body was measured using a stadiometer in centimeters (cm) and the weight was measured by the weighing scale in kilogram (kg). Body mass index (BMI) was calculated using the formula BMI= weight in kg/ (height in meter) ^2.
Analysis
The collected data were checked, cleaned, and used for further analysis and insight generation. The demographic profile including gender, age, and other variables, etc. were described in ratios and percentages. Stunting (Low height-for-age, indicating chronic malnutrition), and Underweight (Low weight-for-age, a composite indicator reflecting both chronic and acute malnutrition) were the key anthropometric derivatives used to profile the students, from the collected heights and weights, using WHO-suggested age-appropriate height and weight Z charts post cross-referencing the recent suggestions for the Indian population [16-19].
All the collected datasets were cleaned and analyzed using the SPSS software. Independent samples t-test was used to assess the difference between various groups across tested parameters. Statistical significance was set at p<0.05.
Results And Discussion
The data from eleven schools serving 3640 students in the Quthbullapur region indicated an equitable enrollment of boys and girls into schools. While the primary schools enrolled 100 to 300 students each, the middle and high schools were larger each having 500 to 800 students. Barring one school which was significantly understaffed, both primary and high schools had similar student: teacher ratios with the average being 49:1. Though the ratio seems to be healthy, one challenge that was highlighted in these schools is the absence of dedicated subject teachers and the absence of junior assistants to conduct extra classes for academically weak students and provide the support on the administrative work.
The students benefited from the textbooks provided by the government. Some of the schools additionally also had access to breakfast generously supported by CSR initiatives of various corporate organizations. However, most schools do not have libraries, reading books, and basic physical education materials. Reliance on poor parents to provide notebooks and shoes takes away the drive to push for educational and sports excellence by the school, not to mention frustration among both children and parents due to the continued reminder of their poor economic status. The inability of parents to buy the basic amenities like belts, ties, and shoes continues to make the students and parents feel disadvantaged taking away the goodwill of getting students enrolled for studies and better life prospects. The visuals and these continued reminders along with poor quality amenities in many cases shatter their hope of giving their children a better future, and delays but do not eradicate parent’s unintended eventual action of putting their children back on menial jobs to make a living for themselves.
To understand the situation better, two schools with a total of 450 students split in 45: 55 male-to-female gender ratios were studied in detail (Table 1). We observed that the students enrolled in classes from grades 1 to 5 match the average Indian age in these classes with few outliers on the upper spectrum of the age curve. By its location, the school caters to the rural-urban migrant population, both inter and intrastate, from poor socioeconomic strata, and accordingly, many of the parents (~40%) are working in the construction/agriculture industry as daily workers. Further details of family background are presented in a later section.
| Age (years) | Male | Female | All | % |
| 6 | 11 | 32 | 43 | 10% |
| 7 | 34 | 30 | 64 | 14% |
| 8 | 37 | 49 | 86 | 19% |
| 9 | 44 | 37 | 81 | 18% |
| 10 | 42 | 43 | 85 | 19% |
| 11 | 24 | 34 | 58 | 13% |
| 12 | 11 | 12 | 23 | 5% |
| 13 | 1 | 4 | 5 | 1% |
| 14 | 0 | 5 | 5 | 1% |
| Total | 204 | 246 | 450 | 100% |
Table 1: Demographics of the participants
Table 1 Number of boys and girls across each age group from age 6 to 14 years. Only 5 students i.e., <5% were seen to be in the age groups >12 years.
Of the students who participated in the study 86% of the students stayed nearby and walked to school. About 51% of the students got their drinking water from home. In the schools that provided school-cooked lunches, only 17% of students got lunch from home while the rest consumed school-prepared meals. There was no major gender difference in these preferences for food and transportation while the carrying of water from home seemed more common among girls (~10% more) than among boys. Many students considered that water is a source of contamination and illness and thus the majority of the students preferred to carry a water bottle from home given a choice.
Most students indicated that they played near their homes for 30 minutes to 2 hours, the only physical activity apart from a 15-minute short break at school, and spent an equal amount of time watching TV. There was no concrete plan to study after school hours except for a handful of students who highlighted that they took additional classes near home to continue learning their mother tongue. Most students attend school regularly except a few who take long leaves in certain seasons; we presume it is for the family to travel to their hometown for festivals or to complete seasonal agricultural jobs back home. Only a few highlighted that this disrupted their studies as general enrollment and sustained attendance stayed within median rates. Additionally, on an average students indicated that fever (67%), upset stomach (45%), and headache (40%) were the common reasons to miss school. Body aches or stress were highlighted by only a few (~7%). While fever and stomach causes are known to be common illnesses among children, headaches warrant further investigation. This could be due to poor vision due to nutritional deficiencies or an indicator of early onset of migraine as India is a country with the highest number of migraineurs (~200 mn) in the world with both teenage and adult migraine being common [20-21].
The heights of all the students, both male and female were taken and rounded to the whole number. Mean values indicate that the average height of boys cumulatively across ages 6 to 12 years is significantly higher. The same was observed when mean data was compared at individual age levels till age 10. However, the mean height for children aged 11 and 12 years is the same for both boys and girls [Table 2]. The prevalence rate of stunting was considered based on the number of children whose height was lower than 2 standard deviations for age-appropriate average heights according to WHO Z charts. As can be seen in Table 2, about 31% of male and 37% of female children in these groups were stunted. This on an average yields 32% of the children being stunted, with children aged 6 and 7 as the most affected (56% and 68% respectively). While at each age level, the differences between boys and girls are statistically significant, there is no linear trend among girls or boys.
| Mean Height (cm) | % Stunted (<2SD) | Mean Weight (kg) | % Underweight | |||||
| Age | Male | Female | Male | Female | Male | Female | Male | Female |
| 6 | 107 | 105 | 71% | 50% | 21 | 20 | 57% | 55% |
| 7 | 110 | 108 | 65% | 71% | 23 | 22 | 65% | 71% |
| 8 | 120 | 116 | 27% | 38% | 26 | 25 | 50% | 50% |
| 9 | 127 | 122 | 22% | 20% | 29 | 28 | 46% | 68% |
| 10 | 133 | 129 | 21% | 33% | 32 | 32 | 59% | 56% |
| 11 | 135 | 135 | 13% | 15% | 36 | 37 | 70% | 54% |
| 12 | 140 | 135 | 0% | 30% | 40 | 42 | 64% | 80% |
| Average | 125 | 122 | 31% | 37% | 29 | 29 | 57% | 59% |
| p-value | 0.003 | 0.060 | 0.170 | 0.260 | ||||
Table 2: Height and Weight of Students by Age and Gender: Prevalence of Stunting and Underweight.
Table 2: The table provides data on the indicators of malnourishment across age groups. Mean height and weight for each group of children, segmented by gender and age as well as the percentage of stunted and underweight children in respective groups is described.
The body weight of the children was taken using the electronic scale after removing the footwear. The mean weight of male and female students across the age groups individually and cumulatively did not differ in a statistically significant manner. However, on average close to 58% of the students were underweight (considering the WHO definition of body weight below 2 standard deviations of the median age-appropriate weight as underweight) [22-23]. While numerically the percentage of underweight children within each age group differed across the two genders, we did not observe any statistically significant disadvantage for either gender [Table 2]. Additionally, 74% of male students had a BMI lower than the median while 64% of the female children had a BMI lower than the median value [24]. More importantly, most of the underweight boys belonged to the severe category (54% belonged to the BMI lower than 2 and 3 SD of the median BMI). Girl students fared slightly better with 46% of girls being below 2 and 3 SD lower than the median of which only 18% were in the < 3 SD category, a stark indicator that girls are not at a specific disadvantage at least in this age group.
Sports were not big across all the schools we engaged with. The Indian national government schemes such as Khelo India and Sports Festival from the School Games Federation of India (SGFI) are the popular annual events that schools prepare for [25-26]. Given poor access to any sports facilities, it was not surprising to see that the school and children tended to choose common sports that don’t need any sporting’s tools such as Kho-Kho, Kabaddi, and Running. The detailed student data yielded some stark differences in the likes and dislikes between boys and girls. Boys like Cricket and Kabaddi more than girls while girls prefer Kho-Kho, and skipping. On the contrary, there wasn’t a statistically significant difference among these children for their liking towards reading, or writing.
| Sports | % Boys | % Girls |
| Cricket | 30% | 4% |
| Kho-kho | 11% | 47% |
| Skipping | 1% | 13% |
| Kabaddi | 29% | 14% |
| Running | 3% | 2% |
| Reading | 6% | 8% |
| Writing | 5% | 6% |
Table 3: Preferences by Gender for Type of Sports. Table 3 describes the relative preferences of boys and girls for various sports including cricket, KhoKkho, Kabbadi as well as Running and Sskipping. The data for their liking for reading and writing are also included.
Cricket traditionally, called a gentleman’s game, started as a children’s game in South England and spread across the nations with the expansion of the British empire. However, it continued to be a male-dominated game for many centuries until recently. Thus the preference of the game by boys isn’t surprising. Similarly, Hockey and Kabbadi are other male-dominated games and thus the preference by boys compared to girls emphasizes the deep-rooted beliefs including judgments and stereotyping in India where patriarchy is considered a normal cultural norm. While Kabbadi was preferred more by boys, the proportion of girls liking Kabbadi was 14%, much higher than other male-dominated sports; The popularity of the sport under the name Chedugudu in Telangana and Andhra Pradesh may have led to this broader acceptance among girls.
KhoKho is a game from the prehistoric era, and based on the Indian mythology Mahabharatha, it is believed to have been played for centuries and originated in the southwest state of Maharashtra. Even though the game has been traditionally played by both genders, in the real world it is considered to be a girl’s game as evidenced in our study too wherein liking by girls and boys was in a 4.5 to 1 ratio. It is the 2nd most popular sport in India and is associated with agility and speed. Similarly, while not in large proportions, 12% of girls liked Skipping an activity that is global and considered as an excellent cardiovascular exercise. However, it does have a perception of being a girl’s game played during sleepovers, and in front yards while watching mothers cook dinner; not even 1% of boys have chosen this as their favorite sport.
Previous studies show that multiple government interventions over the last few decades have made significant progress, yet children from marginalized communities continue to be vulnerable [27]. While children are being enrolled by parents in higher numbers in schools due to fear of child labor laws and as an incentive to not worry about a meal for their children, these underlying cultural behaviors, if uncorrected, combined with lapses in execution of even the best-designed strategies towards overall personality development will significantly delay the progression of Indian children from these vulnerable population. As an example, an intervention of increased awareness and improved access to all sports for all children is a must. However, while programs such as Khelo India triggered a sports momentum among youngsters across all schools and segments of societies, we believe this data combined with poor anthropometric measures and high rates of anemia indicates that students from public schools continue to lag. This warrants a “Fit India” campaign with an augmented focus on providing holistic healthcare and wellness specifically to primary public-school children hailing from poor socio-economic strata.
| Children’s Interests | Parents Job Profile | ||||
| Subject | % Boys | % Girls | |||
| English | 34% | 30% | Job Sector | % Fathers | % Mothers |
| Telugu | 26% | 37% | Company | 10% | 1% |
| Maths | 37% | 30% | Business | 7% | 2% |
| Science | 2% | 2% | Driver | 32% | 0% |
| Career Aspirations | Housewife | 0% | 46% | ||
| Police | 68% | 18% | Labor | 42% | 36% |
| Teacher | 6% | 39% | Agriculture | 8% | 13% |
| Doctor | 19% | 37% | Teacher | 0% | 1% |
Table 4: Interests, Aspirations and Background.
Table 4 provides the career aspirations of the children by gender, their favorite subjects in school, and the job profiles of their parents.
The majority of the boys aspired to take up army, police, and collector jobs, the latter being <3%. Compared to these choices by 68% of boys, about 18% of the girls also wanted to join the police force (Table 4). The determination and intent to serve the country seemed strong with “curbing of the corruption” being cited as the most prominent reason. A similarly high percentage of girls want to become doctors (37%) and teachers (39%), with the intent to serve mankind and to heal the ailing people. The majority of the children who wanted to become teachers cited their teachers as a role model, ones who have been kind and patient with them while teaching both school-mandated subjects and life skills. A higher percentage of boys aspired to become a doctor than a teacher, 19% and 6% respectively.
The preference for languages collectively seemed similar across both genders though numerically more boys liked English (34% vs 30%) while statistically more girls preferred Telugu (37% vs 26%). Though many wanted to become doctors (56%), only 4% liked sciences while math was favored by 67% of students (37% boys and 30% girls). This could primarily be because Indian culture emphasizes attaining math and language skills, especially in primary schools and according to the current curriculum primary school students do not have exposure to human biology. On the contrary, while 67% of the children liked math, very few wanted to become engineers. However, this brings out the crucial topic of skill development and preparedness for jobs as children transition from primary to higher school standards. With English as the primary language of teaching in the majority of schools, at least in urban cities, these children struggle to understand and assimilate critical analytical and knowledge-gaining skills. With socioeconomic conditions prevalent at home, few are prodigies and most successful stories belong to those who had a breakthrough in the form of additional scholarship-based coaching or admissions into CSR-funded residential schools. These are exceptions and unfortunately, most children from these backgrounds do not have extra support from home for their education or their physical and physiological well-being. Additionally, the parents expect schools to take complete care of their children and yield individuals who can be employed better than themselves if not become officers; In short, they expect the school to yield students who can break their inter-generational poverty circle. Thus we need to understand and induce additional educational support or teaching methods that can strengthen the skills, impact literacy of these children towards their chosen dream, and equip them to become financially independent through opportunities beyond what their current socioeconomics offer.
Most children’s aspirations were driven by their values and role models. However, the gap in physical education and sciences can significantly affect the realization of their dreams. In another study with senior school students (manuscript under preparation), we found that the majority of the adolescent students modify their aspirations to align with their parent’s field or profession. While the number of children enrolled in schools has significantly increased across Telangana and India in general, the enrollment rates in senior secondary schools and subsequent higher education institutes seem to be low with boys dropping from senior to senior secondary transition while girls dropping from senior secondary to higher education, negatively impacting labor force participation [28]. This shows that though students start strong with zeal and determination, poor exposure to role models, poor academic performance with limited coaching and guidance at home, and lack of clear line of sight for better career opportunities could be pushing them to settle down for fields that are familiar to them. As an example, one of the secondary school students highlighted her passion for being a fashion designer even though she loved math as a subject as her mother is a tailor and she felt her choice was more practical allowing her an option to gain at-home experiential learning and become financially independent. These gaps in what is being taught at school versus what eventually is useful for children’s career choices, and the need as well as the lead time to become financially independent lead to the dream gap. The insights that children seek role models, and need experiential exposure to their chosen field provide us with an opportunity to modulate the current curriculum providing the right incentives to the children to attain their goals and that of the nation as a whole.
As can be seen in Table 4, the majority of the children come from families with both parents working primarily to make ends meet, and hence economic rather than gender equality is driving this parity of employment state by gender. Additionally, many women continue to be employed as homemakers (42%) and daily wagers (36% as laborers i.e., working as contract employees usually in the construction industry). The families are mainly migrants, with the majority coming from nearby rural areas who have come to the city to supplement the gap in their incomes due to the seasonality of the agricultural jobs in their native villages. Economic growth in the city has created jobs such as driving, and company jobs albeit at contract level for security, housekeeping, etc; these have become popular, especially among men. The driving jobs are considered more respectable, provide steady income, and create pathways for settling in urban areas. Numerically children from families with parents working in the private sector showed more aspiration towards higher-end jobs such as becoming a collector or a minister; however, there was no clear correlation between parent’s job sector and children’s aspirations, potentially due to the small sample size. Further, the study wasn’t focussed on attaining such nuances but these insights do provide us the impetus to plan larger and more detailed studies in the future.
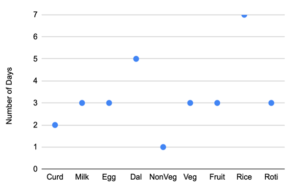
Figure 1: Average weekly consumption of various food categories.
Figure 1: Describes the average weekly consumption of different food by school children.
On average, students indicated that they consume non-vegetarian food, generally chicken, once a week. Dairy products like milk and curd as well as eggs, vegetables, roti (bread), and fruits are consumed 2 to 3 times a week. The staple food is rice with dal, the lentil curry (Figure 1). Most of the students do not have breakfast before starting from home though few get some money to buy biscuits or chips on the way to or back from school. The average consumption of all food groups is far below the recommended averages potentially highlighting why the Indian children in general and in this study population have high stunting as well as underweight rates [29]. Further in addition to poor exposure to nutritious food during the postnatal phase and early childhood in many of these families, this unbalanced diet could be adding to the high anemia levels continuing to be observed in these children (manuscript under preparation). Most students indicated their liking for carbohydrate-rich vegetables like potatoes and less for green ones like beans or spinach further highlighting the aggravated gap in delivering a balanced diet in the real world even when mid-day meals are made available.
School administrators as well as the students highlighted that the world’s largest free school meal program (i.e., mid-day meal scheme or MDMS) was a primary driver for the gross primary school enrollment rates. This positive impact as well as the heterogeneity of this impact on students and across states was in line with the reports published earlier using the national data [30]. Most of the students indicated that they are nonvegetarians, and can consume meat, mostly chicken, only once a week due to economic reasons. Hence the vegetarian nature of the MDMS takes away any sense of excitement or pull factor from the students. Further with the mineral and vitamin deficiency and the low amount these students consume, one shouldn’t be surprised that the assumed nutrition isn’t being achieved by most students. While a twice-a-week egg provision is included, perhaps MDMS should make fortified food mandatory and consider portion size optimization. In 2023, the Telangana government has indeed proposed revamping MDMS, which is still under the planning stage and is expected to address the challenges identified in this study [31].
We tried to assess the nuances behind the broad categories of issues seen with MDMS though our sample size is small. In terms of the logistics concerns, it was found that when the student population is small, it’s economically not viable to cook the meals at the school and even if they do the quality is not optimal. In such schools even if lunch is catered from central kitchens, they get delivered in the morning hours. The food gets cold by lunchtime and is unappealing to most students, especially the younger ones. Further with the culture of considering food as a god, when certain food items like lentils or eggs are not consumed by students, the local organizers tend to change the menu for the subsequent weeks potentially compromising the overall nutritional benefits carefully curated to have been delivered through this scheme.
There are certain schools where hot food is being organized through local organizations and trusts. In this case, we found that the students were more energetic, appreciated their food, and shared their happiness towards the same. The teachers also highlighted that it has made a big difference both in the attendance and the performance of the students. The hotness of the meal, associated in India culturally with the freshness of the food is also making a huge impact on this assessment. Similar points were observed in a few other schools where lunch was prepared on campus and served hot. The satisfaction rates were higher. The current study was small and not intended to deliver a robust improvement plan but to bring forward the current status and any indicators of the priority areas. However, the authors find it plausible that this critical insight of connecting hot food with freshness and even perhaps being treated with love and respect could be instrumental in improvising the program. We propose that the national organization give the freedom to the schools and or districts to choose between breakfast and or lunch, whichever options can help them provide hot fresh food to students.
We also understood that the majority of the students do not have breakfast at home (%, p<0.05); they are unable to focus on their studies during the morning hours, and when lunch isn’t optimal, the motivation of the students and the parents with the publicly funded school education is dissipating. Some parents who can afford tend to send part of the lunch, generally rice. While nationally we are focussing on a single meal, a few organizations through their CSR initiatives have successfully addressed this gap by providing breakfast and it is yielding augmented results. Accordingly, we recommend the government promote local corporations to use their CSR funds to proactively sponsor the second meal, in parallel to MDMS, to address the nutritional needs of the children, truly yielding an equitable and nourished society.
In summary, the study highlights the nutritional gaps leading to stunting, underweight, and anemic state, a potentially under-resourced education system negating the determined and zealous dreams of children, and lastly, cultural challenges impeding the psychological and physical growth of the children. Combined with a poor socioeconomic background and a socially conservative culture, the family’s complete reliance on the government to transform their children’s lives, especially pulling them out of poverty, indicates central government needs to design holistic solutions and the regional governments need to proactively consider the cultural sentiments and showcase every small win to deliver effective outcomes.
We recommend that armed with these insights, we should charge forward collectively through the improvised policies from the government, augmented financial support from corporations, and execution excellence by a culturally aware community partner ecosystem. Towards the same, we recommend that we should develop public schools as centers of excellence that can provide education, as well as metabolic, physical, and emotional well-being through school and regional partner ecosystems. To ensure that holistic growth opportunities are fully leveraged by the children, we must engage parents to build confidence in the ‘added value of attending the school ecosystem” by showing skill development, optimal physical and mental growth, as well as role modeling toward the future of their children. Robust governance should be inducted to channel CSR funds and volunteering efforts for government-defined activities designed toward the attainment of the SDGs. Each school should have an accountable structure with the potential to make success across SDGs transferable across schools and states.
Acknowledgments: The authors would like to thank the heads of the schools, study participants, their family members, and teachers from the participating schools.
Funding: The authors declare that no funds, grants, or other support were received during the preparation of this manuscript.
Conflict Of Interest : The authors do not have any conflict of interest to be declared.
Author Contributions
RSS(1) and RSS(2) designed the study. RSS(1) collected the data along with the teachers of the school and the volunteers. RSS(1) evaluated the questionnaires and cleaned the datasets while RSS(1) and RSS(2) conducted the statistical analysis and assessed the findings for critical insights against published literature. RSS(2) and PV guided the over-all program hypothesis, testing, and the relative importance of the results in the context of the community being assessed. RSS(2) provided a broader structure to the manuscript while RSS(1) drafted the manuscript and consolidated inputs from all the senior authors. RSS(2) and PV reviewed and approved the final manuscript.
References
- “Unorganized Worker | Ministry of Labour & Employment.” Labour.gov.in, labour.gov.in/unorganized-workers.
- Singh, Kulvinder. “How India Moves: Understanding Patterns of Migration within the Country.” The Wire, 6 May 2024, the wire. in/urban/how-india-moves-understanding-patterns-of-migration-within-the-country.
- Kaushik, Krishn, et al. “India’s Migrant Millions: Caught between Jobless Villages and City Hazards.” Reuters, 18 Apr. 2023, www.reuters.com/world/india/indias-migrant-millions-caught-between-jobless-villages-city-hazards-2023-04-18/.
- United Nations. “The 17 Sustainable Development Goals.” United Nations, sdgs.un.org/goals.
- “Reports on SDG | NITI Aayog.” Www.niti.gov.in, www.niti.gov.in/reports-sdg.
- “Welcome to Women Safety Wing, Telangana Police.” Telangana Police Women Safety Wing, 19 Oct. 2021, womensafetywing.telangana.gov.in. Accessed 24 Aug. 2024.
- Mohandas, Anu, et al. “Prevalence and Associated Factors of Domestic Violence among Married Women in an Urban Slum in South India.” Journal of Family Medicine and Primary Care, vol. 11, no. 3, 2022, p. 1006, https://doi.org/10.4103/jfmpc.jfmpc_1133_21.
- CSR, India. “Education Receives Highest Share of CSR Funds in India.” India CSR, India CSR, 30 Dec. 2022, indices. in/education-receives-highest-share-of-csr-funds-in-india/. Accessed 24 Aug. 2024.
- Manku, Moyna. “Are CSR Funds in Education Being Used Smartly?” Mint, 21 Jan. 2017, www.livemint.com/Politics/Oy4gGPHkprROiZ99ypQmoI/Are-CSR-funds-in-education-being-used-smartly.html.
- “Demographics of Hyderabad.” Wikipedia, 20 Oct. 2022, en.wikipedia.org/wiki/Demographics_of_Hyderabad.
- Ministry of Human Resource Development. National Education Policy 2020 Ministry of Human Resource Development Government of India. 2020, www.education.gov.in/sites/upload_files/mhrd/files/NEP_Final_English_0.pdf.
- “Health National-Family-Health-Surveys-Nfhs Statistics and Growth Figures Year-Wise of Telangana– Indiastat.” Indiastat.com, 2020, www.indiastat.com/telangana-state/data/health/national-family-health-surveys-nfhs. Accessed 24 Aug. 2024.
- https://www.facebook.com/cnu789. “Mid-Day Meal Menu to Be Changed in Telangana – Telangana NavaNirmana Sena.” Telangana NavaNirmana Sena, June 2023, www.tgnns.com/telangana/mid-day-meal-menu-to-be-changed-in-telangana/2023/06/01/.
- Rao, Shri. ANNUAL REPORT 2022 2023. tgtpc.telangana.gov.in/wp-content/uploads/2024/04/Telangana-Industries-Dept-Annual-Report-2022-23.pdf.
- Weiner, J. S. (Joseph Sidney), 1915- and Lourie, J. A. (John Adam), 1943-. Practical human biology / J.S. Weiner and J.A. Lourie Academic Press London; New York 1981.
- World Health Organisation. “Growth Reference 5-19 Years – Height-For-Age (5-19 Years).” Www.who.int, 2007, www.who.int/tools/growth-reference-data-for-5to19-years/indicators/height-for-age.
- Subramanian, S. V., et al. “Should India Adopt a Country-Specific Growth Reference to Measure Undernutrition among Its Children?” The Lancet Regional Health – Southeast Asia, vol. 9, Feb. 2023, pp. 100107–7, https://doi.org/10.1016/j.lansea.2022.100107. Accessed 24 Aug. 2024.
- “Indian Height-Weight Chart according to Age.” Horlicks. in, 2017, www.horlicks.in/kids/horlicks/articles/indian-height-weight-chart-according-to-age.html.
- Majumder, Rajesh, et al. “Anthropometric Growth Reference for Indian Children and Adolescents.” SSRN Electronic Journal, 2023, https://doi.org/10.2139/ssrn.4514754. Accessed 24 Aug. 2024.
- Mehndiratta, Man Mohan, and Vasundhara Aggarwal. “Neurological Disorders in India: Past, Present, and Next Steps.” The Lancet Global Health, vol. 9, no. 8, Aug. 2021, pp. e1043–44, https://doi.org/10.1016/S2214-109X(21)00214-X.
- Anandh A. “Test.” International Journal of Research in Pharmaceutical Sciences, vol. 14, no. 2, Pharmascope Foundation, May 2023, pp. 74–78, https://doi.org/10.26452/ijrps.v14i2.4276. Accessed 24 Aug. 2024.
- World Health Organization. “Malnutrition in Children.” Www.who.int, 2023, www.who.int/data/nutrition/nlis/info/malnutrition-in-children.
- de Onis, Mercedes. “Development of a WHO Growth Reference for School-Aged Children and Adolescents.” Bulletin of the World Health Organization, vol. 85, no. 09, Sept. 2007, pp. 660–67, https://doi.org/10.2471/blt.07.043497.
- World Health Organization. “Growth Reference 5-19 Years – BMI-For-Age (5-19 Years).” Www.who.int, 2007, www.who.int/tools/growth-reference-data-for-5to19-years/indicators/bmi-for-age.
- “Khelo India #SaathMeinHainHum.” Kheloindia.gov.in, 2019, kheloindia.gov.in/.
- “School Games Federation of India.” Sgfi.org.in, 2023, www.sgfi.org.in. Accessed 24 Aug. 2024.
- Jain, Anoop, et al. “Socioeconomic Inequality in Child Health Outcomes in India: Analyzing Trends between 1993 and 2021.” International Journal for Equity in Health, vol. 23, no. 1, BioMed Central, July 2024, https://doi.org/10.1186/s12939-024-02218-z.
- Pradesh, Andhra. Economic Survey 2023-24 Statistical Appendix | Secondary Schools (IX-X) Sr. Secondary Schools (XI-XII) Higher Education (18-23 Years Age Group) (1) (2) (3) (4) (5) (6) (7) (8) (9) (10) (11) (12) (13). 2021, www.indiabudget.gov.in/economicsurvey/doc/stat/tab83.pdf. Accessed 24 Aug. 2024.
- Gupta, Piyush, et al. Nutrition for Children between 5-12 Years GUIDELINES for PARENTS Indian Academy of Pediatrics (IAP) under the auspices of the IAP Action Plan 2021-2022. iapindia.org/pdf/Ch-044-Nutrition-5-12-y-IAP-Parental-Guidelines-28112021.pdf.
- Kaur, Randeep. “Estimating the Impact of School Feeding Programs: Evidence from Mid Day Meal Scheme of India.” Economics of Education Review, vol. 84, Oct. 2021, p. 102171, https://doi.org/10.1016/j.econedurev.2021.102171.
- “Mid-Day Meal Menu to Be Changed in Telangana – Telangana NavaNirmana Sena.” Telangana NavaNirmana Sena, June 2023, www.tgnns.com/telangana/mid-day-meal-menu-to-be-changed-in-telangana/2023/06/01/.