ISSN: 2641-6816
Frequency: Continuous
Format: PDF and HTML
Versions: Online (Open Access)
Year first Published: 2018
Language: English
| Journal Menu |
| Editorial Board |
| Reviewer Board |
| Articles |
| Open Access |
| Special Issue Proposals |
| Guidelines for Authors |
| Guidelines for Editors |
| Guidelines for Reviewers |
| Membership |
| Fee and Guidelines |
 |
From Weight Management via Diabetes Control to Cardiovascular Risk Reduction
Gerald C Hsu*
eclaireMD Foundation, USA
Received Date: April 03, 2020; Accepted Date: April 15, 2020; Published Date: April 24, 2020
*Corresponding Author: Gerald C Hsu, eclaireMD Foundation, USA. Tel: +15103315000; E-mail: g.hsu@eclairemd.com
Citation: Hsu GC (2020) From Weight Management via Diabetes Control to Cardiovascular Risk Reduction. Adv Nutri and Food Sci: ANAFS-177.
Abstract
The author has been diagnosed with three chronic diseases including type 2 diabetes (T2D), hypertension, and hyperlipemia. Since 2010, he focused on T2D research to save his life. He collected and processed approximately 1.5 million data regarding his health and life details. In 2014, he developed a mathematical model of the metabolic system by using mathematics and various engineering modeling. This paper describes the 8-years of working methods utilized during a variety of stages. It specifically discusses the relationship and results from weight management via diabetes control to lowering his risk probabilities of having heart attack or stroke.
Keywords: Artificial Intelligence; Chronic Diseases; Heart Attack; Hyperglycemia Control; Lifestyle Data; Math-Physical Medicine; Metabolic Conditions; Metabolism; Risk Probabilities; Stroke; Type 2 Diabetes; Weight Management
Introduction
Since 1997, the author has been diagnosed with three chronic diseases such as type 2 diabetes (T2D), hypertension, and hyperlipidemia. As shown in Table 1, his health reached to a “near collapsed” condition by 2010; therefore, he launched his type 2 diabetes (T2D) research in order to save his own life. From 2012 to 2018, he has collected and processed approximately 1.5M data regarding his own health and body conditions. During 2010-2013, he studied six chronic diseases and food nutrition in depth. In 2014, using mathematics and various engineering modeling, he developed a mathematical model of the human metabolism system, which contains 11 categories and ~500 elements. Currently, as shown in Table 1, his chronic disease conditions are now under control. This paper described his effort for 8-years in terms of annualized segments with different working methods utilized at different stages. It specifically discusses the relationship and results from weight management via diabetes control to lowering his risk probabilities of having heart attack or stroke.
Health Exam Record
2010
2017
A1C (<6.4%)
10.0
6.1
90-days Average Glucose (<120mg/dL)
279
113
ACR (<30)
116.4
12.3
Triglyceride (<150)
1161
67
HDL (>40)
24
48
LDL (<130)
174
74
Total Cholesterol (<200)
253
118
BMI (<25.0)
31.0
24.7
Weight (lbs.)
210
167
Waistline (inch)
44
34
Methods
The author, who is also the patient, checks his body weight twice a day in the morning and at bedtime. Using the finger-piercing method, he measures his fasting plasma glucose (FPG) in the early morning before starting his meals and activities. He also measures his postprandial plasma glucose (PPG) three times a day, approximately two hours after the first-bite of each meal. He checks his blood pressure (BP) at least once a day, preferably in the early morning, but sometimes multiple measurements as needed. Every three months, he goes to the same hospital to analyze his lipid conditions. Therefore, his lipid data amount is only around 1% of his other health conditions such as weight, glucose, and BP.
Using customized artificial intelligence (AI) software on his iPhone, he collected various detailed lifestyle data such as medication, salt intake, stress, sleep, illness, water, food and meal quantity, carbs/sugar intake, exercise, weather, etc. Finally, he has utilized these big data to conduct many useful correlation analyses among weight, chronic diseases, and lifestyle factors.
From 2015 to 2017, based on his metabolism model, he developed four prediction models, including weight, fasting plasma glucose (FPG), postprandial plasma glucose (PPG), and hemoglobin A1C (A1C). All of these prediction models have reached to 95% to 99% data accuracy over a period of approximately four years (~1,500 days). Utilizing these prediction models, he could successfully reduce both of his weight and blood sugar. His BMI scores were classified as obese at first, then overweight, and finally to normal range. As a result, his diabetes is under control and both of his hypertension and hyperlipidemia conditions are no longer health issues. During the spring of 2018, he further extended his T2D research into the study of Risk probability of having heart attack and stroke due to chronic diseases.
During a period of 2,391 days (1/1/2012 – 7/20/2018) with ~30,000 collected raw data, which are directly related to this paper, the author further extracted other relevant information out from this big data pool in order to process them according to his designed process flow. He finally categorized them according to an annualized format for easier viewing of data trends from year to year (see Table 2).
Year
Weight (lbs)
Weight (170 lbs as base)
Weight loss (lbs)
Max Weight
Min Weight
Weight Delta
BMI
Waist Line (inch)
Waist Line Loss
FPG (mg/dL)
PPG (mg/dL)
Daily Glucose (DG)
DG Delta
FPG / lbs
Predicted A1C
Lab A1C
Lab A1C (6.4% base)
Food Amount (M9a)
Food Quality (M9b)
Crabs & Sugar (gram)
Post Meal Walk (steps)
Daily Walk (steps)
Daily Walk (km)
Heart & Stroke Risk
2000
220
129%
32.1
46
280
0%
140%
74
2010 *
194
114%
28.3
45
1
160
120
9.10%
10.00%
156%
130%
66
2012
189
111%
5
194
183
11
27.6
44
1
127.7
32
7.20%
6.90%
108%
112%
62
2013
183
108%
6
190
176
14
26.7
43
1
135.4
132.7
132.5
-5
1.5
7.50%
6.70%
105%
106%
7,564
5
38
2014
177
104%
6
183
173
10
25.8
40
3
127.9
137.2
134.6
-2
1.8
7.60%
6.80%
106%
100%
11,767
8
42
2015
175
103%
2
184
167
17
25.5
38
2
120.6
129.9
128.7
6
0.9
7.40%
6.80%
106%
94%
91%
14.2
1,900
14,997
10
39
2016
173
102%
2
178
167
11
25.2
35
3
120.2
117
119.4
9
1.7
6.80%
6.60%
103%
88%
91%
15.5
4,110
17,017
11
31
2017
174
102%
-1
180
167
13
25.4
33
2
119.8
116.5
117.4
2
1
6.70%
6.50%
102%
85%
97%
14.2
4,440
17,863
12
26
2018
171
101%
3
176
167
9
25
32
1
116.9
116.5
117
0
1.7
6.70%
6.50%
102%
84%
99%
14.5
4,499
17,976
12
31
Avg
184
108%
3
184
171
12
26.8
40
2
123.5
125
124.9
2
1.4
7.10%
7.10%
111%
88%
94%
14.6
3,737
14,531
10
34
Change (13-18)
23
129%
2.6
12
43
2.40%
3.50%
28%
2,599
6,967
35
Although the author suffered three separate cardiac episodes from 2001 to 2006, he did not link his health risks to his chronic diseases due to his ignorance. Therefore, he hardly kept any data during that decade except for keeping a few significant health records. In 2010, he got his wake-up call from the strong possibility of having dialysis when he received the following lab results: albumin/creatinine ratio 116.4 mg/g, A1C 10% and triglycerides 1161 mg/dL. He then immediately ceased all of his ongoing technology business activities, moved into a stress-free retirement community away from Silicon Valley (one of his stressors), and also launched his own T2D research. However, to start this effort successfully, he dedicated his time to study six chronic diseases first in 2010 and throughout 2011. Therefore, after 2012, he started to collect his complete set of health data, including both medical conditions (~10%) and lifestyle details (~90%). Within this total set of approximately 1.5 million data, there are about 300,000 raw data collected by the computer and other 1 million+ data from information processing, which have been saved in a cloud server for other future studies. It should be noted that both A1C and lipid data were only available from his quarterly lab tests, not on a daily basis. However, the author has developed a predicted daily A1C that has reached to 95% accuracy since he added in an uplifted 3% to 8% of “safety margin” in order to provide an early warning to himself. Without this build-in safety margin, his predicted A1C data would reach to 99% accuracy.
Unlike the incomplete data collected in 2010, the data integrity after 2012 is accurate, valid, and complete.
Results
During the period of 1/1/2012 – 7/20/2018, his medical condition changes and major lifestyle modifications are shown in Table 1, Table 2 through Figure 3.

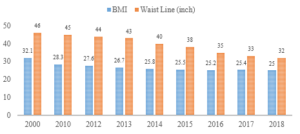
Figure 1: Weight, BMI, Waistline (2000, 2010, 2012-2018).
The summarized highlights of results are listed:
(1) Weight: – 49 / 18 lbs. (from 220 lbs. in 2000, then 189 lbs. in 2012 to 171 lbs. in 2018). Period 2012 – 2014 (3 years) has the most reduction.
(2) BMI: – 7.1 / 2.6 (from 32.1 in 2000, then 27.6 in 2012 to 25.0 in 2018)
(3) Waistline: – 12 / 10 inches (from 44” in 2000, then 42” in 2012 to 32” in 2018). Period of 2014 – 2018 (5 years) has the most reduction.
(4) Food & Meal Quantity: – 28% (over 7 years) from his normal portion of food (from 112% in 2012 to 84% in 2018)
(5) Daily Walking: + 10,412 steps in 5 years (from 7,564 in 2013 to 17,976 in 2018). Period of 2016 – 2018 has the maximum exercise amount.
(6) Post-Meal Walking: + 2,599 steps in 4 years (from 1,900 in 2015 to 4,499 in 2018). Period of 2016 – 2018 has the maximum exercise amount.
(7) Daily Glucose: – 163 / 43 mg/dL (from 280.0 in 2000, then 160.0 in 2010 to 117.0 in 2018). Period of 2016 – 2018 has the lowest glucose values.
(8) A1C: – 3.3% (from 10.0% in 2010 to 6.7% in 2018). Period of 2016 – 2018 has the lowest values (after discontinuing diabetes medication).
(9) BP (Metabolism Index 3): – 26% (annual average SBP/DBP dropped from 127/85 to 96/64).
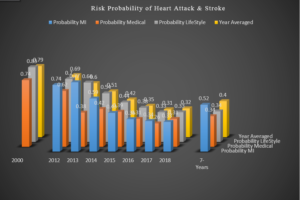
(10) Risk of heart attack or stroke: – 43% (from 74% in 2000 to 31% in 2018, with 3 cardiac episodes during 2001 – 2006 and none afterwards)
Based on his research results published in the past (see references), a few key conclusions are described as follows:
- Main causes of his weight loss are reduced by food quantity consumption and increased daily walking steps.
- It took 3 years to reduce his weight and 5 years to reduce his waistline.
- Based on his annualized data, he was obese (BMI > 30) prior to 2010 and overweight (BMI between 25 and 30) during 2012 – 2017. His weight has been less than 170 lbs. (BMI is normal, around 24.7) in 2018.
- His reduced FPG below 120 mg/dL is driven by his weight reduction. The combination of his carbs/sugar intake around 14.3 grams and post-meal walking around 4,000 steps has caused his PPG to go below 120 mg/dL as well.
- His lab-tested A1C value was reduced from 10% in 2010 (average daily glucose above 200 mg/dL) to 6.7% in 2018 (average daily glucose around 117 mg/dL). It should be noted here that he has discontinued all of his diabetes medication for almost 3 years, since 12/8/2015.
- His risk probability of having heart attack or stroke was 74% in 2000. During the period of 2001 through 2006, he suffered three cardiac episodes and none afterwards. By 2017, the same risk factor has reduced to 26.4% (comparable with Framingham Study of 26.7% risk in 2017).
- He was diagnosed with hyperlipidemia in 1992, before his diagnosis of T2D in 1997. He noticed the effects of his hypertension condition in 2013 – 2015. However, after 2015, both of his hyperlipidemia and hypertension are no longer threats to his health.
- He suffered complications from T2D such as renal dysfunction, infections from his bladder, foot ulcer, eye issues, and so forth. To date, all of these problems seem to be under control.
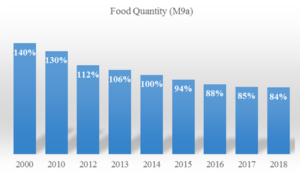
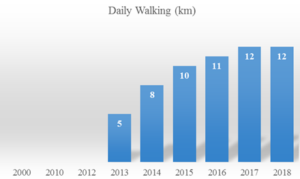
Figure 2: Comparison of Food Quantity & Walking.

Figure 3: Comparison of Lab-tested A1C Values (2010 – 2018).
Year
Probability MI
Probability Medical
Probability Lifestyle
Year Averaged
2000
74%
83%
79%
2012
74%
62%
70%
69%
2013
77%
38%
66%
60%
2014
59%
42%
54%
51%
2015
43%
39%
44%
42%
2016
36%
31%
38%
35%
2017
34%
26%
33%
31%
2018
33%
31%
33%
32%
7-Years
52%
34%
34%
40%
Biography: The author received an honorable PhD in mathematics and majored in engineering at MIT. He attended different universities over 17 years and studied seven academic disciplines.
He has spent 20,000 hours in T2D research. First, he studied six metabolic diseases and food nutrition during 2010-2013, then conducted his own diabetes research during 2014-2018. His approach is “quantitative medicine” based on mathematics, physics, optical and electronics physics, engineering modeling, signal processing, computer science, big data analytics, statistics, machine learning, and AI. His main focus is on preventive medicine using prediction tools. He believes that the better the prediction, the more control you have.
Limitation of Research
This article is based on data of metabolic conditions and lifestyle details collected from one T2D patient (himself). It does not cover genetic conditions and lifestyle details of other diabetes patients. However, the author’s research approach is based on his solid inter-disciplinary academic background and successful multiple industrial experiences. His academic background and working experience have prepared him to conduct his diabetes research with the following thorough process and carefully chosen steps:
- Observing and identifying a system’s basic characters like a pure physicist;
- Developing related but rigorous mathematical equations like a mathematician;
- Applying suitable engineering models and useful statistical models to address the real world challenges;
- Using modern computer science tools and sophisticated AI techniques to aid in problem solving.
Nevertheless, his conclusions and findings should be re-verified and proceed with caution when applying to other patients who are under different metabolic conditions or lifestyles.
Other Declarations
During the past 8 years of self-study and research, the author has never hired any research assistant or research associate to help with his work except for a part-time computer programmer (~3 evening hours per day) to focus on Apple iOS annual upgrades and system interface problems. He applied his own invention of a “Software Robot” created during 2001-2009 and AI knowledge to produce the architecture and structure of his customized computer software. He used this software to collect and analyze his big data, conduct his medical research, and to control his diabetes disease.
This project was 100% self-funded by using his own money that was earned from a successful high-tech venture in Silicon Valley. He did not receive any financial assistance or grants from any public or private institution or organization. Therefore, there are no concerns regarding any conflict of interest.
Conclusion
This report is about one patient (the author) over a 20-year period. He has collected and processed approximately 1.5 million data, particularly during the period of 2012-2018. He has spent 20,000 hours to conduct his research regarding chronic diseases and his own health. This dynamic big data analytics using tools, such as advanced mathematics, physics, signal processing, optical physics, engineering modeling, machine learning and AI, should be equally effective for analyzing other patient’s conditions. Although some data may be slightly different, the results and conclusions should be applicable to other T2D cases. In this article, there are no new breakthrough findings about medicine, but the author is able to provide quantitative proof to support those existing knowledge in modern medical community.
Acknowledgements
First and foremost, the author wishes to express his sincere appreciation to a very important person in his life, Professor Norman Jones at MIT and University of Liverpool. Not only did he give him the opportunity to study for his PhD at MIT, but he also trained him extensively on how to solve difficult problems and conduct any basic scientific research with a big vision, pure heart, and integrity.
The author would also like to thank Professor James Andrews at the University of Iowa. He helped and supported him tremendously when he first came to the United States. He believed in him and prepared him to build his solid engineering and computer science foundation. He is forever grateful to his mentor, who has a kind heart and guided him during his undergraduate and master’s degree work at Iowa.
References
- Hsu Gerald C (2018) Using Math-Physical Medicine to Control T2D via Metabolism Monitoring and Glucose Predictions. Journal of Endocrinology and Diabetes 1-6.
- Hsu Gerald C (2018) Using Math-Physical Medicine to Analyze Metabolism and Improve Health Conditions. Video presented at the meeting of the 3rd International Conference on Endocrinology and Metabolic Syndrome 2018, Amsterdam, Netherlands.
- Hsu Gerald C (2018) Using Signal Processing Techniques to Predict PPG for T2D. International Journal of Diabetes & Metabolic Disorders 3: 1-3.
- Hsu Gerald C (2018) Using Math-Physical Medicine and Artificial Intelligence Technology to Manage Lifestyle and Control Metabolic Conditions of T2D. International Journal of Diabetes & Its Complications 2: 1-7.
The author created this “math-physical medicine” approach by himself in order to save his own life. Although he has read many medical books, journals, articles, and papers, he did not specifically utilize any data or methodology from other medical work. All of his research is his original work based on data he collected from his body and using his own computer software developed during the past 8-years. Therefore, no major problems were associated with data interference or data contamination. In addition, his knowledge, information, technique, and methodology of mathematics, physics, engineering, and computer science came from his lifelong learning from schools and industries and should not be listed as medical references. This is the reason his references only contain his own published papers.
