Publication Information
ISSN: 2641-6859
Frequency: Continuous
Format: PDF and HTML
Versions: Online (Open Access)
Year first Published: 2018
Language: English
| Journal Menu |
| Editorial Board |
| Reviewer Board |
| Articles |
| Open Access |
| Special Issue Proposals |
| Guidelines for Authors |
| Guidelines for Editors |
| Guidelines for Reviewers |
| Membership |
| Fee and Guidelines |
 |
Examining Changes in Electromyography during Swing Performance in Various Strike Zone Locations of Collegiate Baseball Players
Charles C. Williams1*, Paul T. Donahue2, Samuel J. Wilson3, J. Grant Mouser4, Christopher M. Hill5, Jacob R. Gdovin6, Chip Wade7, John C. Garner4
1Department of Clinical & Applied Movement Sciences, University of North Florida, Jacksonville Florida 32224, USA
2School of Kinesiology and Nutrition, University of Southern Mississippi, Hattiesburg Mississippi 39406, USA
3Department of Health Sciences and Kinesiology, Georgia Southern University, Statesboro, Georgia 30460, USA
4Department of Kinesiology, Troy University, Troy, Alabama 36082, USA
5Department of Physical Education, Northern Illinois University, DeKalb, Illinois 60115, USA
6Department of Exercise Science, Winthrop University, Rock Hill, South Carolina 29733, USA
7Industrial & Systems Engineering, Auburn University Auburn, Alabama 36849, USA
Received Date: May 21, 2021; Accepted Date: June 01, 2021; Published Date: June 15, 2021
*Corresponding author: Charles C. Williams, Dept. of Clinical and Applied Movement Sciences, University of North Florida, 1 UNF Drive, Jacksonville, Florida 32224. Tel: +1(352) 317-0544; Email: c.williams@unf.edu
Citation: Williams CC, Donahue PT, Wilson SJ, Mouser G, Hill CM, Gdovin JR, Wade C, Garner JC (2021) Examining Changes in Electromyography during Swing Performance in Various Strike Zone Locations of Collegiate Baseball Players. Adv Ortho and Sprts Med: AOASM-144.
DOI: 10.37722/AOASM.2021202
Abstract
Swinging a bat is considered a sequential movement requiring coordinated muscle activation during each movement phase. There are a limited number of studies investigating swing performance as it relates to electromyography. The purpose of this study was to investigate the muscle activation pattern of the stride leg in respect to the phases within the swing and throughout the various locations within the strike zone in collegiate baseball players. Surface electromyography (EMG) examined the muscle activation patterns of the stride leg gluteus maximus (GM), vastus medialis (VMO), semitendinosus (H), medial gastrocnemius (MG), and tibilais anterior (TA) in 13 Division I college baseball players. The swing was broken down into three distinct phases for analysis (stride, transition, swing) determined by the use of a motion capture system. Participants completed counterbalanced swing trials in various locations of their respective strike zone. Repeated measures ANOVA were used to examine possible differences in EMG over the strike zone independent of each phase of the swing. Significant main effect differences in percent activation and mean muscle activity of the lower extremity were seen in trials completed at various tee heights and tee placements within their respective strike zone independent of swing phase (p<.05). Significant main effect differences in percent activation were also seen in the phases of the swing for the VMO, H, MG and TA (p<0.05). This information can provide insight to strength and conditioning professionals to focus on sport specific exercises within these distinct phases of the swing.
Keywords: DI Baseball Players; EMG; Performance; Phases; Swing
Introduction
There are just over 36,000 collegiate baseball players competing in the National Collegiate Athletic Association (NCAA) [1].The common desire of many athletic programs is to train athletes to be able to compete at their highest potential. Human performance professionals have established research investigations to optimize sport performance in areas such as improving bat velocity at ball contact. Some of these distinguishing factors that enables athletes an increased likelihood of making contact with the ball include skill level, spatial accuracy of the bat, swing mechanics, and velocity of the bat approaching ball contact [2-14].The process of swinging a bat approaching ball contact requires distinct coordination of muscle activation for this task. In order to better understand the sequencing of this motion, a limited number of investigations examining electromyography have been conducted (EMG) [15-19].
One of the foundational studies to examine changes in upper and lower extremity musculature in a swing was completed by Shaffer, Jobe, Pink, and Perry [15]. The investigators in this study recruited 18 professional baseball players and used fine wire electrodes to examine electrical activity of the triceps, posterior deltoid, serratus anterior, and supraspinatus muscles. The use of surface electrodes was placed on the erector spinae, vastus medialis, biceps femoris, and semimembranosus. Results of this study revealed trail leg hamstring activity of the biceps femoris and semimembranosus reached the highest percentage of MMT at 154% and 157% during the pre-swing phase when the lead foot reestablished contact with the ground and ended when the bat started to move forward to ball contact. The trail leg gluteus maximus reached its highest percentage of MMT at 132% during the pre-swing phase as well. The trail leg oblique vastus medials reached its highest percentage of MMT during the mid-swing phase of the swing at 107% [15].
Work by Nakata, Miura, Yoshie, and Kudo [17]; along with Nakata et al. [16] looked at changes in lower extremity muscle activity while participants were either completing a full swing or checking their swing. Investigators wanted to monitor the activation sequence in the lower extremity between 10 skilled collegiate and 10 novice baseball players with no previous baseball experience. Results of this study revealed a higher percent activation of MVIC in the skilled baseball players of the stride leg over novice baseball players in the biceps femoris, tibilais anterior, and the medial gastrocnemius when participants swung a bat with maximal effort (p< 0.05) [16]. Results also indicated a shorter peak latency in milliseconds when participants checked their swing compared to completing a maximal swing trial in the trail leg of biceps femoris, and medial gastrocnemius (p<.05) [17].
An important limitation of these aforementioned research designs is that participants made contact with a pitched ball in a position of their choosing by either a machine or by an investigator tossing a ball. Placement of the ball during a game situation can be thrown anywhere into a batter’s strike zone. According to the NCAA, “the strike zone is determined from the batter’s stance and is an area that covers the entire width of home plate. The strike zone covers the area below a batter’s kneecap to the midpoint between the top of the shoulders and the top of the uniform pants” [20] and is commonly divided into 9 distinct locations. To our knowledge, no one has examined changes in lower extremity muscle activity of the stride leg as it relates to collegiate baseball players swinging a bat in each one of these nine distinct locations of their respective strike zone. The stride leg has been shown to be a critical component of an athlete sequencing the motion of a swing as they approach contact with the ball [4, 17]. Sport coaches and athletes commonly utilize a tee that can be placed in varying areas of their respective strike zone to focus on a particular area that may need improvement based on coaching feedback, live practice, or game situations. This information can be used to assess individual areas within the swing pattern for an athlete to focus on improving one’s activation of stride leg with the ultimate goal of improving swing performance. Understanding stride leg firing patterns within a swing and across the strike zone can allow strength and conditioning professionals an insight into the particular positions these athletes need to be placed in to maximize one’s swing within a strength and conditioning setting. This information can also provide an understanding of how these muscles are activated and to what extent during swing trials completed within various locations of one’s strike zone.
Therefore, the purpose of this investigation is to examine possible changes in electrical activity of the stride leg in collegiate baseball players swinging a bat in different areas of their respective strike zone. Our next aim was to examine how this musculature changes in respect to the varying phases within a baseball swing. We suspect there to differences in muscle activity during the three distinct phases of the swing.
Methods
Participants and Design of Study
This within subjects repeated measures design compared lower leg muscle activity as it relates to the nine distinct locations of the strike zone along with different phases of a swing in collegiate baseball players. A total of thirteen (age: 19.7± 1.2 years, height: 184 ± 6.2cm, mass: 93.3 ± 9.8kg) NCAA Division I baseball position players participated in this study. Eight of the participants were left-handed batters and five of them were right-handed batters. These participants completed a physical activity readiness questionnaire (PAR-Q) and had no underlying musculoskeletal injuries. Meetings with sport coaches and players took place prior to the study to let them be aware of all benefits and risks prior to testing and willing participants were recruited for this investigation. All participants signed a University informed consent approved by the University Institutional Review Board (IRB) with the following experimental protocol.
Procedures
A Vicon Nexus 3D motion capture system (Oxford, UK) equipped with 8 near-infrared T-Series cameras was synced with a Noraxon ® Telemyo device to record all EMG measures of interest. Motion capture systems have been shown to be a reliable metric of measuring a variety of movement patterns along with being used in previous bat swing study designs [7, 12, 13, 15-17, 21]. In order to properly distinguish the phases of the swing, a modified, full body Helen Hayes marker system along with two custom models was created for both the bat and tee, used in previous studies, to have a total of 47 retro-reflective markers tracking the movement of each trial [12, 13]. Sampling rate recording these movement patterns was set at 200Hz to record each swing trial [12, 13, 16, 17] (Figure 1).
 Figure 1: Modified Helen Hayes full body marker system and custom made bat and tee marker locations, [*] represent retro reflective markers.
This study utilized a traditional hitting tee and a standard bat (SB) based on what was approved by the NCAA. A SB for collegiate baseball cannot be more than three units less than the length of the bat [22]. Participants were allowed to use either a bat that was 33 inches long, weighing 30 ounces or a bat that was 34 inches long with a weight of 31 ounces. Participants used the bat of their choice based on practice and game situations. Participants completed one laboratory visit lasting no more than two hours where they were aware of all risks and benefits prior to signing a University informed consent approved by the University IRB. Investigators asked all participants to maintain their normal activities of daily living in terms of hydration and nutrition status. The experimental protocol was completed around participant’s class and practice times during the fall semester. Anthropometric measurements of the ankle, knee, shoulder, and hand were taken prior to testing. Upon completion of paperwork, participants were prepped for EMG procedures.
This process began by shaving (if necessary), abrading, and cleaning the skin with alcohol pads at the sites for electrode placement on the lower extremity: gluteus maximus (GM), vastus medialis (VMO), semitendinosus (H), tibialis anterior (TA), and medial gastrocnemius (MG) as defined by Perotto [23]. Surface EMG signals were recorded using sliver chloride monopolar surface electrodes. The ground electrode was placed on the tibial tuberosity. Participants then completed 3 repetitions of 5-second maximal voluntary isometric contractions (MVIC) that was used to measure muscle activity of the following lower extremity muscles: gluteus maximus (GM), vastus medialis (VMO), semitendinosus (H), tibialis anterior (TA), and medial gastrocnemius (MG) of the stride leg used during their swing trials. Participants were asked to maximally extend their hips while keeping the knee extended to obtain the MVIC of the GM. Participants were then asked to sit and forcefully extend their stride leg into a pad to obtain the VMO MVIC. Following MVIC of the VMO, participants flexed maximally into the same pad to obtain MVIC’s of the H. In order to obtain the MVIC of the TA, participants secured their stride foot in a strap and was asked to maximally dorsiflex. From there, participants were asked to maximally plantar flex into the ground to obtain the MVIC for the MG.
A counterbalanced design was implemented to determine the tee position and height for every swing trial for each participant. To ensure the strike zone was relative to each participant, the bottom of the strike zone was defined as the area just above the knee when each participant set up in their respective stance. The top of each participant’s strike zone was defined as 6 inches above each participant’s belt line to represent the bottom of the jersey number [22].The middle of their strike zone was the middle distance between the top and bottom of each participant’s strike zone. For tee positions located at the bottom and top of their respective strike zone, we asked each participant whether or not they would swing at a ball pitched into this specific location with two strikes against them in a game situation to confirm an appropriate tee location for each participant (Figure 2). The strike zone also covers the entire width of home plate, the tee was placed in different regions of home plate to mimic the bat placement of an inside, middle, or outside pitch in a practice or game situation (Figure 3). The locations for tee placement over the width of the strike zone were based on how the sport coach taught the athletes to swing based on a given pitch. The following nine locations of the strike zone are as follows: inside high (IH), inside center (IC), inside low (IL), middle high (MH), middle center (MC), middle low (ML), outside high (OH), outside center (OC), and outside low (OL) [12].
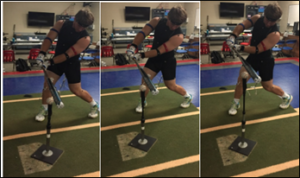 Figure 2: Individual swing trial at various tee heights mimicking swing trials completed in the middle zone at varying locations: middle low, middle center, middle high.

Figure 3: Tee position for inside, middle, and outside zone and swing location for a right-handed batter.
Once the strike zone was determined, each participant completed a two-minute on-deck warm-up mimicking what each participant would do prior to an at bat situation [12, 13]. Upon completion of their warm-up, participants were given a short rest period to allow investigators time to set up the tee and to allow the participant to get in their respective batting stance for the first swing trial. Each participant was asked to step into the batter’s box as they would in a game situation and to not adjust to where the tee was located over home plate. Participants were asked to maximally swing the bat to hit a line-drive through the 2nd baseline line to establish consistency with each swing trial in terms of bat path. After each swing trial, a period of 20 seconds elapsed to mimic the period between each pitch and to also allow the investigators to move the tee to another position within their strike zone. Each participant completed 15 swing attempts followed by a ten-minute rest period for a total of 45 swing trials (5 swings for each of the nine locations of their strike zone) [12].
Data Analysis
In order to delineate the phases of the swing for EMG processing, previous work by Shaffer et al. [15] and Escamilla et al. [2] was used to break each swing trial into three distinct phases over four specific events for each trial. Event one of the swing began when each participant’s stride (lead) foot left the ground which started the stride phase of the swing. The stride phase of the swing ended when the lead foot reestablished contact with the ground and started the 2nd event of the swing. The transition phase began when the lead foot reestablishes ground contact through the point the bat is perpendicular with the ground [2, 15]. The swing phase started at the 3rd event when the bat is perpendicular to the ground and ended when the bat made contact with the ball [2, 15]. Contact with the ball was defined as the frame when deformation of the tee occurred [12, 13].
Raw EMG was collected at 1,000Hz for all MVIC and swing trials for this investigation. Once this data was gathered, a fourth order butter worth filter was used to smooth the data in addition to also having the data rectified prior to statistical analysis. Mean muscle activity was calculated on each muscle of interest over the three phases of the swing. Mean muscle activity was also calculated over for each phase of the swing within each location of the strike zone. Muscle activity was averaged across the top three swing trials in each strike zone location per each phase of the swing.
Statistical Analysis
The EMG measures of interest were analyzed using a series of 1 x 9 [(1 Muscle: GM, VMO, MH, TA, MG) x (9 Strike Zone Locations: IH, IC, IL, MH, MC, ML, OH, OC, OL)] within subject’s factor repeated measures ANOVA independently for each phase of the swing (Stride, Transition, Swing). An additional 1 x 3 (1 Muscle: GM or VMO, MH, TA, MG) x (3 Tee Placement across home plate: Inside, Middle, Outside) within subject’s factor repeated measures ANOVA was also conducted on the aforementioned variables of interest to examine possible differences across various tee placements over the strike zone independent of each phase of the swing. A 1×3 [(1 Muscle: GM or VMO or MH or TA or MG) x (3 Tee Height: High Center, Low)]within subject’s factor repeated measures ANOVA was also conducted on the aforementioned variables of interest to examine possible differences in EMG measures of interest across various tee heights, independent of swing phases. Finally, a 1×3 [(1 Muscle: GM, VMO, MH, TA, MG) x (3 Phases: Stride, Transition, Swing)] within subjects repeated measures ANOVA was also analyzed to examine differences in EMG over the distinct phases within the swing. If sphericity was violated, a Greenhouse Geisser correction was used when needed. If significant main effect differences were found, post hoc pair wise comparisons using Fishers least significant difference (LSD) were performed. F statistics and partial eta squared (η2) effect sizes are reported. Significance for all analyses was set at an alpha level of p <0.05 using SPSS 25 statistical software package (IBM SPSS Statistics for Windows, Version 25.0. Armonk, NY, USA).
Results
The repeated measures ANOVA revealed significant main effect differences among the phases of the swing for both percent activation and mean muscle activity within the stride leg (Figure 4& Table 1). A main effect difference was seen in the VMO across the phases of the swing in percent activation (F (2, 11) =10.46, p=0.003, η2=.655 with the greatest activation seen in the transition phase (25.6±5.2%) in comparison to the stride phase (4.1±.46%) (p<0.001). Results of this study indicated a significant main effect difference for percent activation of MH across the phases of the swing (F (1.3, 11) =20.96, p<0.001, η2=.64 with the greatest percent activation occurring in the swing phase (160.3±21.9%) in comparison to the stride phase (45.9±14.3%) (p<0.001). Significant main effect differences were also seen in both the MG (F (1.3,11) =4.89, p<0.032, η2=.29 and TA (F (1.27,11) = 20.84, p<0.001, η2=.64 across the phases swing with the greatest percent change for the MG and TA occurring in swing phase (164.3±63.6%)/(20.32±4.2%) compared to the stride phase (18.04±4.3%)/(7.04±1.6%) respectively (p<0.05). Significant main effect differences were not observed when examining percent activation changes within the nine locations of the strike zone independent of each phase of the swing (p>0.05).

(*) Significant difference from stride phase (p<0.05)
(†) Significant difference from transition phase (p<0.05)
Figure 4: Percent Activation of stride leg musculature over the various phases of the swing.
Results of this study also revealed significant main effect differences in mean muscle activity across the phases of the swing. Significant main effect differences were seen in the GM (F (2,11)=20.190, p<0.001, η2=.79, H (F (2,11)=17.30, p<0.001,η2=.76, VMO (F (2,11) =17.15, p<0.001, η2=.76, MG (F (2,11) =10.33, p=0.003, η2=.65, and TA (F (2,11) =11, p<0.001, η2=.91 across the three phases of the swing. Post-hoc differences in mean muscle activity across swing phases can be seen in Table 1. Significant main effect differences were not observed when examining mean muscle activity within the nine locations of the strike zone independent of each phase of the swing (p>0.05) (Table 1). Muscle (*) Significant difference from stride phase (p<0.05) (†) Significant difference from transition phase (p<0.05)
Stride Phase
Transition Phase
Swing Phase
Mean ± SE
95% CI
Mean ± SE
95% CI
Mean ± SE
95% CI
Gluteus Maximus
0.10
0.01
0.07
0.14
0.33
0.06*
0.21
0.46
0.31
0.05*
0.20
0.41
Quadriceps
0.10
0.01
0.08
0.12
0.65
0.10*
0.44
0.86
0.47
0.08*
0.29
0.64
Hamstrings
0.18
0.06
0.05
0.31
0.28
0.07*
0.13
0.43
0.62
0.07*†
0.48
0.77
Gastrocnemius
0.13
0.02
0.08
0.18
0.50
0.11*
0.25
0.75
0.75
0.13*
0.47
1.03
Tibialis Anterior
0.15
0.01
0.13
0.18
0.33
0.03*
0.27
0.39
0.49
0.03*†
0.43
0.55
Table 1: Mean Muscle Activity (mV) of Stride Leg Musculature.
Results of these analyses also revealed significant main effect differences for tee placement and tee height independent of each phase of the swing for percent activation. A significant main effect difference was seen during the transition phase of the H between the three tee placements (inside, middle, outside) (F (2, 11) =5.07, p=0.027, η2=.48 with the greatest percent activation occurring in swing trials placed in the middle of home plate (75.31±19%) in comparison to the inside tee placement (59.90±17.3%) (p<0.05). There was a significant main effect difference seen in tee height (high, middle, low) percent activation of the GM seen in the transition phase of the swing (F (2, 11) =5.82, p=0.019, η2=.514 with a greater percent activation occurring when the tee was placed at the bottom (low) (63.65±26.14%) in comparison to swing trials at the top (high) of their strike zone (58.3±24.8%) (p<0.01). A significant main effect was observed in the TA during the swing phase across various tee heights (F (1.31, 15.74) =8.31, p=0.007, η2=.41with the greatest activation difference occurring in swing trials completed at the top of their strike zone (high: 18.86±4.02%) in comparison to trials completed at the bottom (low) of the strike zone (22.80±4.79%) (p<0.01) (Table 2, 3). 4.5 (*) Significant difference from inside tee placement (p<0.05)
Phase of Swing: Stride
Tee Placement: Inside
Tee Placement: Middle
Tee Placement: Outside
Muscle
Mean ± SE
95% CI
Mean ± SE
95% CI
Mean ± SE
95% CI
Gluteus Maximus
18.7
8.3
0.39
36.3
20.5
9
0.86
40.1
19.1
8.6
0.34
37.8
Quadriceps
4
0.51
2.9
5.1
4.2
0.52
3.1
5.4
4
0.47
3
5
Hamstrings
43.2
13.2
14.4
72
45.3
13.9
15.1
75.5
49.2
15.8
14.7
83.7
Gastrocnemius
17.9
4.6
7.9
27.8
18.1
8.4
27.8
18.2
4.2
9.1
27.3
Tibialis Anterior
6.4
1.5
3.2
9.7
7.1
1.8
3.1
11
7.6
1.8
3.7
11.5
Phase of Swing: Transition
Tee Placement: Inside
Tee Placement: Middle
Tee Placement: Outside
Muscle
Mean ± SE
95% CI
Mean ± SE
95% CI
Mean ± SE
95% CI
Gluteus Maximus
57.1
22.4
8.2
106
60.8
27.2
1.5
120
64.7
27.1
5.8
124
Quadriceps
25.9
4.8
14.7
35.5
26.5
5.9
13.6
39.4
25.1
5.1
14
36.3
Hamstrings
59.9
17.3
22.3
97.5
75.3*
19
33.8
117
69.8
17.7
31.2
108
Gastrocnemius
91.2
34.1
16.9
166
114
45.3
15.4
213
95.6
32.1
25.6
166
Tibialis Anterior
15
3.9
6.5
23.6
14.6
3.3
7.5
21.8
15.9
4
7.1
24.6
Phase of Swing: Swing
Tee Placement: Inside
Tee Placement: Middle
Tee Placement: Outside
Muscle
Mean ± SE
95% CI
Mean ± SE
95% CI
Mean ± SE
95% CI
Gluteus Maximus
50.8
23.5
-0.5
102
46.5
21.4
-0
93.1
54.1
24.3
1.2
107
Quadriceps
21.4
3.9
12.7
30.1
18.1
3.2
11
25.1
21.7
3.9
13.2
30.1
Hamstrings
158
21.7
111
205
161
22.6
112
211
161
22.8
112
211
Gastrocnemius
164
61.7
29.2
298
173
69.4
22.3
325
156
60.4
24.6
288
Tibialis Anterior
19.6
4.2
10.5
28.7
20
4
11.2
28.7
21.4
4.5
11.6
31.2
Table 2: Percent Activation of MVIC based on Tee Placement.
Phase of Swing: Stride
Muscle
Tee Height: High
Tee Height: Middle
Tee Height: Low
Mean ± SE
95% CI
Mean ± SE
95% CI
Mean ± SE
95% CI
Gluteus Maximus
18.4
8.5
-0.2
37
20.2
8.3
2.2
38.2
19.3
9.1
-0.5
39.1
Quadriceps
4
0.47
3
5
4
0.5
2.9
5.1
4.2
0.51
3.1
5.3
Hamstrings
46.8
16.5
10.8
82.7
40.6
9.9
19
62.3
50.3
16.7
13.9
86.7
Gastrocnemius
18.5
4.5
8.7
28.4
17.9
4.3
8.5
27.1
17.8
4.3
8.4
27.1
Tibialis Anterior
7.2
1.7
3.5
10.9
7
1.8
3.1
11
6.9
1.6
3.4
10.4
Phase of Swing: Transition
Muscle
Tee Height: High
Tee Height: Middle
Tee Height: Low
Mean ± SE
95% CI
Mean ± SE
95% CI
Mean ± SE
95% CI
Gluteus Maximus
58.3
24.8
4.3
112
60.7
25.5
5.2
116
63.7
26.1*
6.7
121
Quadriceps
23.9
4.4
14.3
33.5
26.8
5.3
15.2
38.4
26
6.1
12.7
39.4
Hamstrings
60.3
16.8
23.7
96.9
64.1
15.3
30.7
97.5
80.5
21.8
33
128
Gastrocnemius
86.6
31.3
18.4
155
100
36.4
20.9
179
114
45
16.1
212
Tibialis Anterior
14.7
3.8
6.4
23.1
15.2
3.6
7.3
23.1
15.6
3.8
7.3
23.9
Phase of Swing: Swing
Muscle
Tee Height: High
Tee Height: Middle
Tee Height: Low
Mean ± SE
95% CI
Mean ± SE
95% CI
Mean ± SE
95% CI
Gluteus Maximus
45.4
21.2
-0.4
91.2
50.3
22.8
0.56
100
55.7
25.2
0.73
111
Quadriceps
18.3
3.3
11
25.5
19.3
3.7
11.2
27.4
18.9
4.4
11.5
26.4
Hamstrings
157
22.3
108
205
153
20.4
109
198
171
25
117
226
Gastrocnemius
166
63
28.3
303
165
65.6
22
308
163
63
25.3
300
Tibialis Anterior
18.9
4
10.1
27.6
19.3
3.8
11
27.6
22.8
4.8*
12.4
32.2
(*) Significant difference from high tee placement (p<0.05)
Table 3: Percent Activation of MVIC based on Tee Height.
Significant main effect differences in tee placement were also seen in mean muscle activity of stride leg musculature of the H in the stride (F (1.18, 14.22) =5.02, p=0.036, η2=.3 and transition (F (2, 11) =6.10, p=0.016, η2=.53 phases of the swing. Mean muscle activity significant effect differences in tee placement were also seen in transition phase of the MG (F (2,11) =6.37, p=0.015, η2=.54 and the swing phase of the VMO (F (2,11) =9.21, p=0.004, η2=.63(Table 4). Significant main effect differences in tee height were also observed in the transition phase of the GM (F (1.22, 14.67)=14.17, p=0.001, η2=.54 and swing phase of the TA (F (2,11)=4.36, p=0.04, η2=.442 (Table 4, 5). Muscle Muscle Muscle
Phase of Swing: Stride
Tee Placement: Inside
Tee Placement: Middle
Tee Placement: Outside
Mean ± SE
95% CI
Mean ± SE
95% CI
Mean ± SE
95% CI
Gluteus Maximus
0.097
0.014
0.067
0.127
0.111
0.021
0.066
0.155
0.105
0.015
0.071
0.139
Quadriceps
0.097
0.008
0.079
0.115
0.108
0.013
0.079
0.137
0.100
0.006
0.086
0.114
Hamstrings
0.165
0.055
0.045
0.284
0.171
0.058
0.045
0.298
0.203
0.067*
0.057
0.349
Gastrocnemius
0.090
0.009
0.071
0.108
0.093
0.007
0.076
0.109
0.203
0.067
0.057
0.350
Tibialis Anterior
0.14
0.01
0.122
0.163
0.151
0.012
0.124
0.178
0.171
0.018
0.132
0.209
Phase of Swing: Transition
Tee Placement: Inside
Tee Placement: Middle
Tee Placement: Outside
Mean ± SE
95% CI
Mean ± SE
95% CI
Mean ± SE
95% CI
Gluteus Maximus
0.324
0.058
0.197
0.451
0.325
0.056
0.204
0.446
0.350
0.058
0.225
0.476
Quadriceps
0.640
0.088
0.449
0.832
0.673
0.107
0.440
0.906
0.648
0.097
0.437
0.859
Hamstrings
0.253
0.070
0.101
0.404
0.300
0.06*
0.150
0.450
0.285
0.067
0.140
0.430
Gastrocnemius
0.448
0.110
0.208
0.688
0.535
0.13*
0.261
0.808
0.516
0.108*
0.280
0.752
Tibialis Anterior
0.323
0.03
0.257
0.388
0.331
0.028
0.271
0.391
0.344
0.028
0.284
0.404
Phase of Swing: Swing
Tee Placement: Inside
Tee Placement: Middle
Tee Placement: Outside
Mean ± SE
95% CI
Mean ± SE
95% CI
Mean ± SE
95% CI
Gluteus Maximus
0.299
0.047
0.195
0.402
0.291
0.048
0.187
0.396
0.325
0.059
0.197
0.454
Quadriceps
0.524
0.084
0.342
0.707
0.458
0.08*
0.283
0.633
0.416
0.08*
0.241
0.590
Hamstrings
0.605
0.055
0.484
0.725
0.634
0.073
0.475
0.792
0.633
0.077
0.465
0.800
Gastrocnemius
0.750
0.124
0.480
1.020
0.762
0.136
0.465
1.059
0.730
0.131
0.445
1.016
Tibialis Anterior
0.496
0.037
0.413
0.574
0.465
0.049
0.359
0.571
0.509
0.036
0.430
0.588
(*) Significant difference from inside tee placement (p<0.05)
Table 4: Mean Muscle Activity (mV) based on Tee Placement.
0.156 Muscle Muscle (*) Significant difference from high tee placement (p<0.05)
Phase of Swing: Stride
Muscle
Tee Height: High
Tee Height: Middle
Tee Height: Low
Mean ± SE
95% CI
Mean ± SE
95% CI
Mean ± SE
95% CI
Gluteus Maximus
0.097
0.015
0.064
0.130
0.113
0.019
0.071
0.155
0.102
0.015
0.069
0.136
Quadriceps
0.100
0.008
0.083
0.117
0.099
0.009
0.080
0.119
0.106
0.013
0.079
0.133
Hamstrings
0.182
0.070
0.030
0.334
0.166
0.041
0.076
0.256
0.191
0.070
0.038
0.344
Gastrocnemius
0.127
0.027
0.069
0.185
0.123
0.015
0.089
0.136
0.030
0.070
0.201
Tibialis Anterior
0.147
0.010
0.125
0.169
0.165
0.018
0.126
0.204
0.152
0.011
0.128
0.176
Phase of Swing: Transition
Tee Height: High
Tee Height: Middle
Tee Height: Low
Mean ± SE
95% CI
Mean ± SE
95% CI
Mean ± SE
95% CI
Gluteus Maximus
0.312
0.056
0.190
0.434
0.334
0.056
0.212
0.457
0.353
0.057
0.228
0.478
Quadriceps
0.615
0.085
0.430
0.799
0.685
0.098
0.471
0.899
0.661
0.109
0.424
0.898
Hamstrings
0.249
0.062
0.113
0.385
0.262
0.058
0.137
0.388
0.326
0.085
0.141
0.512
Gastrocnemius
0.447
0.120
0.186
0.708
0.498
0.104
0.271
0.725
0.554
0.121
0.289
0.818
Tibialis Anterior
0.316
0.025
0.260
0.371
0.337
0.030
0.272
0.402
0.345
0.030
0.280
0.410
Phase of Swing: Swing
Tee Height: High
Tee Height: Middle
Tee Height: Low
Mean ± SE
95% CI
Mean ± SE
95% CI
Mean ± SE
95% CI
Gluteus Maximus
0.287
0.048
0.184
0.391
0.303
0.051*
0.192
0.415
0.325
0.054
0.208
0.442
Quadriceps
0.451
0.075
0.287
0.616
0.479
0.084
0.296
0.662
0.468
0.087
0.278
0.657
Hamstrings
0.615
0.072
0.459
0.771
0.602
0.063
0.465
0.739
0.654
0.072
0.498
0.810
Gastrocnemius
0.742
0.135
0.449
1.035
0.755
0.128
0.475
1.034
0.745
0.129
0.465
1.026
Tibialis Anterior
0.448
0.035
0.372
0.524
0.491
0.035
0.415
0.567
0.528
0.031*
0.460
0.596
Table 5: Mean Muscle Activity (mV) based on Tee Height.
Discussion
We aimed to investigate possible differences in percent activation and mean muscle activity of the stride leg throughout the various locations of an individual’s strike zone in collegiate baseball players. The secondary aim of this study was to examine these changes in stride leg EMG in respect to the distinct phases of a baseball swing. Our study shows significant increases in percent activation of the VMO, MG, and TA when athletes move from the stride phase of the swing to the transition phase of the swing (p<0.05). Percent activation was also significantly higher in the swing phase in comparison to the stride phase in the VMO, H, MG, and TA (p<0.05) (Figure 4).
Our results are comparable to Nakata et al. (2013) [16] found when they examined changes in lower limb electromyography between skilled and unskilled baseball players. Investigators found the greatest percent activation based on percentage of MVIC for skilled players was at ball impact of the stride leg musculature of the rectus femoris at (RF) 174±19%, biceps femoris (BF) 153±29%, TA79±7%, and MG159±36% [16]. The same can be said for our study for the H 160.3±21.9% and MG 164.3±63.6% reached the highest percent activation during the swing phase where contact of the ball occurred. The BF percent activation at ball contact 153±29% from Nakata’s work [16] and the semitendinosus H percent activation 160.3±21.9% during the swing phase to ball contact from our study are comparable, showing the importance of these knee flexors aiding these athlete’s ability to square their hips in preparation for bat-ball contact.
A study completed Ohta and Nakamoto 2015 [17] does not align with the results of our study. Investigators of this study wanted to examine differences in ground reaction forces and muscle activation characteristics of the stride leg vastus lateralis (VL), BF, and MG based on different bat grips in nine collegiate baseball players [18].Each participant swung a bat at a moving target to simulate a ball being thrown towards home plate. The swing time was defined as the time to peak ground reaction force to impact [19, 24]. Results of this study showed the average percent activation of the stride leg during swing time of the VL close to 80% of MVIC, 40% of the BF, 80% of the MG, and 60% for the TA of their swing trials [18].The percent activation during the swing phase in our study was 160.3±21.9% for the H, 164.3±63.6% for MG, 20.39±3.6% for the VMO, and 20.33±4.1% for the TA. We chose to examine changes in electrical activity of both the vastus medialis and semitendinosus for their role in extending and flexing the knee respectively. The percent activation of the semitendinosus H in our study was higher during the swing phase in comparison to the values of the BF. On the other hand, the VL percent activation (80%) during the swing phase of Ohta and Nakamoto’s 2015 investigation was much higher than VMO percent activation 20.33±4.1% of the current study potentially suggesting a greater contribution of the VL over the VMO during the swing phase. Part of the discrepancy in these values could be attributed to how each athlete was asked to complete each swing trial. Participants for the current study completed each swing trial by contacting a ball placed on a tee in varying locations of the strike zone that did not take into account reaction time for each swing trial. Participants that completed Ohta and Nakamoto’s 2015 protocol initiated the swing with a batting simulator with a photoelectric tube system with a target running down a track and ending in the middle of home plate. This was designed to consider the reaction time of a batter before engaging in the swing [18].
To date, this is the first study that has examined both percent activation and mean muscle activity in the stride leg in collegiate baseball players across an individual’s strike zone regarding location, tee placement and tee height. Our study did not find any significant changes in percent activation or mean muscle activity of stride leg musculature in relation to the nine locations of the strike zone independent of the phases of the swing (stride, transition, swing) (p>0.05). Our findings are important in showing the location of the ball does not change lower EMG measures of interest. These changes are coming from the upper body to make the appropriate adjustment to the bat ball contact which can be used as a teaching tool for sport coaches to implement with their athletes. These high-level baseball athletes also have copious amount of time allotted by the NCAA for these individuals to practice these swings through common batting techniques implemented by a sport coach [22]. This time allows athletes to establish consistency in motor coordination of the task of swinging a bat with slight variation as to the location of the ball placed within their strike zone.
Since we did not have any significant differences in percent activation or mean muscle activity independent of each phase of the swing over the nine locations of the strike zone, a question was raised regarding possible differences in these variables based on tee placement and height within an individual’s strike zone by collapsing the nine locations into three different placements (inside, middle, outside) across the strike zone and at various tee heights (high, middle, low).Our study did find significant main effect differences in percent activation and mean muscle activity for both tee placement and tee height in different phases of the swing (p<0.05). During the transition phase of the swing, the H had a greater percent activation in swing trials completed in the middle of an individual’s strike zone (75.31±19%) in comparison to inside tee placement swing trials (59.90±17.3%) (p<0.05). Regarding tee height, greater percent activation was seen in the transition phase of the GM in swing trials completed at the bottom of one’s strike zone (63.65±26.14%) in comparison to the top (high)(58.3±24.8%) (p<0.01). Part of what could explain this is an increase in external rotation of the lead hip in trials completed in the bottom of the strike zone in comparison to trials completed towards the top of the zone. The TA percent activation during the swing phase also yielded similar results as the greatest activation occurred in swing trials completed during the bottom of the strike zone (low: 22.80±4.79%) in comparison to the top of the strike zone (high: 18.86±4.02%) (p<0.01). The difference in the values of the TA could be explained by the TA shortening to a greater extent in swing trials completed lower to the ground in comparison to swing trials placed higher within their strike zone. The results of our study are hard to compare based on the novelty of our study regarding percent activation and mean muscle activity across strike zone location, tee placement, and tee height over the various phases of a baseball swing.
A current limitation of the current study was we could not truly replicate how collegiate baseball players swing during a “game situation”. However, the use of the tee is a common practice in both training and preparation for on-field performance. In a game situation, a batter has 200 to 300 milliseconds to determine whether or not they will initiate the swing in an attempt to make ball contact [16, 17]. Future research could examine a participant’s swing among varying levels of skill examining comparisons in high school, collegiate, and professional athletes.
Conclusion
This study examined changes in stride leg electromyography as it relates to various of locations within an individual’s strike zone along with breaking down these changes in respect to the baseball swing itself. The present study confirms baseball players swinging a bat at the collegiate level is a complex, sequential motion with the aim of maximizing bat velocity at ball contact. Athletes and sport coaches can use this information to identify areas of strength and deficiency within a given phase of the swing or location within their strike zone to better allocate their time in batting practice.
Our data suggests a greater percent activation and mean muscle activity in stride leg musculature during the transition and swing phases of the swing. Common practices for some strength and conditioning coaches is incorporating progressive exercises similar to the actions of what an athlete would perform on the field of play such as torso/ rotational exercises with a medicine ball. This information can provide insight to strength and conditioning professionals to focus on rotational exercises within these distinct phases such as the transition and swing phase with the goal of maximizing bat velocity. The need to also focus on strengthening musculature within the lower extremity has been shown to increase bat velocity when performing exercises both bilaterally and unilaterally [16, 25, 26]. Another facet of strength and conditioning is understanding mechanisms of injury as it relates to a given sport. Injury as it relates to position players occurs at a greater rate in the lower extremity in comparison to upper extremity injuries [27].Strength and conditioning programs may provide a way to limit the rate at which these injuries occur and to provide a stable platform for these athletes to swing effectively during an at bat situation.
Laboratory Involved: The Applied Biomechanics Laboratory, Dept. of Health, Exercise Science, and Recreation Management, 215 Turner Center, P.O. Box 1848, University, Mississippi 38677, USA
Acknowledgements: Everyone who contributed towards this manuscript would like to thank all of the coaches and players who allocated time to participate in our study.
References
- Association NCA (2021) Baseball: Probability of competing beyond high school | NCAA.org – The Official Site of the NCAA. 2015 2015-03-06T10:11-05:00 [cited 2021 1/29/21].
- Escamilla RF, Fleisig GS, DeRenne C, Taylor MK, Moorman 3rd CT, et al. (2009) A comparison of age level on baseball hitting kinematics. Journal of applied biomechanics 25: 210-218.
- Escamilla RF, Fleisig GS, DeRenne C, Taylore MK, Imamura R, et al. (2009) Effects of bat grip on baseball hitting kinematics. Journal of applied biomechanics 25: 203-209.
- Katsumata H (2007) A functional modulation for timing a movement: A coordinative structure in baseball hitting. Human movement science 26: 27-47.
- Messier SP, Owen MG (1985) Ground reaction forces and selected lower extremity kinematics during batting. Medicine & Science in Sports & Exercise 17: 221-222.
- Messier SP, Owen MG (1984) Bat dynamics of female fast pitch softball batters. Research Quarterly for Exercise and Sport 55: 141-145.
- Milanovich M, Nesbit SM (2014) A three-dimensional kinematic and kinetic study of the college-level female softball swing. Journal of sports science & medicine 13: 180-191.
- Nathan AM (2000) Dynamics of the baseball-bat collision. American Journal of Physics 68: 979-990.
- Nicholls RL, Elliott BC, Miller K, Koh M (2003) Bat kinematics in baseball: implications for ball exit velocity and player safety. Journal of Applied Biomechanics 19: 283-294.
- Race DE (1961) A cinematographic and mechanical analysis of the external movements involved in hitting a baseball effectively. Research Quarterly. American Association for Health, Physical Education and Recreation 32: 394-404.
- Welch CM, Banks SA, Cook FF, Draovitch P (1995) Hitting a baseball: A biomechanical description. Journal of Orthopaedic & Sports Physical Therapy 22: 193-201.
- Williams CC, Donahue PT, Wilson SJ, Mouser JG, Hill CM, et al. (2020) Examining Changes in Bat Swing Kinematics in Different Areas of the Strike Zone in Collegiate Baseball Players. International Journal of Kinesiology and Sport Science 8: 1-6.
- Williams CC, Gdovin JR, Wilson SJ, Cazas-Moreno VL, Eason JD, et al., (2019) The Effects of Various Weighted Implements on Baseball Swing Kinematics in Collegiate Baseball Players. The Journal of Strength & Conditioning Research 33: 1347-1353.
- Mcintyre DR, Pfautsch EW (1982) A kinematic analysis of the baseball batting swings involved in opposite-field and same-field hitting. Research quarterly for exercise and sport 53: 206-213.
- Shaffer B, Jobe FW, Pink M, Perry J (1993) Baseball batting. An electromyographic study. Clinical orthopaedics and related research 292: p. 285-293.
- Nakata H, Miura A, Yoshie M, Kanosue K, Kudo K (2013) Electromyographic Analysis of Lower Limbs During Baseball Batting. The Journal of Strength & Conditioning Research 27: 1179-1187.
- Nakata H, Miura A, Yoshie M, Kanosue K, Kudo K (2012) Electromyographic Activity of Lower Limbs to Stop Baseball Batting. The Journal of Strength & Conditioning Research 26: 1461-1468.
- Ohta Y, Nakamoto H (2015) Effects of Changes in Bat Grip Position on Baseball Bat Swing Timing, Ground Reaction Force, and Muscle Activation Characteristics. International Journal of Sport and Health Science 13: 84-95.
- Ohta Y, Nakamoto H, Ishii Y, Ikudome S, Takahashi K, Simha N (2015) Muscle Activation Characteristics of the Front Leg During Baseball Swings with Timing Correction for Sudden Velocity Decrease. PLOS ONE 10: 0124113.
- Association, N.C.A 2021 and 2022 NCAA Baseball Rules, ed. R. Bruns. 2021, Indianapolis, Indiana: The National Collegiate Athletic Association. 130.
- Fleisig GS, Zheng N, Stodden DF, Andrews RJ (2002) Relationship between bat mass properties and bat velocity. Sports Engineering 5: p. 1-8.
- Paronto J (2014) NCAA Baseball: 2015 and 2016 Rules. The National Collegiate Athletic Association, Indianapolis, IN.
- Perotto AO (2011) Anatomical guide for the electromyographer: the limbs and trunk. 2011: Charles C Thomas Publisher.
- Kawabata K, Ito A (2012) Effects of grip position and pitching speed on baseball bat swing. Taiikugaku kenkyu (Japan Journal of Physical Education, Health and Sport Sciences) 57: p. 557.
- Szymanski DJ, Szymanski JM, Bradford TJ, Schade LR, Pascoe DD (2007) Effect of twelve weeks of medicine ball training on high school baseball players. Journal of Strength and Conditioning Research 21: p. 894.
- Schwendel PJ (1991) Traditional baseball weight training versus power weight training.
- Posner M, Cameron KL, Wolf JM, Belmont PJ Jr, Owens BD (2011) Epidemiology of Major League Baseball Injuries. The American Journal of Sports Medicine 39: 1675-1691.
