Publication Information
Frequency: Continuous
Format: PDF and HTML
Versions: Online (Open Access)
Year first Published: 2019
Language: English
| Journal Menu |
| Editorial Board |
| Reviewer Board |
| Articles |
| Open Access |
| Special Issue Proposals |
| Guidelines for Authors |
| Guidelines for Editors |
| Guidelines for Reviewers |
| Membership |
| Fee and Guidelines |
 |
Effect of four formulations of Keyplex KP 120 on production, fruit quality and incidence of Crini and Tospovirus in harper melon, Capaz hybrid in Agroindustrial Los Prados, Bonilla farm, San Jerónimo, Choluteca, Honduras.
Mariana Lorena Lastres*
M.Sc., Colprocah Collegiate No.5378.
Received Date: June 29, 2021; Accepted Date: July 12, 2021; Published Date: July 20, 2021;
*Corresponding author: Mariana Lorena Lastres, M.Sc., Colprocah Collegiate No. 5378. Email: lorenalastres@yahoo.es
Citation: Lastres M L (2021) Effect of four formulations of Keyplex KP 120 on production, fruit quality and incidence of Crini and Tospovirus in harper melon, Capaz hybrid in Agroindustrial Los Prados, Bonilla farm, San Jerónimo, Choluteca, Honduras. Adv Agri Horti and Ento: AAHE-155.
DOI: 10.37722/AAHAE.202053
This trial was performed at Bonilla Farm, plot 4, owned by Agroindustrial Los Prados, in San Jerónimo village, Namasigüe, Choluteca, southern Honduras, from late March to mid-May 2021. Harper melon, Capaz hybrid, by Enza Zaden, was transplanted on March 17 and covered with agribon or thermal cloth. Right in front of this planting area was a plot of Harper Melon being harvested with lots of weeds and a huge population of whiteflies constantly moving from that plot and also from abandoned watermelon plots located upwind, in East direction.
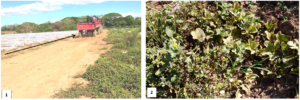
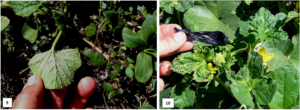
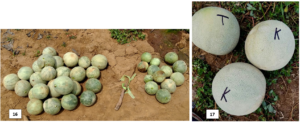
Figures 1 and 2. Aspect of the trial plot surroundings, with an old crop in harvest period on the front edge, the arrow shows the edge used for replica setting; and detail of the old harvested melon crop affected by Crinivirus and with abundant weed Portulaca oleracea as a source of thrips and Tospovirus for the trial plot.
The predominant weeds found in the fields were Portulaca oleracea, Family Portulacacea, Boerhavia erecta, Family Nyctaginacea, Cleome viscosa, Family Capparidacea, all of them good hosts for thrips and Tospoviruses in southern Honduras. There are currently one or more Tospovirus affecting cucurbits in the named region. In addition, some Euphorbiaceae such as Euphorbia hirta and E. graminea, as well as, volunteer melon from previous plantings were abundant and all of them very good hosts for whitefly, Bemisia tabaci, the vector of Crinivirus, Fam. Closteroviridae. This virus is composed of RNA and affects cucurbits exclusively. In melons it causes yellowing of mature leaves and a considerable drop in the brix (sugar contents) of fruits of infected plants. Reduction of fruit size by Crinivirus is also reported.
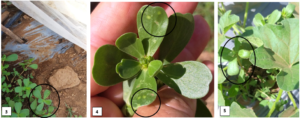
Figures 3, 4 and 5: Tospovirus infected Portulaca oleracea next to crops covered with agribon; symptoms of Tospovirus in Portulaca oleracea, one of the most common weeds in and around the crop; and Portulaca oleracea with symptoms of curly leaves next to a melon plant.
The present trial was performed in plot 4 of Finca Bonilla. The newly transplanted crop had the highest probability of losses due to viruses because of: 1) its high vector population, 2) the high incidence of Crinivirus in old crops surrounding the trial plot, 3) the presence of Tospovirus in the adjacent old crop and the presence of weeds in and around the crop, and 4) the use of old and torn agribon. The decision to place all the treatments´replicas exclusively on the front edge of the field was made because the wind hit that front after passing through the old, weedy and full of vectors crop, which was separated from the trial plot by a road for vehicle transportation which was about 6 to 7 meters wide only. These conditions promoted the highest virus infection possibility and reduced the variability of infection between replicas of all treatments. The trial treatments were 5: the commercial control of Agroindustrial Los Prados company, and 4 KP 120 treatments: KP 120 V3 (White), KP 120 Original (Red), KP 120 V2 (Green) and KP 120 V1 (Gray). All treatments had the same nutritional, irrigation, and pest and disease management as the control treatment. The difference between KP 120 treatments was the formulation used (there were 4 different treatments: Original, V1, V2 and V3), and the difference between Keyplex treatments and the control treatment were the resistance promoters, which the KP 120 products contained. The hypothesis for this trial is that the Keyplex treatments, with their resistance promoters, would help prevent virus infection and consequently allow for higher yields and quality melons in treated plants.
 Figures 6, 7 and 8: Lifting of agribon for the first application made using the drench method (initially few weeds were observed), lifting of agribon for the 2nd application that was made by the foliar method and more weeds between beds were observed; poor dispersion of the foliar application in the upper part of the leaves due to lack of adherent products.
All replicas were 4 beds wide and 10 meters long. Replicas were sorted out making groups of 5 plots identified with little pieces of paper marked with the colors of the treatments. In addition, to make the distribution even more equitable, after the initial array the treatments were redistributed, if necessary, to ensure that all of them had 2 replicas with “moto (odd) furrow”. The “moto furrow” is the seedbed located between the path of the two tires of the tractor that does cultivation and mechanization in the crop. Due to the friction of the machinery and the compaction by the passage of the tractor, this furrow is always less productive than a normal furrow, thus being able to add variability to the samplings and interfere with production results if this particular detail is not taken into account.
The starting portion of plot 4, by the entrance of the main street of the farm, had no vegetation at the time of the trial setup, and therefore a lower incidence of vectors and virus condition was expected in the plants located in that area portion. For that reason, that section of the plot was the one that defined the number of beds that each replicate would have. Leaving one bed before the beginning of the first marked plot, gave exactly 5 plots of 4 beds each, just the necessary number to put a replica of each treatment in that sector without frontal vegetation. The other 3 replicas, of 5 plots each, all had vegetation (old melon crop in harvest) in front. The treatment that during the aleatory array turned out to be the first of the first replica was the White treatment, and in that particular replica, this treatment tended to have a higher virus incidence than in its other 3 replicas due to the influence of 2 edges, front and side, corresponding to the main street of the farm. We were not able to establish the first treatment of the first replica further in, or leave more beds on the side edge, because otherwise some treatments would have had vegetation in front of them and would not have had similar conditions as the others. The Keyplex treatments were applied once a week, at an initial dose of 10 cc / liter. The first application was made on March 29, twelve days after the melon transplant, in a drench method at the base of the plants. The second application was foliar, a week later, also at 10 cc / liter. The determination to use a high dose (10 cc / liter) in the first 2 applications was made because the plants were not protected from the nursery, but were exposed to high vector populations during the first 12 days by the surroundings of old plantations and because of poor quality of the cover cloth used. To carry out the applications with covered melon, the agribon was uncovered one bed at a time, and covered again after application, trying to cover it quickly to avoid unnecessary exposure to vectors (Figures No. 6 and 7). The control treatment, despite not receiving Keyplex treatment, was also uncovered and drench or foliar applied, as the case may be, only with water, to expose it to the same humidity and vector conditions of the other treatments during applications and uncovering. After the removal of the agribon, on April 12, the applications were all foliar. The first two replicates of each treatment were applied at 5 cc per liter and the last two at a dose of 7.5 cc per liter. The last application with KP 120 products was on May 3. In addition, after the second application, the decision was made to correct the pH of the water used for applications and also to use adherent to optimize applications since the dispersion of the application droplets on the leaves was notoriously low, as shown on Figure No. 8. The control treatment always received pure water sprayed on foliage during the application dates. In summary, five total applications were made, two of them while the plants were covered with agribon, and three after uncovering the crop. The application frequency was always every seven days.
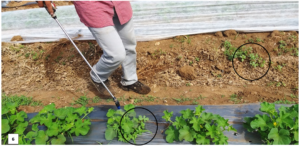
Figure No. 6: Uncovering the crop for foliar application, note the presence of Portulaca oleracea and volunteer (spontaneous) melon plants between beds, and the presence of P. oleracea in melon planting holes.
For the initial Tospo and / or Crinivirus samplings, with relatively small plants and without major overlap, the 4 beds of each replica of each treatment were observed in detail. Tospovirus were notorious for the deformations they caused in terminal shoots, as shown in Figure No.10. Although during this study we did not have access to laboratory tests to determine which Tospoviruses were present, the symptoms were easy to recognize. Tospoviruses have circular symptoms that no other viruses present and may or may not have necrosis or dead tissue in either affected foliage or fruit. Similarly, simply by observed symptoms, the incidence of Crinivirus was determined. Crinivirus in cucurbits cause yellowing with green stippling in middle or mature leaves but never deformations in terminal shoots or fruit.
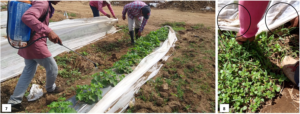 Figures 7 and 8: Considerable presence of volunteer (spontaneous) melon plants and weeds in head borders and between seedbeds still covered by agribon; and torn agribon indicated by the black circles in the photograph.
To evaluate the incidence and increase in Crinivirus, the variable “yellow spot” was created, which responds to the outstanding yellow color characteristic of plants affected by Crinivirus. A “yellow spot” is basically a protruding yellow spot caused by the incidence of Crinivirus from one or more contiguous plants. For the yellow spot count, data was taken per bed of each replica, that is, there were 4 data per replica, one for each seedbed, expressing the number of yellow spots present. Initially, with a small plant, the number of leaves affected by Crinivirus symptoms of each yellow spot was also counted. For the counting of fruit affected by Tospovirus, only 2 of the 4 beds of each replica were taken, and every fruit present in these beds was checked. On a sampling date, the first 2 beds of each replica were taken, and on the following date, the last 2 beds, thus, each replicate was fully evaluated and a real average of each treatment was obtained.
The intention was also to measure the effect of the KP 120 products on fungal diseases of common occurrence in the crop, but unfortunately the low relative humidity at that time did not allow the generalized proliferation of fungi such as powdery mildew, downy mildew, Alternaria and Geotrichum. Figures No. 11 and 12 show the incidence of Alternaria and Geotrichum found in very few fruits during the trial.
For the final evaluation of fruit quality, size and brix degree, only the last 2 replicas of the treatments were taken because unfortunately due to communication problems within the company, the first 2 replicas of the trial were harvested 2 days before our sampling date due to sale urgencies for local market. Due to this unfortunate event and to get the most out of the data, the unharvested replicas were fully sampled. Additionally, to demonstrate that the incidence of Crinivirus ended up being generalized, and that on the contrary, the presence of Tospovirus was very localized, 3 samples of 4 beds and 10 m long each were taken outside the trial site, within the same production plot but not on borders. In this sampling the data of the number of Crinivirus “yellow spots” per replica, the number of total fruits per linear meter of cultivation, and the average number of fruits affected by Tospovirus per replica were taken in order to make comparisons.
Results and Discussion
The first sampling after the removal of agribon was on April 12, date in which there was very little virus and, curiously, the control treatment had the lowest incidence of Crinivirus in the trial. The data presented show averages per replica. The sampling consisted of 4 replicas of 4 beds 10 m long for each treatment (n = 4 beds x 20 plants per bed x 4 replicates, that is, 320 total plants sampled per treatment).
The initial incidence of Crini and Tospovirus was directly linked to the presence of torn or bad conditions of the agribon, and to the presence of spontaneous plants and host weeds full of vectors at head borders and between planting beds. Tables No. 1 and 2 summarize the incidence of Crini and Tospovirus found in the first two samplings of this trial.
| VARIABLES/
TREATMENTS |
April 12, 2021 | April 19, 2021 | Increment observed on
plant average % virus |
||
| Average N° of plants with Crini /replica | Average % of virus | Average N° of plants with Crini /replica | Average % of virus | ||
| CONTROL | 0.31 + 0.60 | 0.39% | 3.38 + 2.33 | 4.22% | 3.07 3.83% |
| GRAY KP 120 V1 | 0.94 + 1.12 | 1.17% | 3.25 + 2.14 | 4.06% | 2.31 2.89% |
| GREEN KP 120 V2 | 1.13 + 1.36 | 1.41% | 2.00 + 1.71 | 2.50% | 0.87 1.09% |
| RED KP 120 Orig | 0.81 + 1.11 | 1.01% | 2.19 + 1.76 | 2.74% | 1.38 1.73% |
| WHITE KP 120 V3 | 1.25 + 1.53 | 1.56% | 3.44 + 2.85 | 4.30% | 2.19 2.74% |
 Figures 9 and 10: Very high whitefly population in volunteer (spontaneous) plants located in the plot in front of the trial, and symptoms of Tospovirus in the terminal shoot of a melon plant located in the Control treatment, with marked deformations and curling in the foliage.
Despite the high number of infected whiteflies and the presence of torn agribon, Crinivirus appears for the first time in trial plants around 3 weeks after transplanting, and subsequently its incidence rises rapidly. All the KP 120 treatments had a lower increase in the incidence of Crinivirus than the control in the period between the first 2 samplings, despite the fact that the control had the lowest incidence of Crinivirus at the beginning of the trial. Treatment of test plants with KP 120 products began on March 29, 12 days after transplanting, and 3 weeks later differences in Crinivirus incidence began to be notorious between the KP 120 treatments and the control. The pressure of Crinivirus due to the abundance of whitefly was such that, one week after the removal of agribon, the trial treatments already had an incidence of between 2.50 and 4.30% of Crinivirus. Treatments Green and Red showed the lowest increase in Crinivirus in that period between samplings (Table No.1).
| VARIABLES/
TREATMENTS |
April 12, 2021 | April 19, 2021 | Increment observed on
average of plants % of virus |
||
| Average of plants with Tospovirus | % of
virus |
Average of plants with Tospovirus | % of
virus |
||
| CONTROL | 0.19 + 0.40 | 0.24% | 2.13 + 1.41 | 2.66% | 1.94 2.42% |
| GREY V1 | 0.25 + 0.45 | 0.31% | 1.19 + 1.05 | 1.49% | 0.94 1.18% |
| GREEN V2 | 0.06 + 0.25 | 0.07% | 1.38 + 1.31 | 1.72% | 1.32 1.65% |
| RED Original | 0.13 + 0.34 | 0.16% | 1.75 + 1.65 | 2.19% | 1.62 2.03% |
| WHITE V3 | 0.25 + 0.58 | 0.31% | 1.69 + 1.85 | 2.11% | 1.44 1.80% |
Once again, the control showed the highest increase in Tospovirus incidence of the entire trial and the Gray and Green treatments showed the lowest increase in this period. Increases in Tospovirus directly affect production because damaged fruit has no commercial value. Early Tospovirus infections can significantly limit production by completely reject infected plants´production. The increase of Tospovirus in melon is not as fast as that of Crinivirus because vector thrips do not colonize melon at early age, but until flowering. Thrips do not actively disperse, but have slow movement, mainly in their immediate surroundings, as shown in the comparative data of the area sampled behind the front border (Table No.6). In contrast, whitefly, the vector of Crinivirus, colonizes plants still in the cotyledon stage, and is usually much more abundant than thrips.
| VARIABLE/
TREATMENT |
Large Fruit
Healthy Virotic %virus |
Medium Fruit
Healthy Virotic %virus |
Small Fruit
Healthy Virotic %virus |
Total Fruit
Healthy Virotic %virus |
No. of Fruits
Total Healthy/m |
| CONTROL | 72 4 5.26% | 136 36 20.93% | 53 12 18.46% | 261 52 16.61% | 313 3.26 |
| GRAY V1 | 109 2 1.80% | 133 7 5.00% | 73 13 15.12% | 315 22 6.53% | 337 3.94 |
| GREEN V2 | 94 5 5.05% | 133 16 10.74% | 63 7 10.00% | 290 28 8.80% | 318 3.62 |
| RED Orig | 102 9 8.11% | 144 18 11.11% | 49 6 10.90% | 295 33 10.06% | 328 3.69 |
| WHITE V3 | 110 5 4.35% | 141 25 15.06% | 45 10 18.18% | 296 40 11.90% | 336 3.70 |
The White, Gray and Red treatments had the highest number of large healthy fruits (110, 109 and 102, respectively), in 80 linear meter of crop sampled per treatment (2 beds of each replica), a number way above that presented in the control treatment (72 fruits). In general, all the KP 120 treatments had 22 or more additional fruits of large size than the control, equivalent to at least 0.27 more fruits per linear meter of crop. The White and Gray treatments had 38 and 37 large fruits more than the control, respectively, equivalent to 0.46 more fruits per linear meter of crop. Because this is a consistent trend in the KP 120 treatments, it is concluded that the increase observed in the number of large fruits corresponds to improvements attributable to the nutritional properties provided by the KP treatments.
The number of healthy fruits of medium size is quite similar between treatments, but not the number of medium virotic fruits, where the control has the highest number of fruits with virus (36) and the highest incidence of virotic fruit (20.93%). The Gray treatment has 4 times less incidence of virus in medium fruits (5.00% vs. 20.93%), and 5 times less medium fruit with virus (7 fruits of the Gray treatment against 36 of the control). The Green and Red treatments have practically only half the virotic medium sized fruits that the control has (16 and 18 vs 36 of the control, respectively). These numbers show very clearly the effect of prevention of infection by Tospovirus that KP 120 treatments have in Harper melon.
Regarding small fruit, it is observed that the Gray treatment has the highest number of infected fruit (13 vs. 12 of the control), as well as the highest number of small fruits in the sampling. The numbers indicate that this treatment had a delay in infection and at the same time continuity in the production of new fruit. Commonly, in the case of viruses that significantly affect plant growth and fruit quality, new fruit production is reduced in infected plants and abortion of newly formed fruit is frequent. If total numbers of fruit are observed, regardless of their state (healthy or diseased), the minimum and maximum difference between the control and the worst and best of the KP 120 treatments is 5 and 24 fruits in 80 linear m of cultivation, respectively. This means 0.06 and 0.3 additional fruits per linear meter for the worst and the best of the KP 120 treatments compared to the control. In addition to this, there are more large fruit in the KP 120 treatments and fewer virotic fruits. In the end, it all adds up, and the previously mentioned details contribute to higher yields and higher quality of fruit in the KP 120 treatments, which should be reflected at harvest. Note that the control has the highest percentage of virotic fruit of the entire trial and consequently has the lowest number of healthy fruits per linear meter of bed. The Gray treatment, with the lowest percentage of virotic fruit in the trial, in this sampling, has 0.68 more healthy fruits per linear meter than the control. All the KP 120 treatments have at least 0.37 more fruits per linear meter than the control in this sampling. With the current level of infection of the control, even greater differences in healthy fruit are expected later on because plants with early infection will not produce marketable fruit, while those with intermediate or late infection will produce at least the first picks without virus. In addition to the data on the incidence of virus by fruit size, data on the incidence of Crinivirus per treatment were taken. For this sampling, the four beds of each replica of each treatment were observed and the number of yellow spots per bed was noted. Furthermore, as it was still feasible, due to the medium size of plants, the leaves with Crinivirus symptoms of each reported yellow spot were counted. Table No.4 summarizes the data of the sampling carried out on April 26, 14 days after the removal of agribon in the present test.
| VARIABLES/ TREATMENTS | Average yellow spots of Crinivirus per bed | Average number of affected leaves |
| CONTROL | 5.50 + 1.79 | 4.91 + 2.07 |
| GRAY V1 | 3.00 + 1.32 | 4.78 + 2.70 |
| GREEN V2 | 3.25 + 1.81 | 4.19 + 2.03 |
| RED Original | 4.00 + 1.83 | 4.11 + 2.32 |
| WHITE V3 | 3.63 + 2.22 | 4.82 + 2.04 |
Again, the control treatment had the highest average number of “yellow spots” and of leaves with Crinivirus symptoms in the trial in this sample. The Gray and Green treatments had the least number of yellow spots and the Red and Green treatments the least number of leaves affected by Crinivirus per yellow spot. Note that the Gray and Green treatments, up to this date, are consistent in maintaining the lowest virus percentages, both in fruit (Tospovirus) and foliage (Crinivirus).
| TREATMENTS | Large Fruit
Healthy Virotic % virus |
Medium Fruit
Healthy Virotic % virus |
Total Fruit
Healthy Virotic % virus |
Number of Fruits
Total Healthy/m |
| CONTROL | 183 23 11.16 | 48 12 20.00% | 231 35 13.16% | 266 2.89 |
| GRAY V1 | 236 19 7.45 | 32 2 5.88% | 268 21 7.27% | 289 3.35 |
| GREEN V2 | 273 13 4.55 | 39 5 11.36% | 312 18 5.45% | 330 3.90 |
| RED Original | 200 19 8.68 | 50 5 9.09% | 250 24 8.76% | 274 3.12 |
| WHITE V3 | 183 19 9.41 | 54 7 11.48% | 237 26 9.89% | 263 2.96 |
On this sampling date, the 2 beds not previously sampled were evaluated. Again, the trends are maintained and the control had the highest percentage of virus infection and also the lowest number of healthy fruits in the trial. In addition, the tendency of most KP 120 treatments to have a greater number of large fruits than the control is maintained, with the exception of the White treatment, which has the same number of large fruits as the control (183 fruits). Note that in medium fruit, any of the KP 120 treatments has practically half the percentage of virus presented by the control and the Gray treatment has practically 4 times less virus in fruit than the control (5.88% vs. 20.00%). In number of medium sized virotic fruits, the Gray treatment has 6 times less virus-infected fruit than the control (2 vs. 12 virotic fruits). In total number of fruits, all the KP 120 treatments were above the control, although 2 of them by a small difference (White treatment with 237 and Red with 250 against 231 healthy fruits of the control). In number of healthy fruits per linear meter of crop, all KP 120 treatments were above the control. The White treatment had only 0.06 more fruits than the control and the Green one had 1.01 more healthy fruits per linear meter of crop than the control. In this sampling, small fruit were not counted because it was thought that they would not reach harvest. Additionally, all fruits with obvious virus symptoms from the 4 beds of each replica of each treatment were pruned. Definitely, 5 weeks after the start of applications, the effect of decreasing virus infection and increased number of healthy fruits per linear meter of crop of the KP 120 treatments over the control treatment is obvious.
| Variable/Treatment | Average # of healthy fruits/m | Average # of virotic fruits/m | Average % of Tospovirus in fruit | Avg. # of yellow spots of Crinivirus |
| CONTROL | 2.89 | 0.44 | 13.16% | 10.56 + 2.87 |
| AVERAGE KP 120 TREATMENTS | 3.33 | 0.27 | 7.84% | 7.31 + 2.41 |
| OUT OF THE BORDER CONTROL | 3.07 | 0.06 | 1.86% | 6.67 + 2.93 |
The data in Table No. 6 show that the strategy of establishing the virus study area at the front border of the plantation, due to the entry of the wind, was very adequate. The incidence of Tospovirus is very marked at the edges and the incidence of Crinivirus is also higher at the edges when the “yellow spot” variable is used to measure it. To notice the effect of the two viruses, putting all the replicas on the border was ideal because otherwise there would have been too much variability between replicas of a same treatment and the differences between treatments would not be noticeable. In general, there is a marked tendency for many insects to concentrate on edges; such is the case of whiteflies, aphids, thrips, and leaf miners. Therefore, it is essential to consider this vector behavior and the distribution of the viruses they transmit. To study the effect of various treatments on prevention or management of viruses, it is better to have relatively small plots in areas with the highest probability of infection, and to have 4 or more replicas than to establish completely random plots, of large size, within a field that, due to the behavior of vectors, has marked differences in virus incidence between borders and internal parts. The average number of virotic fruits per linear meter and the average percentage of virotic fruit in Table No. 6 is clear evidence of the above and fully justifies the methodology used for this study. This table also shows that the Keyplex treatments have a marked effect on productivity, having on average 0.44 and 0.26 more healthy fruits per meter than the control and the out of border control, respectively, despite the fact that the out of border control had less Tospovirus and Crinivirus incidence.
| Treatments/Variables | Avg # of healthy fruit/m
April 26, first 2 beds |
Avg # of healthy fruit/m
May 3rd, 2 beds left |
Avg # of healthy fruit/m
considering 4 beds/replica |
| CONTROL | 3.26 | 2.89 | 3.07 |
| GRAY V1 | 3.94 | 3.35 | 3.64 |
| GREEN V2 | 3.63 | 3.90 | 3.76 |
| RED Original | 3.69 | 3.12 | 3.40 |
| WHITE V3 | 3.70 | 2.96 | 3.33 |
The average of healthy fruit per linear meter of crop is tabulated for all treatments because all treatments had 2 replicas that included 1 moto (odd) furrow or furrow where the tractor passes, which normally has lower productivity, therefore leaving only the data of 2 sampling beds does not give a true figure of fruit development from each treatment. Again, there is a marked tendency for all KP 120 treatments to have a greater number of healthy fruits per linear meter of crop. The differences of the KP 120 treatments fluctuate between 0.26 and 0.69 more fruits per linear meter of crop than the control. On this date, the White and Green treatments have the lowest and highest average number of fruits per linear meter of crop, respectively. Note that as time passes, the decrease in the average of healthy fruits is accentuated in the treatments with the highest incidence of virus, and the number of healthy fruits per linear meter of crop of the control treatment decreases. The Gray and Green treatments remain as the 2 treatments with the lowest incidence of Tospovirus in fruit and both have the highest number of healthy fruits per linear meter of crop, surpassing the control by 0.57 and 0.67 fruits per linear meter of crop, respectively.
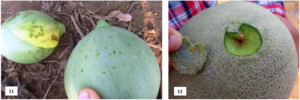 Figures 11 and 12: Initial symptoms of Alternaria in small fruit, and of Geotrichum in large fruit, with external injury and deep damage to the pulp.
| Sampling results on: | April 26th, 2021 | May 3rd, 2021 | |||
| TREATMENTS/
VARIABLES |
Avg Crinivirus yellow spots/bed | % virotic fruits in beds 1 and 2 | Total pruned virotic fruit in beds 3 and 4 | % virotic fruit in beds 3 and 4 | Avg % of virotic fruit |
| CONTROL | 10.56 + 2.87 | 13.16% | 26 | 9.77% | 11.46% |
| GRAY | 7.44 + 2.37 | 7.27% | 14 | 4.84% | 6.05% |
| GREEN | 7.69 + 2.15 | 5.45% | 23 | 6.97% | 6.21% |
| RED | 8.19 + 2.69 | 8.76% | 35 | 12.77% | 10.76% |
| WHITE | 5.94 + 2.43 | 9.89% | 30 | 11.41% | 10.65% |
The White treatment seems to have a masking effect of the yellow color in foliage caused by Crinivirus and presented the least number of yellow spots in this sample. Crinivirus has a marked effect on brix and also on fruit size and quality because it reduces the plant´s chlorophyll and thus its photosynthesis capacity. Again, the Gray and Green treatments presented the lowest percentage of virotic fruit, a very consistent characteristic since the second sampling of the trial, in addition to presenting considerably less “yellow spots” than the control.
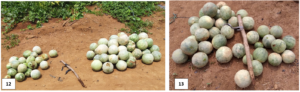 Figures 12 and 13: Pruned fruits from the control treatment (black), and from the Gray treatment, respectively.
| Number of packable fruits, according to their size, in 80 linear meters of bed sampled per treatment | ||||||||
| Variable/ Treatment | 6 Jumbo | 9 Jumbo | 9 Standard | 12 Standard | 15 Standard | 18 Standard | Total of packable fruit | Increase of fruit
over control |
| Control | 10 | 32 | 55 | 22 | 4 | 0 | 123 | – |
| Gray V1 | 9 | 37 | 92 | 45 | 14 | 0 | 197 | 74 |
| Green V2 | 6 | 35 | 84 | 64 | 12 | 4 | 205 | 82 |
| Red Original | 3 | 34 | 79 | 56 | 17 | 6 | 195 | 72 |
| White V3 | 14 | 40 | 93 | 36 | 24 | 0 | 207 | 84 |
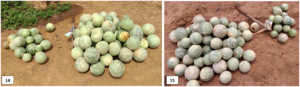 Figures 14 and 15: Pruned fruit of the White and Red treatments, respectively.
The number of packable fruits of the control is much lower than that of any KP 120 treatment, and with the exception of the Jumbo sizes, where the number of fruits of the control is relatively similar to that of the rest of the treatments, from standard size 9 onwards, the control has much less fruit than any other treatment. Most likely, the control has high numbers in the Jumbo size because the virotic fruit was pruned on May 3, two weeks before, and that allowed the little that was not virotic to gain weight until it grew considerably. On the other hand, during the fruit count, initially the sampler only classified the fruit from the first replica of the control as Jumbo, without specifying size (6 or 9), so we only repeated the numbers found in the second replica and very likely there were different numbers in those sizes due to the variability that always exists between replicas. Of size 12, the control has half or less than any KP 120 treatment (22 fruits of the control against 64 of Green, 56 of Red, 45 of Gray), with the exception of White, while size 15 has from 3 and up 6 times less fruits than the KP 120 treatments (4 fruits of the control against 24 of the White, 17 of the Red, 14 of the Gray and 12 of the Green). This last characteristic of little fruit of smaller sizes of the control shows that its infection was earlier than that of the KP 120 treatments and that therefore, it had few fruits of smaller sizes since these were probably discarded by pruning for being virotic.
 Figures 16 and 17: Pruned fruit from all replicas of the Green treatment and fruit of the same size from the Keyplex (K) and Control (T) treatments, with a better woven net and less flattened or round fruit shape in the fruits of the Keyplex treatment.
| Number of exportable fruit boxes according to their size per treatment | ||||||||
| Treatment | 6 Jumbo | 9 Jumbo | 9 Stand | 12 Stand | 15 Stand | 18 Stand | Total boxes | Increasing boxes over Control |
| Control | 81 | 173 | 297 | 89 | 13 | 0 | 653 | – |
| Gray V1 | 73 | 200 | 497 | 182 | 55 | 0 | 1007 | 354 |
| Green V2 | 49 | 189 | 454 | 256 | 39 | 11 | 998 | 345 |
| Red Original | 24 | 184 | 427 | 227 | 55 | 16 | 933 | 280 |
| White V3 | 113 | 216 | 502 | 146 | 78 | 0 | 1055 | 402 |
The control treatment presents more boxes of Jumbo size 6 than 3 of the KP 120 treatments, however in all the other sizes it has a lower number of exportable boxes and in the end, it has between 280 and 402 boxes less than the worst and the best KP 120 treatments, Red and White, respectively. Interestingly, the White treatment had maintained, throughout the trial, a lower number of fruits per linear meter of crop but it enlarged its fruit better than any other treatment and/or maintained fruit with better quality characteristics than all the other treatments, therefore it ended up being the treatment with the highest number of packable fruits and the best performance of the trial (Tables No. 9 and 10, respectively). The White treatment presents, in all sizes, with the exception of the 12 standard, a greater number of fruits than any other treatment, which indicates that its capacity for enlargement and maintenance of fruit quality is very good, although its virus prevention effect against Tospovirus was not the best. The Gray and Green treatments had a very similar performance and both maintained, consistently, the lower rate of infection by Tospovirus and a lower number of yellow spots than the control. The Red treatment did not excel in virus prevention or fruit enlargement, however, it achieved higher yields than the control, having 280 more boxes per manzana. In general terms, these results demonstrate that KP 120 products apparently allow improvements in nutrition that translate into increases in yield in production systems where nutritional management is not as fine or detailed.
| Brix by fruit size and as a total average of each treatment | |||||||
| Treatment | 6 Jumbo | 9 Jumbo | 9 Stand | 12 Stand | 15 Stand | 18 Stand | Average Brix of Total Sampled Fruit |
| Control | 5.05 | 8.15 | 7.00 | 6.6 | 6.10 | – | 6.58 + 1.26 |
| Gray V1 | 8.05 | 7.35 | 7.65 | 6.0 | 6.00 | – | 7.01 + 1.14 |
| Green V2 | 7.20 | 6.50 | 5.95 | 6.5 | 5.35 | 5.5 | 6.13 + 0.70 |
| Red Original | 5.10 | 6.60 | 6.00 | 6.0 | 5.05 | 6.0 | 5.84 + 0.77 |
| White V3 | 8.10 | 8.00 | 6.25 | 6.1 | 6.10 | – | 6.91 + 1.54 |
The present trial had a very high incidence of Crinivirus due to its proximity to old harvested plots, surroundings with host weeds for whiteflies, and due to the outflow of the wind after its journey through old and affected crops. No effort was made to correct the decrease in fruit brix in any treatment as a consequence of the high Crinivirus infestation and, although it is true that the brix obtained in this trial is below than expected for export, the fruit was harvested early and for local market due to the lack of available fruit and its sudden rise in price because of scarcity. Note that three of the four KP 120 treatments had average brix above those presented by the control and only the Green treatment had average brix below the control. On the other hand, only a maximum of two fruits of the same size were sampled per treatment to obtain the brix data. Had we sampled 4 or more fruits to obtain the data, we probably would have had less variability in the results. The two best KP 120 treatments in terms of performance, that is, White and Gray, also had the best brix in the trial. On the other hand, it should be noted that the Capaz hybrid generally does not present brix above 12 even with good management conditions, which is why, with the high incidence of Crinivirus, we probably had such low averages. In general, the trend in brix evaluation indicates that larger fruit generally have better brix. This was the case of the fruit from the White and Gray treatments, not the case of the control, which had an average brix of 5.05 for its Jumbo 6 fruit. The Green and Red treatments did not have fruit with ranges of 8.
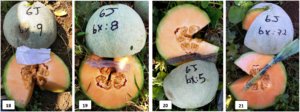 Figures 18, 19, 20 and 21: Examples of packable fruit quality and brix for White, Gray, Control and Green treatments.
Seeing results of average “yellow spots” in previous samplings (Tables No. 4 and 8, corresponding to dates April 26 and May 3), the average estimate of healthy fruits per treatment (Table No. 7), and the final results of packable fruits (Table No. 9) powerfully draws attention to the fact that the White treatment, which had an incidence of Tospovirus close to that of the control, and a considerable pruning of virotic fruits (Figure No. 14), ended up being the treatment with the highest yield of the trial thanks to a greater number of jumbo fruits and sizes 9, 12 and 15 (Table No. 10).
| Variable/ Treatments | Yellow spots
April 26 |
Yellow spots
May 3rd |
Increase in yellow spots number | # of healthy fruits in 80 m according to estimate | Packable Fruit
Number % of estimate |
| Control | 5.50 + 1.79 | 10.56 + 2.87 | 5.06 | 3.07 x 80 = 246 | 123 50% |
| Gray V1 | 3.00 + 1.32 | 7.44 + 2.37 | 4.44 | 3.64 x 80 = 291 | 197 68% |
| Green V2 | 3.25 + 1.81 | 7.69 + 2.15 | 4.44 | 3.76 x 80 = 301 | 205 68% |
| Red Original | 4.00 + 1.83 | 8.19 + 2.69 | 4.19 | 3.40 x 80= 272 | 195 71% |
| White V3 | 3.63 + 2.22 | 5.94 + 2.43 | 2.31 | 3.33 x 80= 266 | 207 78% |
The response to this notable enlargement of fruits from the White treatment could be related to the low increase in “yellow spots” compared to the control and to the rest of the KP 120 treatments (2.31 yellow spots increase in the White treatment against 5.06 in the control and with increases between 4.19 and 4.44 of yellow spots per bed for the rest of KP 120 treatments). The reduced number of yellow spots from the White treatment indicates its ability to maintain greener leaves and therefore have plants with higher photosynthesis. The data of average “yellow spots” per 10 m long bed clearly indicate that the White treatment considerably reduces infection or Crinivirus affectation and that apparently translates, in the long run, into better fruit enlargement, as shown by the numbers of packable fruits and the percentage of healthy fruits that became packable fruits (Table No. 12).
Only 50% of the total fruits estimated in 80 linear meters of crop were packable in the control treatment, against 68% of the Gray and Green treatments, 71% of the Red treatment and 78% of the White treatment. These percentages clearly indicate that all the KP 120 treatments improve the amount of packable fruit compared to the control, and that the White treatment has the highest packing rate of all the treatments possibly thanks to its diminishing effect on Crinivirus.
General Conclusions
This trial was purposely mounted exclusively on the front edge of a young plot of Capaz hybrid Harper melon surrounded by old crops, with poor quality agribon to protect the crop against vectors, and with wind drift through abandoned lots or in harvest and filled with whitefly and thrips in order to expose the test plants to the highest possible pressure by Crini and Tospovirus under commercial management conditions. For research purposes this setting is highly recommended, and as shown in this trial, such setting allows for any possible differences between treatments to easily show up. The samplings carried out over time show that the differences in yield found between the control and the KP 120 treatments are the product of a combination of factors: 1) the production of a greater number of fruits per linear meter of crop, 2) a lower loss of fruit due to Tospovirus, and 3) better enlargement and quality of the fruit as a consequence of the suppressive effect of the Keyplex KP 120 treatments on Crinivirus. Of the four KP 120 treatments tested there are 3 very outstanding, 2 in decreasing the incidence of Tospovirus in fruit (Gray and Green treatments), and 1 in suppressing Crinivirus symptoms and consequently increasing the enlargement and quality of packable fruit (White treatment). It is important to point out that the White treatment, which had the highest Crinivirus suppression, ended up being the treatment with the highest yield, the highest percentage of packable fruit, and with one of the best brix of the trial, despite the fact that it did not have the best effect against Tospovirus. To date, in melon growing areas in Central America, Crinivirus incidence during the dry or second growing season, from January to April, is one of the most limiting production factors. The present results show that Keyplex KP 120 V3, the White treatment, can be a very valuable preventive tool to combat Crinivirus even under the worst vector and incidence conditions, when used weekly until 3 weeks before harvest. The hypothesis that the Keyplex treatments, with their resistance promoters, would help prevent virus infection and consequently allow for higher yields and quality melons in treated plants proved right. All KP 120 Keyplex treatments ended up having less Crini and Tospovirus incidence, higher number of healthy fruits per meter of crop, higher yields, and a higher estimate of packable fruit than the control treatment. This fact shows that resistance promoters used in plants, like the Keyplex KP 120 products, can be a very efficient, useful, practical, and affordable tool against viral infections, and have, at the same time, a positive effect on yield and fruit quality. These products can be sprayed or injected through the drip irrigation system weekly, and can be used before and after transplant as a preventive tool.
From what has been observed in this and other local trials, it could be said that even though the present results were consistently better than those of the control treatment in all variables tested, it is necessary to do local tests to know which KP 120 treatment is more effective against which disease and that although all treatments seem to help to some extent to reduce Tospo and Crinivirus, and to better enlarge the fruit, some treatments are more effective than others against certain viruses. Most likely, under production conditions, the ideal would be a combined use of these products, where the treatment to prevent Tospo and other viruses is used early, and KP 120 V3, optimal for fattening fruit, is used in combination or later to optimize virus prevention and fruit enlargement. It is recommended to repeat tests during the rainy season to see the effect of KP120 products on fungal and bacterial diseases, since good results are also expected against them.