ISSN: 2641-6816
Frequency: Continuous
Format: PDF and HTML
Versions: Online (Open Access)
Year first Published: 2018
Language: English
| Journal Menu |
| Editorial Board |
| Reviewer Board |
| Articles |
| Open Access |
| Special Issue Proposals |
| Guidelines for Authors |
| Guidelines for Editors |
| Guidelines for Reviewers |
| Membership |
| Fee and Guidelines |
 |
Determination of cyanide concentration levels among cassava (Manihot esculenta Crantz) germplasm in Kenya
Nyamwamu Nyarang’o Charles*1, Pascaline Jeruto1, Elizabeth Njenga1, Enos Wambu2, Susan Arama3, Peter Futi Arama4
1School of Science, Department of Biological Sciences, University of Eldoret, P. O. Box 1125 – 30100, Eldoret, Kenya
2Department of Chemistry and Biochemistry, University of Eldoret, P. O. Box 1125- 30100, Eldoret Kenya
3Department of Chemistry. Technical University of Mombasa; P.O. Box, 90420- 80100, Mombasa, Kenya
4School of Science, Agriculture and Environmental Studies, Rongo University, P.O. Box 103 – 40404, Rongo, Kenya
Received Date: 10 March 2025; Accepted Date: 25 March 2025; Published Date: 07 April 2025;
*Corresponding author: Nyamwamu Nyarang’o Charles, School of Science, Department of Biological Sciences, University of Eldoret, P. O. Box 1125 – 30100 Eldoret, Kenya. Email: nyamwamucharles@gmail.com
Citation: Nyamwamu CN, Jeruto P, Njenga E, Wambu E, Arama S, Arama PF (2025) Determination of cyanide concentration levels among cassava (Manihot esculenta Crantz) germplasm in Kenya. Adv in Nutri and Food Sci: ANAFS-257.
DOI: 10.37722/ANAFS.2025103
Abstract
Cassava (Manihot esculenta Crantz) is a major carbohydrate source in the human diet, yet certain varieties harbor high cyanogenic glycoside concentrations, posing risks of cyanide toxicity. This study sought to determine cyanide concentration levels in leaves, peels, and pulps of cassava varieties selected from earlier morphological characterization studies carried out in Kenya. A total of 32 varieties were selected for cyanide content analysis using picrate paper and spectrophotometric methods. Similarly, an on-field study was conducted in Migori County, Kenya to assess cyanide concentrations in cassava varieties grown by farmers using picrate paper method. Using the spectrophotometric method, the leaves, peels and pulps had overall average cyanide concentrations of 5.89 mg/L CN–, 7.42 mg/L CN– and 8.20 mg/L CN– respectively. The same trend was realized using the picrate paper analysis where the leaves had average cyanide concentration of 3.13 mg/L CN–, the peels had average 5.44 mg/L CN– and the pulp had the highest average cyanide concentration of 7.97 mg/L CN–. Using the spectrophotometer analysis of the leaves, the variety Nyarkadera exhibited the highest cyanide concentration of 26.93 mg/L CN–, while the lowest was observed in the varieties Nyatanga – 002, Nyakanyamkago and Kasukali (0.40 mg/L CN–). Peels of Kazanzwara recorded the highest cyanide concentration of 17.82 mg/L CN–, whereas Kasukali showed the least cyanide concentration of 1.19 mg/L CN–. Results obtained from the pulps showed that the variety Nyatanga had the highest cyanide concentration of 26.93 mg/L CN– while the least cyanide concentration was recorded on the variety Mzungu (0.40 mg/L CN–). Based on the two techniques of analyses, the study established moderate positive correlations (r=0.547 and r=0.570) between cyanide levels in leaves and peels of different cassava varieties respectively. A strong positive correlation of r=0.936 was found in the analysis of pulps indicating high consistency of the two methods. In the field study 15 varieties out of 32 had high cyanide concentrations between 10-30 mg/L CN– while 17 varieties had low cyanide concentration. This showed that farmers still planted high and low cyanide varieties in almost equal proportions. The picrate paper analysis was found appropriate for use effectively in assessing cyanide concentrations in the field. The variability in cyanide levels among the cassava accessions appeared to emphasize need to characterize varieties by cyanogenic potential for breeding programs and consumer guidance.
Keywords: Cassava, Cyanogenic glycoside, Cyanide toxicity, Kenya, Picrate paper, Spectrophotometer
Introduction
Cassava (Manihot esculenta Crantz) is a staple crop widely cultivated in tropical and sub-tropical regions due to its adaptability to diverse environmental conditions and its role in food security of many countries (Lambebo and Deme, 2022;
Mbinda and Mukami, 2022; FAOSTAT, 2023). However, different cassava varieties have been shown to contain varying levels of cyanogenic glucosides, primarily linamarin and lotaustralin, which release toxic hydrogen cyanide (HCN) when hydrolyzed (Ndubuisi and Chidiebere, 2018). High cyanide levels in cassava pose health risks in populations that rely on cassava as a primary food source (Mosayyebi et al., 2020). Chronic exposure to cyanide has been associated with health risks including tropical ataxic neuropathy, goiter and Konzo – a paralytic disease, when adequate detoxification is not conducted (Ernesto et al., 2000; Cliff et al., 2011; Alitubeera et al., 2019; Nyamekye, 2021).
The cyanide concentration in cassava varies significantly among cultivars, as it is influenced by both genetic (Ndubuisi and Chidiebere, 2018) and environmental factors (Ospina et al., 2024). Nyirenda, (2021) reported that every cassava variety contains cyanogenic glycosides in varying quantities. In general, cyanogenic compounds were observed to be higher within the cortex (~804 ppm) than in the root parenchyma (~305 ppm) (Ospina et al., 2024). Hawashi et al., (2019) explained that cassava leaves contain 5 to 20 times more cyanogenic glycosides than in the cortex (peels) and parenchyma (pulp) and are considered potentially more toxic if consumed than the root tubers.
According to Kwok (2008), the toxic hydrogen cyanide (HCN) is released as a result of enzymatic hydrolysis by β-glucosidase following the maceration of plant tissues as they are consumed or by gut microflora, leading to the breakdown of cyanogenic glycosides. This process can be represented by the following biochemical equation:
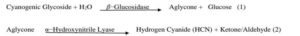
A complex molecule (cyanogenic glycoside) being broken down into two parts (aglycone and glucose) (Equation 1). One of those parts (aglycone) is still unstable and breaks down further into two more pieces (hydrogen cyanide and a ketone/aldehyde). Thus, equation (2) is a direct consequence of equation (1), showing the further breakdown of the aglycone produced in the initial hydrolysis of the cyanogenic glycoside.
This leads to cyanide toxicity, which could manifest as nausea, headache, confusion, feebleness, unconsciousness and eventually death in both animals and humans (Mosayyebi et al., 2020). The acute threshold fatal doses of cyanide ranges from 0.5–3.5 mg/kg body weight (WHO, 2011), whereas the chronic cyanide dose for daily consumption is 0.02 mg cyanide/kg body weight (Harenčár et al., 2021).
Even though, it has been established that improved cassava cultivars generally have lower cyanide concentrations compared to traditional varieties, whose cyanide levels often exceed the safe limit of 10 mg/kg set by the World Health Organization (FAO, 1991), and while certain cultivars are generally classified as sweet (or low cyanide) or bitter (having high cyanide) based on their cyanide levels, such classifications can be ambiguous, as the threshold for bitterness is subjective and depends on consumer tolerance (Ndubuisi and Chidiebere, 2018). The objectives of this study were to determinedyanide concentration levels in the leaves, peels and pulp using picrate paper method and spectrophotometer. The picrate paper method was further used to analyze cyanide levels in cassava varieties under farmers’ condition.
Materials and Methods
The plant materials
A total of 32 popular cassava varieties grown in Kenya were sampled from four distinct clusters derived from earlier morphological characterization studies (Nyamwamu et al., 2023). These were grown at the Rongo University (RU) farm. Young leaves and tubers were collected from 12-months old plants, separately packed in labeled polythene bags and transported to laboratory for cyanide content analysis.
Processing of cassava leaves
The petioles were removed from the leaf samples. Exactly 30 g of each sample was weighed using analytical balance (Pioneer Model PX 5231/E (0.001G Precision, Max. 520G) manufactured by Ohaus Corporation, New Jersey, USA). Samples were ground into a paste using a mortar and pestle as described by Onukwa, (2005). The resulting paste was placed in vials for analysis.
Processing of cassava peels (cortex)
The tubers were cleaned thoroughly using tap water to remove any soil or debris. Each sample was then sectioned using a sharp blade into distinct parts: (a) peels and (b) pulp. Thirty grams of the peel was weighed and ground into a paste using a mortar and pestle as described by Onukwa, (2005). The resulting paste was transferred into labeled reaction vials for analysis.
Processing of cassava pulps (parenchyma)
Similarly, exactly 30 g of each of the pulp samples was weighed and ground into a paste and placed in labeled reaction vials for analysis.
Samples analysis
Qualitative determination of cyanide in leaves, peels and pulp using picrate paper method
Cyanide test kit Quantofix (A007858/91318/0242.5) was supplied by Macherey-Nagel GmbH & Co. KG, Germany. Using a micropipette, 5 mL of distilled water was added to each the sample. One level spoon of CN-1 buffer was added to each vial to stabilize the pH and support the release of cyanide gas. Five drops of CN-2 were then added to each of the reaction vials. Picrate paper strips were carefully placed into each reaction vial using forceps, with the strips suspended just above the sample mixture while care was taken to avoid any direct contact between the strips and the paste. Each vial was then sealed tightly using a stopper. The reaction vials were incubated in a water bath at 30–35°C for 30–60 min. The vials were then opened and the color of the picrate papers matched against a picrate color chart (Figure 1). The total amount of cyanide in each sample was read in mg/L CN– from the color chart and recorded.
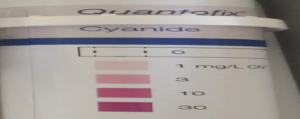
Figure 1: Cassava Cyanogen Kit color chart for cyanide determination
Source: Adopted from Cyanide test kit Quantofix (A007858/91318/0242.5); Macherey-Nagel GmbH & Co. KG, Germany
Semi-quantitative determination of cyanide using Spectrophotometer
Following the qualitative assay, each picrate paper strip was removed from the reaction vials using forceps and soaked in a cuvette containing 5 mL of distilled water for 3 min while gently swirling to allow the color to transfer from the paper into the solution. The cuvettes containing the color extract solutions were then placed into the spectrophotometer and absorbance of the picrate solution read at 510 nm using UV-visible spectrophotometer (Model BK-D590; Libra S12, Biobase, China) (Bradbury et al., 1999).
Sample preparation of cassava accessions collected from field survey
A survey was carried out in farmers’ fields in Migori County. Plants chosen were 9-15 months old. The farmers were requested to provide local names for each variety sampled. One plant was uprooted to represent the variety grown. The cassava tubers were obtained and washed to remove soil and other debris. Thin slices (approximately 2 mm thick) were cut from the tubers using a sterilized knife to expose the inner tissue (peels and pulp) for analysis. The pulp was ground using mortar and pestle. Cyanide concentration was determined using the picrate paper method (as described above). The cyanide levels in the peels were analyzed for samples with high levels of cyanide in the pulp.
Spectrophotometer data Analysis
Calculation of the total cyanide content (ppm) in each of the cassava sample was determined using the equation of Bradbury et al., (1999) and Rezaul et al., (2002):
![]()
where the constant 396 is a conversion factor that relates the absorbance obtained from a spectrophotometric analysis to the cyanide concentration in parts per million (ppm).
Correlation analysis was carried out to determine the strength and direction of the linear relationship between picrate paper (color chart) and spectrophotometer. The level of significant difference was determined at p < 0.01 using SPSS program (version 27) IBM.
Results
Spectrophotometer analysis
The results of analyses of cyanide levels in the leaves, peels and pulps of the different cassava accessions as determined by the two methods is presented in Table 1. The average cyanide levels observed in leaves, peels and pulp was 5.89 mg/L CN–, 7.42 mg/L CN– and 8.20 mg/L CN– respectively. The highest cyanide concentration in the leaves was observed in the varieties Nyarkadera (Accession 075) collected from Migori County (26.93 mg/L CN–) and Karembo (Accession 093) collected from Kilifi County (24.55 mg/L CN–) while the lowest cyanide content in the leaves was observed in the varieties Kasukali (Accession 015), Nyakanyamkago (Accession 114) and Nyatanga-02 (Accession 036) all of which had 0.40 mg/L CN– (Table 1). The highest cyanide concentration in the peels was observed in the varieties Kazanzwala collected from Makueni County (17.82 mg/L CN–) and Wild cassava – 002 collected from Homa bay County (16.63mg/L CN–). The lowest cyanide content in the peels was observed in the varieties Kasukali and Karembo which had 1.19 mg/L CN– and 1.58 mg/L CN– respectively (Table 1). The spectrophotometer analysis for the pulp indicated that the highest cyanide content was in the varieties Nyatanga (26.93 mg/L CN–) and NyaRanen (26.53 mg/L CN–). Similarly, the lowest cyanide content in the pulp was observed in the varieties Mzungu (0.40 mg/L CN–) and Kasukali (0.79 mg/L CN–) (Table 1).
Picrate paper test method
Results presented in Table 1 showed that the average cyanide content in the leaves, peels and pulp were 3.13mg/L CN–, 5.44 mg/L CN– and 7.97 mg/L CN– respectively.
Cyanide in leaves: Several varieties including Nyarkadera (Acc. 075), Karembo (Acc. 093), Nyakanyamkago (Acc. 114), Fumbachai (Acc. 132) all showed the highest level of cyanide concentration of 10 mg/L CN–. Results presented in Table 1 indicated that 12 varieties had low score of 1 mg/L CN– in the leaves.
Cyanide in peels: The highest score for cyanide content in the peels was 10 mg/L CN–. A total of 14 varieties were recorded with this score. On the other hand, a total of 10 varieties had a score of 1 mg/L CN– while 8 varieties had a score of 3 mg/L CN– (Table 1).
Table 1: Cyanide determination in cassava leaves, peels and pulps
| Accession
No. |
Accession | County collected | Spectrophotometric analysis (Aggregate cyanide (mg/L CN–)= Absorbance x 396) | Picrate paper method (Color chart readings (concentration in mg/L CN–) | ||||
| Leaves | Peels | Pulp | Leaves | Peels | Pulp | |||
| 075
093 061 074 068 090 020 018 062 099 029 002 127 004 089 035 088 026 067 102 008 014 084 132 122 025 060 091 024 015 114 036 |
Nyarkadera
Karembo Machoberi Nyarkogotu-002 Madam Adhiambo lera Kazanzwara Katune Adhiambo lera Nyatanga Wild cassava-002 Mzungu NyarMaseno Mbale-001 Mtwapa-009 Selele-004 F 119 Wild cassava -001 Agriculture-012 Obaro dak-001 NyaRanen Kamgundho Nyasuna Fumbachai Ratena Nyaeta Busia-002 Katsuhanzala Selele-002 Kasukali Nyakanyamkago Nyatanga-002 |
Migori
Kilifi Migori Homa Bay Migori Kilifi Makueni Makueni Migori Migori Homa bay Kilifi Busia Kilifi Kilifi Migori Kilifi Migori Migori Homa bay Migori Migori Migori Busia Migori Migori Busia Kilifi Migori Makueni Migori Migori |
26.93
24.55 13.07 9.90 8.32 7.92 7.92 7.92 7.92 6.34 5.94 5.94 5.94 5.54 5.15 3.96 3.96 3.96 3.56 3.56 3.56 3.17 3.17 2.77 1.98 1.58 1.19 0.79 0.79 0.40 0.40 0.40 |
3.56
1.58 6.34 11.48 2.34 2.77 17.82 13.86 14.26 10.30 16.63 1.98 9.90 9.50 3.56 13.86 4.75 11.88 3.56 8.71 4.36 4.75 5.54 3.17 2.77 3.56 10.30 9.11 15.04 1.19 5.94 3.17 |
2.38
9.11 3.56 5.15 10.30 3.17 5.54 14.65 7.13 26.93 5.94 0.40 6.34 3.96 4.76 6.34 2.36 5.54 1.98 2.77 26.53 2.38 9.50 11.09 20.20 4.75 17.42 18.22 5.94 0.79 13.07 4.36 |
10
10 3 1 1 3 3 3 3 3 3 3 3 3 3 3 1 3 3 3 3 1 1 10 1 1 1 1 1 1 10 1 |
10
1 1 3 10 3 10 3 10 10 10 1 10 3 1 1 10 10 3 1 10 3 1 1 1 10 10 10 10 1 3 3 |
3
10 3 10 3 1 3 3 30 30 1 3 10 1 3 1 3 1 1 30 10 10 1 1 3 30 3 1 3 30 10 3 |
| Average | 5.89 | 7.42 | 8.20 | 3.13 | 5.44 | 7.97 | ||
| 1 mg/kg or 1 mg/L = 1 ppm | ||||||||
Correlation analysis between picrate paper method (color chart readings) and cyanide content from spectrophotometer analysis
Correlation analysis was carried out on the two methods used for cyanide analysis. The results presented in Table 2 indicated that the correlation coefficient on the two methods for cyanide
analysis on the leaves was 0.548** (p=0.001) while the correlation between the two methods on the cyanide content in peels was 0.570** (p=0.001) (Table 3). The highest correlation between these two methods was observed in the cyanide analysis of the pulp which showed a correlation of 0.936 (Table 4).
Table 2: Correlation analysis on leaves
| Picrate paper method | Pearson Correlation | Picrate paper method | Spectrophotometer method |
| 1 | .548** | ||
| Sig. (2-tailed) | .001 | ||
| N | 32 | 32 | |
| Spectrophotometer method | Pearson Correlation | .548** | 1 |
| Sig. (2-tailed) | .001 | ||
| N | 32 | 32 | |
| **. Correlation is significant at the 0.01 level (2-tailed). | |||
Table 3: Correlation analysis on peels
| Picrate paper method | Pearson Correlation | Picrate paper method | Spectrophotometer method |
| 1 | .570** | ||
| Sig. (2-tailed) | .001 | ||
| N | 32 | 32 | |
| Spectrophotometer method | Pearson Correlation | .570** | 1 |
| Sig. (2-tailed) | .001 | ||
| N | 32 | 32 | |
| **. Correlation is significant at the 0.01 level (2-tailed). | |||
Table 4: Correlation analysis on pulps
| Picrate paper method | Pearson Correlation | Picrate paper method | Spectrophotometer method |
| 1 | .936** | ||
| Sig. (2-tailed) | .000 | ||
| N | 32 | 32 | |
| Spectrophotometer method | Pearson Correlation | .936** | 1 |
| Sig. (2-tailed) | .000 | ||
| N | 32 | 32 | |
| **. Correlation is significant at the 0.01 level (2-tailed). | |||
Cyanide concentration levels in cassava accessions collected from farmers in Migori county, Kenya
Results presented in Table 5 indicated that 13 Accessions (206-230) exhibited the highest detectable level of 30 mg/LCN–. Two Accessions (225 and 227) showed a moderate concentration of 10 mg/L CN–. Eleven accessions had the lowest recorded concentration of 1 mg/L CN– (Table 5).
Table 5: Cyanide concentration levels in cassava samples collected from farmers in Migori county, Kenya
| Accession No. | Accession name | Color chart readings (concentration in mg/LCN–) |
| Leaves/peels | ||
| 206
207 208 209 210 211 212 213 214 215 228 229 230 225 227 200 201 205 217 226 231 203 204 216 218 219 220 221 222 223 224 232 |
Waite Nyaabasi-002
Waite Nyabasi-003 (peels) Waite Nyabasi-004 Waite Nyabasi-005 (peels) Sudhe-001 Sudhe-002 (peels) Machicha-001 Machicha-002 (peels) Dar- saalam-001 Dar- saalam-002 (peels) Agriculture-001 Nyakade-001 Nyakade-002 (peels) Bondeni-002 Bondeni-004 Nyasakwa IFAD Waite Maeta-001 Rateng yellow-002 (peels) Bondeni-003 Grade-001 Nguruna-001 Nguruna-002 Rateng yellow-001 Rateng black Roteng Rabuor Bith Nyadundo-001 Bith Nyadundo-002 Sagero Bondeni-001 Kanyamwa |
30
30 30 30 30 30 30 30 30 30 30 30 30 10 10 3 3 3 3 3 3 1 1 1 1 1 1 1 1 1 1 1 |
| 1 mg/kg OR 1 mg/L = 1 ppm | ||
Discussion
All cassava varieties contain cyanide at different concentrations with the “sweet” varieties containing low cyanide while the “bitter” varieties containing high cyanide concentrations. The WHO-recommended threshold of safe cyanide concentration for food is 10 mg/L CN– (WHO, 2016). High cyanide levels can lead to acute poisoning, causing symptoms such as dizziness, vomiting, and, in severe cases, death (Burns et al., 2010). Chronic exposure is linked to neurological disorders such as Konzo, particularly in populations relying on cassava as a staple food (Ernesto et al., 2000).
The observed variations in cyanide levels between accessions and within plant parts are consistent with the complex genetic control of cyanogenic glycoside production in cassava, as well as the influence of environmental factors such as soil conditions, climate, and agricultural practices (Egan et al., 1998).
Analysis of cyanide in cassava is essential due to its potential toxicity to humans and livestock. Different methods are used for cyanide quantification in cassava, including titration, the picrate paper method, and spectrophotometric analysis (Bradbury et al., 1999). The current study compared the picrate paper method with spectrophotometric analysis, showing low correlation, particularly in peels and leaves (Table 1). The spectrophotometric method showed that the leaves had the least average cyanide concentration (5.89 mg/L CN–) while the peels had average cyanide concentration of 7.42 mg/L CN–. The pulp had the highest average cyanide concentration of 8.20 mg/L CN–. The same trend was observed using the picrate paper method.
This general trend of higher cyanide in roots (pulp and peels combined) compared to leaves aligns with studies by Selmar, (1994) and Nambisan, (2011). These authors noted that leaves are the primary site of cyanogenic glucoside synthesis, but these compounds are often translocated and accumulate in the roots. However, the current study’s contrasts with other studies. Moriasi et al., (2017), studying cassava in Kenya, found the highest cyanide levels in the cortex of both edible and poisonous cassava varieties. Also, Udeme et al., (2017) reported the highest levels in the peels of yellow cassava varieties intended for livestock feed, while in a related study, Fekadu et al., (2017), while examining sweet cassava in Ethiopia, found the cortex to have the highest concentration, followed by parenchyma (pulp), and then the pith. In a related study, Ospina et al., (2024) also found the highest concentration in the cortex, followed by leaves and then parenchyma. The study noted that this pattern was likely due to the cortex’s primary function in storage and transport, allowing for higher accumulation of substances. The leaves, being sites of active metabolism, exhibited moderate concentrations as they continuously process and redistribute compounds. In contrast, the parenchyma, mainly responsible for structural support and basic physiological functions, retained the lowest concentration due to its reduced involvement in storage and transport (Cardoso et al., 2005).
This current study’s observation of significant variation in cyanide levels among different cassava varieties strongly agrees with previous findings (Aalbersberg and Limalevu, 1991; Cardoso et al., 2005; Ndubuisi and Chidiebere et al., 2018) which consistently demonstrated that cassava varieties exhibited a wide range of inherent capacities for cyanide production and thus, some varieties are naturally low-cyanide, while others are inherently high-cyanide. The wide range of cyanide concentrations observed in the current study, from very low to high levels, affirms the importance of screening cassava germplasm for cyanide content, as different varieties can pose varying levels of risk for consumption (Hahn and Keyser, 1985; Akiyama et al., 2006). This variability is further exemplified by studies such as Diallo et al., (2014), who reported varying levels of cyanide in different parts of Senegalese cassava cultivars, with some varieties exhibiting high toxicity levels in the roots.
Researchers have used different methods for cyanide analysis such as titration, spectrophotometer and picrate paper and this could have led to the different results obtained. The correlation between cyanide concentration measurements obtained through the picrate paper test (color chart) and spectrophotometry varied across different cassava plant parts. In both leaves and peels, a moderate positive correlation was observed; r = 0.547 and r = 0.570, respectively. This suggests a discernible, though not strong, linear relationship between the two methods. While increases in color chart readings tended to correspond with increases in spectrophotometer readings, the moderate correlation indicates some variability and suggests that the two methods are related but not perfectly interchangeable for these tissues. This implies that while the picrate test can provide a general indication of cyanide levels in leaves and peels, it might not be as precise as spectrophotometry.
However, in the pulp, a very strong positive correlation (r = 0.936) (Table 4) was found between the two methods. This near-perfect correlation suggests a high degree of consistency between the color chart readings and spectrophotometer readings for pulp samples. The strong relationship implies that the picrate paper method can serve as a reliable proxy for spectrophotometry when measuring cyanide concentrations in cassava pulp, especially in resource-limited settings where spectrophotometers may not be readily available. The differing correlations across tissues might be due to variations in the distribution of cyanogenic glycosides and the influence of other compounds present in the different plant parts that could interfere with the colorimetric reaction.
However, it’s crucial to acknowledge that the picrate paper method, while useful for screening, might not be as precise as spectrophotometry. The discrepancies between methods are reflected in the current study’s data, where absolute cyanide values obtained from the two methods varied. This difference in precision was also noted by Azucena-Topor et al., (2008), who used spectrophotometry to validate color chart readings.
Cyanide concentration levels in cassava samples collected from farmers in Migori County, Kenya
The observed variation in cyanide concentration among cassava accessions in Migori County reflects a similar pattern noted in earlier studies on cassava characterization using cyanide levels. For instance, a study by McMahon et al., (1995) noted that cyanide content varies significantly across cassava genotypes, environmental conditions, and processing methods. High cyanide concentrations, such as the 30 mg/L CN– recorded in accessions like Waite Nyabasi – 002 (Accs. 206) and Dar-salaam – 001 (Accs. 214) (Table 5) align with findings by Cardoso et al., (2005), who reported elevated levels in bitter cassava accessions that are traditionally used for industrial purposes or in regions with low rainfall. These high levels suggest that certain cassava accessions in Migori may require additional detoxification steps before consumption to ensure food safety.
Conversely, the low concentrations (1–3 mg/L CN–) recorded in varieties such as Rateng black (Accs. 218), Roteng (Accs. 219) and Kanyamwa (Accs. 232) (Table 5) reflect traits typically associated with sweet cassava accessions, which are safer for direct human consumption. These findings are consistent with the results of a study by Burns et al., (2012), which showed that sweet cassava varieties often have cyanide levels below 10 mg/L CN–, posing minimal risk to consumers. The study also highlights the importance of considering cyanide concentrations in peels, which were consistently higher in certain accessions. This observation corroborates findings by Amelework et al., (2021), who emphasized that cassava peels contain higher cyanogenic glycosides than tuberous flesh, suggesting the need for proper disposal or processing of peels to prevent accidental poisoning by either livestock or humans.
Therefore, the use of the picrate paper method in this field study demonstrated its practicality for on-farm cyanide analysis. This method has been widely acknowledged for its simplicity, cost-effectiveness, and suitability for resource-limited settings (Egan et al., 1998). It enables farmers and researchers to obtain rapid and semi-quantitative results without requiring sophisticated laboratory equipment. However, while effective for screening purposes, the picrate paper method may lack the precision and sensitivity of laboratory-based techniques such as spectrophotometry or gas chromatography. However, the method is susceptible to environmental factors, such as humidity and temperature and these can influence the stability of picrate papers and the accuracy of colour readings (Bradbury et al., 1999). Additionally, the semi-quantitative nature of the method may not detect low cyanide levels accurately, potentially underestimating the risk in sweet varieties. Despite these limitations, its ease of use and accessibility make it a valuable tool for preliminary assessments of cyanide content in cassava on farms, particularly in rural areas where laboratory facilities are unavailable.
Despite the toxicity risks, farmers continue cultivating high-cyanide cassava varieties due to their unique properties and cultural significance. Communities have developed several processing methods to reduce cyanide levels in leaves, peels and pulp. These methods include sun drying, fermentation and cooking (Akintonwa et al., 1994; Diallo et al., 2014; Ndubuisi and Chidiebere et al., 2018). Fermentation, a common traditional processing method, not only detoxifies cassava (Tumwesigye et al., 2014), but also enhances the texture and taste of flour used in preparing ugali or mealy and porridge. In contrast, improved cassava varieties such as ‘Agriculture’ contain low cyanide levels and require no fermentation. However, these improved varieties are often reported to produce tasteless porridge and ugali, reducing their preference among local consumers.
In Migori County, cassava tubers (pulp) with high cyanide content are frequently fermented for the production of local brews such as “busaa” among the Luo community and “busara” among the Kuria. This practice highlights the cultural and economic significance of high-cyanide cassava varieties beyond direct consumption, further explaining their continued cultivation.
Cassava leaves
Fresh cassava leaves are important vegetables and are cooked fresh. Of interest in this study was the Wild cassavas-001 (Acc. 026) and wild cassava (Acc. 029) (Table 1). These are perennial plants and are commonly believed to be of high cyanide concentrations in the leaves and in the roots. In this study these plants had low cyanide contents in the leaves that is below the WHO maximum recommended threshold. The leaves are characteristically large (Figure 2) as compared to the common varieties grown such as and relatively low cyanide levels in the foliage, making it a potential vegetable crop. When compared to other accessions, Wild cassava-001 exhibits the highest high biomass production, followed by Kasukali (Acc.015) with medium-sized leaves and Selele-002 (Acc. (024) with the smallest leaves (Figure 2). Given their perennial growth habits, low cyanide concentration in the leaves, large leaf surface area, and in inference high yield as compared to all the other accessions, Wild cassava-001 and Wild cassava-002 (Table 1) could be promoted for cultivation as a vegetable crop. This would contribute to food security and dietary diversity.
Cassava tubers (peeled or unpeeled)
Traders in Migori and Kisii counties prefer to buy unpeeled cassava chips. This gives them higher biomass than the peeled chips (Figure 3). The outer skin and fibrous layers account for a considerable portion of the tuber’s total mass, which is lost when cassava is peeled. This weight reduction directly affects the market value and potential revenue farmers can earn from selling their produce. Consequently, most farmers prefer selling unpeeled cassava tubers to maximize their income, as buyers often purchase based on weight and or volume. The unpeeled cassava chips also reduce peeling labour cost to the farmers.

Figure 2: From left to right: Leaves of Wild cassava-001, Kasukali and Selele-002 cassava varieties
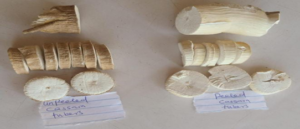
Figure 3: Peeled and unpeeled cassava tubers
When cassava is peeled (Figure 3), not only does it lose mass, but it also becomes more perishable, limiting the duration within which it can be stored or transported before spoilage sets in. In contrast, unpeeled cassava has a longer shelf life due to the protective outer layer, making it more convenient for transportation and storage. To the consumer, the unpeeled cassava chips contain more fibre in the flour which is beneficial for food digestion. The wholistic nature of this study is that we are able to select cassava varieties with low cyanide concentrations in the peel and in the pulp. Examples of such varieties are Nyatanga -002 (Accs. 036), Agriculture -012 (Accs. 067), Mtwapa -009 (Accs. 089) and Adhiambo lera (Accs. 090) (Table 1).
Conclusions
Cassava varieties exhibit significant differences in cyanide concentration across leaves, peels, and pulp, influenced by genetic variations and enzymatic activity in the cyanogenesis pathway. Varieties like Nyatanga and Nyarkadera with high cyanide levels pose potential health risks if not adequately processed, highlighting the importance of detoxification methods to ensure safety.
The cyanide concentration in cassava varieties generally increased from the outer tissues (peels) to the inner tissues (pulp). Both spectrophotometric and picrate paper test methods confirmed this trend, with the pulp showing higher cyanide levels than the peels. Variations among cassava accessions emphasize the need for careful variety selection to reduce cyanide exposure.
Despite the risks, farmers continue to grow high-cyanide cassava varieties due to desirable traits like taste, texture, and suitability for specific products (e.g., local brews).
Wild cassava varieties generally displayed moderate cyanide levels, likely linked to their genetic adaptations. It shows potential as a vegetable crop due to its low cyanide levels in the foliage and high biomass production make it a promising option for improving food security and dietary diversity.
The observed variability in cyanide levels across different cassava accessions affirms the importance of characterizing varieties based on cyanogenic potential to guide breeding programs and consumer recommendations.
Unpeeled cassava has advantages for farmers since it maintains higher biomass (and therefore market value), has a longer shelf life, and reduces labour costs associated with peeling.
The correlation coefficient (r) measures the strength and direction of linear relationships between variables. Moderate positive correlations (r=0.547 and r=0.570) in leaves and peels suggested noticeable but not strong consistency between cyanide measurements from the colour chart and spectrophotometer. In pulps, a strong positive correlation (r=0.936) indicated high consistency, supporting the colour chart as a reliable spectrophotometer proxy.
Recommendations
Farmers should prioritize cultivating low-cyanide cassava varieties such as Mbale-001 and Agriculture-012 to minimize health risks. High-cyanide varieties like Nyatanga and Nyarkadera require proper detoxification through fermentation, drying, soaking, and thorough cooking to ensure safety.
Exploring wild cassava as a vegetable crop and for breeding low-cyanide varieties can enhance food security. Additionally, farmers should balance market demands by optimizing sales between peeled and unpeeled cassava.
Researchers and breeders should focus on characterizing and breeding low-cyanide cassava varieties while leveraging wild cassava for genetic improvement. Standardizing cyanide analysis, particularly using the picrate paper method, is essential for consistency, as it shows a strong correlation in pulp analysis (r=0.936).
Consumers should choose low-cyanide cassava varieties whenever possible and always process cassava properly to eliminate any cyanide risks. Proper cooking and detoxification methods should be followed regardless of cyanide content. Raising awareness about the risks associated with improper cassava consumption will empower consumers to make informed decisions about their food choices.
Governments should establish and enforce clear cyanide level regulations in cassava and cassava-based products to protect public health. Investments in research on cassava breeding, processing, and cyanide detection are crucial for food safety. Additionally, public education and awareness campaigns should be launched to inform farmers and consumers about the importance of proper cassava handling and processing.
Acknowledgement: This study was supported by funds from the University of Eldoret Annual Research Grant (Cohort 8). The authors also thank all the farmers from the surveyed farms where the field study was conducted, as well as Mr. Yudah Oyieyo for his guidance and valuable support in laboratory work.
Conflict of Interest: “The author(s) declare(s) that there is no conflict of interest.”
References
- Aalbersberg, W. G. L. & Limalevu, L. (1991). Cyanide content in fresh and processed Fijian cassava (Manihot esculenta Crantz) cultivars. Tropical Science 31: 249 – 256.
- Akintonwa, A., Tunwashe, O. & Onifade, A. (1994). Fatal and non-fatal acute poisoning attributed to cassava–based meal. ActaHorticulturae 375: 285-288.
- Akiyama, H., Toida, T., Sakai, S., Amakura, Y., Kondo, K., Sugita- Kunushi, Y. & Maitani, T. (2006). Determination of cyanide and thiocyanate in Sugihiratake mushroom using HPLC method with fluometric detection. Journal of Health Sciences 52: 73-77.
- Alitubeera, P. H., Eyu, P., Kwesiga, B., Ario, A. R. & Zhu, B. (2019). Outbreak of Cyanide Poisoning Caused by Consumption of Cassava Flour, Kasese District, Uganda, September 2017. MMWR Morb Mortal Wkly Rep; 68: 308–311. DOI: http://dx.doi.org/10.15585/mmwr.mm6813a3.
- Amelework, B., Bairu, M.W., Maema, O., Venter, S.L. & Laing, M. (2021). Adoption and promotion of resilient crops for climate risk mitigation and import substitution: A case analysis of cassava for South African agriculture. Front. Sustain. Food Syst; 5:617783. doi: 10.3389/fsufs.2021.617783.
- Azucena-Topor, V., Michelle, R. C. Fuentebella, Bacolod, H. J. & Armada-Araneta, L. (2008). Cyanide content of the roots and leaves of cassava (Manihot esculenta Crantz) from selected sources in Iloilo. UPV J. Nat. Sci. 13: 25-34 (2008).
- Bradbury, M.G., Egan, S.V. and Bradbury, J.H. (1999). Picrate paper kits for determination of Total cyanogens in cassava roots and all forms of cyanogens in cassava products. Sci. Food Agric; 79, 593–601.
- Burns, A., Gleadow, R., Cliff, J., Zacarias, A. and Cavagnaro, T. (2010). Cassava: the drought, war and famine crop in a changing world. Sustainability, 2:3572–607. https://doi.org/10.3390/su2113572.
- Burns, A. E., Gleadow, R. M., Zacarias, A. M., Cuambe, C. E., Miller, R. E. & Cavagnaro, T. R. (2012). Variations in the chemical composition of cassava: Implications for food safety and processing. Food Chemistry, 133(1), 170–180. https://doi.org/10.1016/j.foodchem.2012.01.033.
- Cardoso, A. P., Mirione, E., Ernesto, M., Massaza, F., Cliff, J., Haque, M. R. & Bradbury, J. H. (2005). Processing of cassava roots to remove cyanogens. Journal of Food Composition and Analysis 18: 451–460.
- Cliff, J., Muquingue, H., Nhassico, D., Nzwalo, H. & Bradbury, J. H. (2011). Konzo and continuing cyanide intoxication from cassava in Mozambique. Food Chem Toxicol. 49:631–5. https://doi.org/10.1016/j.fct.2010.06.056.
- Diallo, Y., Gueye, M. T., Ndiaye, C., Sakho, M., Kane, A., Barthelemy, J. P. & Lognay, G. (2014). A New Method for the Determination of Cyanide Ions and Their Quantification in Some Senegalese Cassava Varieties. American Journal of Analytical Chemistry, 5, 181-187, (http://www.scirp.org/journal/ajac) http://dx.doi.org/10.4236/ajac.2014.53022.
- Egan, S. V., Yeoh, H. H. & Bradbury, J. H. (1998). Simple picrate paper kit for determination of the cyanogenic potential of cassava flour. Journal of the Science of Food and Agriculture, 76(1), 39–48. https://doi.org/10.1002/(SICI)1097-0010(199801)76:1<39:AID-JSFA915>3.0.CO;2-0.
- Ernesto, C., Cardoso, A. P. & Cliff, J. (2000). Konzo and cyanide toxicity. Food and Chemical Toxicology, 38(7), 651-655.
- FAO/WHO (1991). Joint FAO/WHO Food Standards Programme Codex Alimentarius Commission XII. Supplement 4, FAO, Rome,
- (2023). FAOSTAT. Food Balance Sheet. https://www.fao.org/statistics/en/Google Scholar.
- Fekadu, M. & Abedelfeta, M. (2017). Determination of Cyanide Concentration Levels in Different Cassava Varieties in Selected Iodine Deficiency Disordered (IDD) Areas of Wolaita Zone, Southern Ethiopia. Journal of Natural Sciences Research, Vol.7, No.3. ISSN 2224-3186 (Paper) ISSN 2225-0921 (Online), iiste.org.
- Hahn, S. K. & Keyser, J. (1985). Cassava: a basic food of Africa. Outlook on Agriculture, 4: 95-100.
- Harenčár, Ľ., Ražná, K. & Nôžková, J. (2021). Cyanogenic glycosides – their role and potential in plant food resources. Journal of Microbiology, Biotechnology and Food Sciences. 11: e4771. [DOI: 10.15414/JMBFS.4771].
- Hawashi, M., Sitania, C., Caesy, C., Aparamarta, H.W., Widjaja, T. & Gunawan, S. (2019). Kinetic data of extraction of cyanide during the soaking process of cassava leaves. Data in Brief. 25: 104279. [DOI: 10.1016/j.dib.2019.104279].
- Kwok, J. (2008). Cyanide poisoning and cassava. Centre for Food Safety. URL: https://www.cfs.gov.hk/english/multimedia/ multimedia_pub/multimedia_pub_fsf_29_02.html.
- Lambebo, T. & Deme, T. (2022). Evaluation of nutritional potential and effect of processing on improving nutrient content of cassava (Manihot esculenta Crantz) roots and leaves. BioRxiv, 1–39. https:// doi. org/ 10. 1101/ 2022. 02. 04. 479097.
- Mbinda, W. & Mukami, A. (2022). Breeding for postharvest physio-logical deterioration in cassava: Problems and strategies. CABI Agriculture and Bioscience, 3(1), 1–18. https:// doi. org/ 10. 1186/ s4317 0-022-00097-4.
- McMahon, J. M., White, W. L. B. & Sayre, R. T. (1995). Cyanogenesis in cassava (Manihot esculenta Crantz). Journal of Experimental Botany 46: 731-714.
- Moriasi, G. A., Olela, B. O., Waiganjo, B. W., Wakori, E. W. T. & Onyancha, J. M. (2017). Evaluation of Cyanide Levels in Two Cassava Varieties (Mariwa and Nyakatanegi) Grown in Bar-agulu, Siaya County, Kenya. Journal of Food and Nutrition Research, 5, No. 11, 817-823 Available online at http://pubs.sciepub.com/jfnr/5/11/4 ©Science and Education Publishing DOI:10.12691/jfnr-5-11-4.
- Mosayyebi, B., Imani, M., Mohammadi, L., Akbarzadeh, A., Zarghami, N., Edalati, M., Alizadeh, E. & Rahmati, M. (2020). An update on the toxicity of cyanogenic glycosides bioactive compounds: possible clinical application in targeted cancer therapy. Materials Chemistry and Physics. 246: 122841. [DOI: 10.1016/j. matchemphys. 2020.122841].
- Nambisan, B. & Sundaresan, S. (1994). Distribution of Linamarin and its Metabolising enzymesin cassava tissues. Sci Food Agric 66:503–507 (1994). https://doi.org/10.1002/jsfa.2740660413.
- Ndubuisi, N.D. & Chidiebere, A.C.U. (2018). Cyanide in cassava: a review. International Journal of Genomics and Data Mining. 02: 118. [DOI: 10.29011/2577-0616.000118].
- Nyamekye, C.A. (2021). Health issues related to the production and consumption of cassava as a staple food. Master’s thesis, Norwegian University of Life Sciences, As. URL: https://nmbu.brage.unit.no/nmbu-xmlui/bitstream/handle/ 11250/2771129/ NYAMEKYE2021. pdf?sequence=1.
- Nyamwamu, N. C., Jeruto, P., Njenga, E., Arama, P. F. & Mulwa, R. M. (2023). Phenotypic characterization of cassava (Manihot esculenta Crantz) germplasm in Kenya. ASRIC Journal on Agricultural Sciences Vol.4 (1); 152-162.Available online at asric.org.
- Nyirenda, K. K. (2021). Toxicity potential of cyanogenic glycosides in edible plants. In: Erkekoglu, P., Ogawa, T. (Editors). Medical toxicology. IntechOpen, London, United Kingdom. [DOI: 10.5772/intechopen.91408].
- Onwuka, G. I. (2005). Food analysis and instrumentation: theory and practice. Naphathali prints, Nigeria, 95-96.
- Ospina, M.A., Tran, T., Pizarro, M., Luna, J., Salazar, S., Londoño, L., Ceballos, H., Becerra, Lopez-Lavalle, L.A. & Dufour, D. (2024). Content and distribution of cyanogenic compounds in cassava roots and leaves in association with physiological age. Journal ofthe Science of Food and Agriculture. 104: 4851-4859. [DOI: 10.1002/jsfa.13123].
- Rezaul, M., Haque, J. & Bradbury, H. (2002). Total cyanide determination of plants and foods using the picrate and acid hydrolysis methods. Analytical, Nutritional and Clinical Methods Section; Elsevier, Food Chemistry 77 (2002) 107–114.
- Selmar, D. (1994). Transport of cyanogenic glycosides: uptake of linustatin by Hevea Planta 191: 191-199.
- Tumwesigye, S. K. (2014). Three decades of toxic cyanide management in Uganda. Doing and communicating more with minimal strategies. Has it been possible? Cassava Cyanide Diseases and Neurolathyrism Network, 24:4–9. http://ipbo.vib-ugent.be/wp-content/uploads/2015/02/ CCDN-News-24-December-2014.pdf.
- Udeme, N., Okafor, P. & Eleazu, C. (2017). Evaluation of the distribution of cyanide in the peels, pulps and leaves of three new yellow cassava (Manihot esculenta Crantz) varieties for potential livestock feeds. Progress in Nutrition, Vol. 19, Supplement 1: 137-141 DOI: 10.23751/pn.v19i1-S.5500.
- (2016). Cyanide and its compounds. International Programme on Chemical Safety.
- WHO, (2011). Toxicological evaluation of certain food additives and naturally occurring toxicants. WHO Food Additive Series: 30. World Health Organization, Geneva.