ISSN: 2641-6816
Frequency: Continuous
Format: PDF and HTML
Versions: Online (Open Access)
Year first Published: 2018
Language: English
| Journal Menu |
| Editorial Board |
| Reviewer Board |
| Articles |
| Open Access |
| Special Issue Proposals |
| Guidelines for Authors |
| Guidelines for Editors |
| Guidelines for Reviewers |
| Membership |
| Fee and Guidelines |
 |
Chemical Fingerprinting of Commercially Available Saffron: High-Performance Thin Layer Chromatography
Shreya V Patel, Avinash M Topè*, Leigh Whittinghill
Kentucky State University, 400 E Main Street, Frankfort, Kentucky 40601, USA
Received Date: October 10, 2020; Accepted date: October 27, 2020; Published Date: November 05, 2020;
*Corresponding Author: Avinash M Topè, Kentucky State University, 400 E Main Street, Frankfort, Kentucky 40601, USA; Tel: 5025976012. Email: avinash.tope@kysu.edu
Citation: Patel SV, Topè AM, Whittinghill L (2020) Chemical Fingerprinting of Commercially Available Saffron: High-Performance Thin Layer Chromatography. Adv in Nutri and Food Sci: ANAFS-200.
Abstract
Saffron (Crocus sativa L.), is a high-value medicinal and culinary plant and the most expensive spice in the world. Due to its low per kilogram yield, fastidious cultivation and post-harvest requirements, and very high economic value, saffron is subject to adulteration to enhance its color and flavor. Spectrophotometric and chromatographic techniques have been tested to separate and identify the composition of saffron. Few studies have reported use of high-performance thin-layer chromatography (HPTLC) for qualitative and quantitative analysis of saffron and its major compounds safranal, picrocrocin and crocin. The objective of this short communication is to establish a comprehensive fingerprint profile of saffron samples cultivated across the using HPTLC. Ethanolic extracts of commercially available saffron samples of were spotted on pre-coated silica gel HPTLC plates and developed using a 2-propanol, ethyl acetate, water (13:5:2 v/v/v) solvent system and scanned at 254 nm and 310 nm. Peaks and Rf values were obtained using CAMAG vision CATS software (CAMAG, Switzerland). The HPTLC fingerprints for each of the nine samples were recorded and are presented. Studies using HPTLC to quantify safranal, picrocrocin and crocin in these samples are ongoing.
Keywords: Chromatography; Crocus sativa l; Fingerprinting; HPTLC; Saffron
Introduction
Saffron, a spice derived from Crocus sativus L., is an expensive spice that is usually grown in regions with cold winters, warm summers, and low humidity. The largest exporters of saffron are Spain (45.9%), Afghanistan (17.9%), Hong Kong (5.2%), Morocco (0.8%) and India (0.7%) (1). According to Tridge, the current global export value of saffron in is $119 million [1]. The price of one kilogram of saffron is $3,500 to $160,000, making it one of the most expensive spices. Its price is determined based on the origin, purity, and cultivar.
The dried stigma of C. sativus L. has been in use for its medicinal and culinary properties since 2300 BC. The dried stigma are orange-red filaments harvested from the saffron flower. The spice contains various compounds such as riboflavin, thiamine, magnesium, calcium, iron, manganese, copper, zinc, reducing sugar, starch, flavonoids and protein [2, 3]. There is scientific evidence to support its antidepressant, aphrodisiac, cardiotonic, carminative, anti-inflammatory, hepatoprotective, hypnotic, labor-inducing/emmenagogue, and bronchodilation properties [4, 5]. It is being studied for its potential use in preventing progression of cancer and anticancer toxicity and has gained therapeutic interest due to its radical scavenging, anti-mutagenic, and immuno-modulating effects [3, 6]. Thachil et al (2007) reported that saffron had equivalent therapeutic effects on mild to moderate depression to imipramine and fluoxetine [5]. Saffron’s antioxidant and inhibitory effects of lipid peroxidation in human platelets were confirmed by Chatterjee et al (2005) [7].
Saffron has an intense natural yellow color, bittersweet taste, and a powerful aroma. Saffron filaments are used as a seasoning and flavoring agent in several regional food preparations. The intense yellow color is due to degraded carotenoid compounds, crocin and crocetin, while the glucoside picrocrocin contributes to the bitter taste of saffron [3, 8]. Safranal a monoterpene aldehyde formed by de-glycosylation of picrocrocin, is widely studied in pharmacology and cosmetology [2, 8]. It constitutes approximately 70% of the volatile constituents in saffron.
Safranal, crocin, and picrocrocin are considered three important constituents in quality control evaluations of saffron. Their density and ratios vary depending on agricultural and environmental conditions, such as soil, humidity, temperature, rainfall, harvesting, handling and drying practices, and storage time. This density and ratio are considered the primary factors in determining the price of saffron [3].
While planting saffron bulbs is relatively simple, harvesting is labor intensive as the blossoms are too delicate to be harvested mechanically. Each flower of C. sativus L. has 3 stigma that weigh approximately 2 mg each. Thus, about 150,000 flowers are needed to yield 1 kg of saffron stigma. Growing high-quality saffron for commercial use is a challenging, labor-intensive and expensive process in North America, making United States as one of the major importers of saffron. Due to its medicinal value, expensive costs, market value and limited availability, the potential for deliberate adulteration of saffron is high [8,9].
For quality assurance purposes, levels of the constituents in saffron are determined using spectrophotometric procedures proposed by ISO3632 [3]. Although the procedure is inexpensive and fast, safranal is reported to be overestimated because the amount of picrocrocin and safranal are affected by amounts of crocin. This is due to the absorption of crocins (440 nm) and picrocrocins (254 nm) at maximum wavelength [3].
Recent advances in thin layer chromatography (TLC), specifically the development of HPTLC, have made it a more attractive method for the quantification of herbal constituents. Analysis of several botanical and medicinal plants have been conducted using HPTLC [10, 11, 12]. A few advantages of HPTLC include the ability to analyze crude samples containing multiple components. Several samples can be simultaneously separated in parallel on the same plate, thus saving time and providing a rapid, reproducible, precise, low-cost analysis. When tested for stability, two-dimensional (2D) separation can be performed easily using HPTLC. Identification of compounds having different light absorption characteristics or colors can be performed consequently and/or combined with different modes of evaluation [10, 11, 12]. One of the major advantages of the use of HPTLC for separation analysis is that the stationary phase is solid, and results can be evaluated by machine as well as visually because slow-moving fractions on the planar layer are represented as sharp peaks. Specific and sensitive color stains, such as Kedde reagent and sulphuric acid solutions, can also be used to detect separate spots derivatized on the plate. Thus, a comprehensive chromatographic fingerprint can be established using HPTLC.
To date, few studies have been reported on analyses evaluating the quality of saffron from different geographical regions, especially using HPTLC [8, 13]. A study conducted to evaluate the authenticity of saffron demonstrated that crocin and other constituents of saffron could be visualized by the methanol extract method [14, 15]. Another study developed a method for quantitative analysis of picrocrocin and crocetin with HPTLC [16].
The objective of this short communication is to establish a comprehensive fingerprint profile of saffron samples cultivated across the globe using HPTLC.
Materials and Methods
Plant material and saffron samples: Nine commercially available saffron samples originating from five countries were obtained (Table 1).
Sample Code
Sample Origin
Number of Peaks at 254 nm
Number of Peaks at 310 nm
1
Spain
10
9
2
Kashmir Valley
10
9
3
Afghanistan
10
10
4
Afghanistan
6
8
5
Kashmir
10
9
6
Morocco
9
10
7
Afghanistan
8
9
8
Spain
9
8
9
Iran
9
11
Sample extraction: Approximately 10 mg of saffron was extracted using 10 ml of 80% ethanol (AR grade, Sigma-Aldrich, St. Louis, MO). The mixture was homogenized and sonicated in the dark for 15 minutes. The mixture was then centrifuged, and the supernatant was stored in a 2-ml auto-sampler vial.
High-performance thin-layer chromatography:
Chromatography was performed using 2 µl of each of the 9saffron extracts on Merck glass plates pre-coated with silica gel 60 F254 plates (20 x 20 cm, 10 x10 cm; CAMAG Scientific Inc., Wilmington, NC), using mobile phase composed of 2-propanol, ethyl acetate, and water (13:5:2 v/v/v). The CAMAG HPTLC ATS 4 system, TLC scanner 4, and visionCATS software (CAMAG, Switzerland) were used for the HPTLC analysis. The plates were scanned using a deuterium lamp at 254 nm and 310 nm.
Development of solvent system:
Solvent system: Two solvent systems, n-hexane, ethyl acetate (9:1 v/v) and 2-propanol, ethyl acetate, and water (13:2:1 v/v/v), were used to separate constituents of the ethanol extract of saffron. In our study, 2-propanol, ethyl acetate, and water (13:2:1 v/v/v) yielded the best resolution of the saffron fingerprint on the TLC plates.
Scanning and detection of spots: The developed and air-dried chromatograph plates were scanned at 254 and 310 nm using an ultraviolet cabinet with dual wavelengths (254 and 310 nm).. Scanning was performed by the CAMAG HPTLC Densitometer.
Results
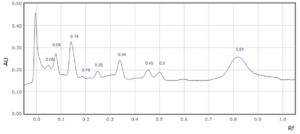
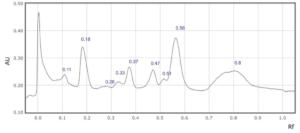
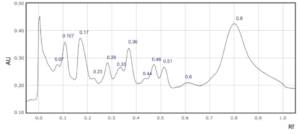
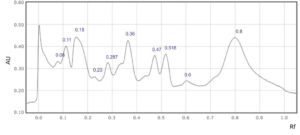
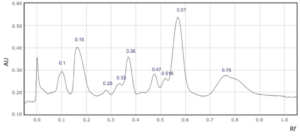
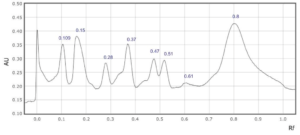
In four saffron extracts (samples 1, 2, 3 and 5), ten peaks were observed at 254 nm (Table 2). At 310 nm, ten peaks were observed in three samples (samples 1, 3, and 6, Table 1). Eleven peaks were observed in the saffron extract from Iran (sample 9) at 310 nm (Supplementary Figures 1-9). At 254 nm, one saffron extract from Afghanistan (sample 4) resolved in 6 peaks whereas the other two extracts from the same country of origin (samples 3 and 7) resolved in 10 and 8 peaks, respectively (Table 2, Supplementary Figure 3, 4 and 7). The saffron extracts from Afghanistan also displayed different numbers of peaks at 310 nm (Table 3).
 (a)
(a)
(b)
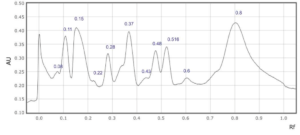
Supplementary Figure 1: Rf values for each peak observed at a) 254 nm and b) 310 nm in sample 1.

(a)
 (b)
(b)
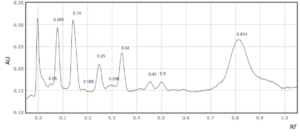
Supplementary Figure 2: Rf values for each peak observed at a) 254 nm and b) 310 nm in sample 2.
 (a)
(a)
(b)
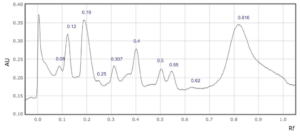
Supplementary Figure 3: Rf values for each peak observed at a) 254 nm and b) 310 nm in sample 3

(a)

(b)
Supplementary Figure 4: Rf values for each peak observed at a) 254 nm and b) 310 nm in sample 4.

(a)
 (b)
(b)
Supplementary Figure 5: Rf values for each peak observed at a) 254 nm and b) 310 nm in sample 5.

(a)
(b)
Supplementary Figure 6: Rf values for each peak observed at a) 254 nm and b) 310 nm in sample 6.
(a)

(b)
Supplementary Figure 7: Rf values for each peak observed at a) 254 nm and b) 310 nm in sample 7.
 (a)
(a)
(b)
Supplementary Figure 8: Rf values for each peak observed at a) 254 nm and b) 310 nm in sample 8.

(a)
(b)
Supplementary Figure 9: Rf values for each peak observed at a) 254 nm and b) 310 nm in sample 9.
Sample code
Rf values
1
0.05
0.08
0.13
0.25
0.29
0.34
0.45
0.5
0.55
0.83
2
0.05
0.08
0.14
0.25
0.29
0.34
0.45
0.5
0.55
0.82
3
0.09
0.12
0.19
0.28
0.31
0.35
0.4
0.5
0.58
0.83
4
0.11
0.17
0.34
0.47
0.57
0.81
5
0.07
0.11
0.18
0.28
0.39
0.48
0.46
0.51
0.6
0.8
6
0.11
0.17
0.28
0.39
0.36
0.47
0.51
0.75
7
0.08
0.11
0.15
0.23
0.28
0.36
0.47
0.51
0.6
0.8
8
0.1
0.16
0.28
0.33
0.36
0.48
0.51
0.58
0.75
9
0.1
0.16
0.28
0.33
0.36
0.48
0.51
0.58
0.75
Sample code
Rf values
1
0.05
0.08
0.14
0.19
0.25
0.34
0.45
0.5
0.81
2
0.05
0.085
0.14
0.19
0.25
0.3
0.34
0.45
0.81
3
0.08
0.12
0.19
0.25
0.3
0.4
0.5
0.55
0.62
0.81
4
0.08
0.11
0.29
0.37
0.48
0.52
0.6
0.8
5
0.11
0.18
0.28
0.33
0.37
0.47
0.51
0.56
0.8
6
0.07
0.1
0.17
0.23
0.28
0.33
0.46
0.51
0.6
0.8
7
0.08
0.15
0.26
0.33
0.36
0.47
0.51
0.57
0.75
8
0.1
0.15
0.28
0.37
0.47
0.51
0.61
0.8
9
0.08
0.11
0.15
0.22
0.28
0.37
0.43
0.48
0.51
0.6
0.8
Distinct bands were spotted at Rf 0.12, 0.24, 0.32, 0.46-0.5, and 0.8. The bands that appear faint in Sample 2 (Kashmir Valley) were captured in the image produced using the TLC scanner at 254 nm and 310 nm wavelengths. More separate and distinct bands were detected in sample 1 (Spain) compared to sample 2 (Figure 1).
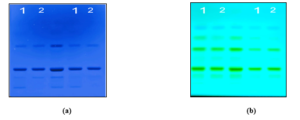
Figure 1: Fingerprints of saffron samples 1 -2 using HPTLC scanned at a) 254 nm and b) 310 nm using CAMAG TLC Scanner 4.
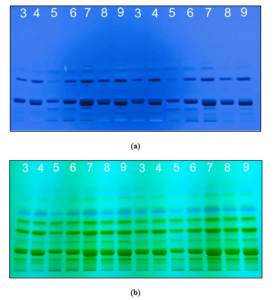
Figure 2: Fingerprints of saffron samples 3- 9 using HPTLC scanned at a) 254 nm and b) 310 nm using CAMAG TLC Scanner 4.
Comparing the chromatographs of all samples recorded at 310 nm (Figure 1 and 2), samples 1, 2, 3, 4, 5, and 8 displayed light or extremely faint bands in the Rf range 0.6 to 0.82. Sample 5 display a lighter band compared to other samples in the Rf range 0.2-0.36 at 254 nm and 310 nm.
Conclusion
HPTLC fingerprint analysis
Due to its pharmacological significance and culinary uses as well as high market value, saffron is frequently subjected to adulteration. This research communication presents preliminary results on fingerprint analysis of ethanolic extracts of saffron produced from different countries as listed in (Table 1). These preliminary results demonstrate the potential application of HPTLC technique to determine the composition of saffron extracts. Results from few other studies aimed at quantifying safranal, picrocrocin, and crocin using HPTLC have indicated a higher response of safranal and better linearity between peak areas at 310 nm while the preferred wavelength for identification and separation of picrocrocin and crocin is at 254 nm [2]. For the current study, we report fingerprints of 9 saffron samples obtained from different countries using HPTLC while scanning at 254 nm and 310 nm. Additional studies will be conducted to identify and quantify the active ingredients such as crocin, picrocrocin, and safranal in these samples using reference standards. Several publications report qualitative and quantitative analysis of saffron using spectrophotometric and high-pressure liquid chromatography (HPLC) [2, 3, 8, 13]; however, to the best of our knowledge, this is the first study reporting chemical fingerprinting of saffron samples from major exporting countries using HPTLC. These studies also include performing intra- and inter-day replication and quantification using reference standards for crocin, picrocrocin, and safranal.
Acknowledgements
This work is supported by 1890 Institution Teaching, Research and Extension Capacity Building Grant (CBG) Program Grant # 2019-38821-29115; Accession #1018229 from the USDA National Institute of Food and Agriculture. The authors would also like to thank Dr. Christina McManus for helping in revision of the manuscript.
References
- Saffron Market Trends, Prices, and Suppliers. (n.d.). Tridge.
- Pathan SA, Alam S, Jain GK, Zaidi SMA, Akhter S et al. (2010) Quantitative analysis of safranal in saffron extract and nanoparticle formulation by a validated high-performance thin-layer chromatographic method. Phytochemical Analysis 21:219-223.
- Kabiri M, Rezadoost H, and Ghassempour A (2017) A comparative quality study of saffron constituents through HPLC and HPTLC methods followed by isolation of crocins and picrocrocin. Lebensmittel-Wissenschaft & Technologie 84:1-9.
- Gohari AR, Saeidnia S, Mahmoodabadi MK (2013) An overview on saffron, phytochemicals, and medicinal properties. Pharmacognosy Reviews 7:61-66.
- Thachil AF, Mohan R, Bhugra D (2007) The evidence base of complementary and alternative therapies in depression. Journal of Affective Disorders 97:23-35.
- Bhandari PR (2015) Crocus sativus L. (saffron) for cancer chemoprevention: A mini review. Journal of Traditional and Complementary Medicine 5:81-87.
- Chatterjee S, Poduval TB, Tilak JC, Devasagayam TPA (2005) A modified, economic, sensitive method for measuring total antioxidant capacities of human plasma and natural compounds using Indian saffron (Crocus sativus). Clinica Chimica Acta 352:155-163.
- Mangal AK, Tewari D, Shantha TR, Bansal S, Mangal, M (2018) Pharmacognostical standardization and HPTLC fingerprinting analysis of Crocus sativus L. Indian Journal of Traditional Knowledge 17:592-597.
- Decker F (2019) How to Grow Saffron for Profit. Small Business Chronicle.com.
- Sherma J, Rabel F (2019) Thin layer chromatography in the analysis of cannabis and its components and synthetic cannabinoids. Journal of Liquid Chromatography & Related Technologies 42:613-628.
- Badyal PN, Sharma C, Kaur N, Shankar R, Pandey A et al. (2015) Analytical techniques in simultaneous estimation: An overview. Austin Journal of Analysis and Pharmaceutical Chemistry 2:1037.
- Shivatare R, Nagore D, Nipanikar S (2013) “HPTLC” an important tool in standardization of herbal medical product: A review. Journal of Scientific and Innovative Research 2:1086-1096.
- Caballero-Ortega H, Pereda-Miranda R, Riverón-Negrete L, Hernández JM, Medécigo-Ríos M et al. (2004) Chemical composition of saffron (Crocus sativus L.) from four countries. Acta Horticulture 650:321-326.
- Bakre SM, Krishnamurthy R, Shinde BM (2000) Study of genunity of saffron samples – A case study. Journal of Scientific and Industrial Research 59:596-598.
- Merck Index (Merck & Co. Inc. Rahway, NJ, US (1968) 8th edn, 294-295.
- Corti P, Mazzei E, Ferri S, Franchi GG, Dreassi E (1996) High performance thin layer chromatographic quantitative analysis of picrocrocin and crocetin, active principles of saffron (Crocus sativus L.-Iridaceae): A new method. Phytochemical Analysis 7:201-203.
