| Journal Menu |
| Editorial Board |
| Reviewer Board |
| Articles |
| Open Access |
| Special Issue Proposals |
| Guidelines for Authors |
| Guidelines for Editors |
| Guidelines for Reviewers |
| Membership |
| Fee and Guidelines |
 |
Calotropis gigentea Mediated Cr2O3 Nanoparticles Synthesis and Application in Removal of Microbial and Endocrine Disrupting Chemicals
Yaseen Ayub1, Rabia Nazir2*, Muhammad Ibrar3, Muhammad Arsalan3, Raza Shah4, Qaisar Ahmad5, Muhammad Shabbir Shakir6
1Govt. Islamia College, Civil Lines Lahore-54000, Pakistan
2Pakistan Council of Scientific and Industrial Research Laboratories Complex, Ferozepur Road, Lahore-54600, Pakistan
3Lahore Garrison University, Sector C DHA Phase 6, Lahore, Pakistan
4University of Karachi, Karachi-75270, Pakistan
5University of Engineering, Lahore
6Government College University, Faisalabad, Pakistan
Received Date: April 13, 2021; Accepted Date: April 22, 2021; Published Date: April 30, 2021;
*Corresponding Author: Pakistan Council of Scientific and Industrial Research Laboratories Complex, Ferozepur Road, Lahore-54600, Pakistan. Email: rabiapcsir@yahoo.com
Citation: Ayub Y, Nazir R, Ibrar M, Arsalan M, Shah R et al. (2021) Calotropis Gigentea Mediated Cr2o3 Nanoparticles Synthesis And Application In Removal Of Microbial And Endocrine Disrupting Chemicals. Enviro Sci Poll Res And Mang: ESPRM-110
DOI: 10.37722/ESPRAM.2021101
Abstract
Plant mediated Cr2O3 (GCO) nanoparticles (85.72nm) were synthesized at room temperature using ethanolic leaves’ extract of Calotropis gigentea. The nanoparticles obtained were characterized using FTIR, SEM/ EDX, AFM and powder XRD to get insight into morphology, particle size and phase. The synthesized GCO were checked for their efficacy towards the removal of Endocrine Disrupting Chemicals (EDC i.e. an azo dye, pyrethroid insecticide, phthalate) and pathogenic bacteria (Staphylococcus aureus). The results showed high adsorption capacities (296.11, 87.92 and 231.3 mg g-1) for the three contaminants i.e. Direct Yellow 24, Bifenthrin and Dioctyl phthalate, respectively in just 15-20min at room temperature. GCO also showed good bacteriostatic activity and is able to remove 80.9% of the microbes in simulated water samples. Hence, it can be safely concluded that the prepared GCO is a good material for effective treatment of multi-natured organic contaminants as well as microbes without requiring any stringent experimental conditions.
Keywords: Adsorption Models; Endocrine Disrupting Chemicals; Kinetic Models; Microbes; Plant Mediated Synthesis; Water Treatment
Introduction
Provision of clean and quality water to carry out the necessary human needs is the major issue faced globally and posing major challenges to water treatment technologies. Validity of conventional water treatment technologies in removing trace contaminants by use of energy effective and less hazardous chemicals has always remained questionable. Recent advances hence focus on exploitation of nanomaterials’ size dependent properties to overcome the demerits of water treatment technologies (Mauter et al. 2018; Qu et al. 2013) and use these materials to develop next-generation water supply systems to treat surface, rivers, canal, ocean, groundwater and industrial wastewater contaminated by toxic metal ions, radionuclide’s, organic and inorganic solutes, pesticides, bacteria and viruses (Mauter et al. 2018; Savage and Diallo 2005). Metal oxide nanoparticles (NPs) having high reduction efficacy makes them suitable material for wastewater treatment application. Chromium oxides, having broad industrial applications, exists in various forms and among these Cr2O3 is stable one (Khojier et al. 2013) which shows superior properties due to large band gap (~3.4 eV) and p-type semiconducting character (Kohli et al. 2012). These properties enable semiconducting metal oxide NPs to have better catalytic degradation potential for organic pollutants as well as enhanced antibacterial, antifungal and related biological activities (Hakim et al. 2009; Helan et al. 2016). Several methods have been designed for the synthesis of Cr2O3 NPs (Yu et al. 2018) i.e. bio-synthesis (Khalil et al. 2017), sol-gel (Balouria et al. 2012; El-Sheikh et al. 2009; Kawabata et al. 1995), combustion (Lima et al. 2006), hydrothermal (Pei et al. 2009), chemical vapor deposition (Chevalier et al. 2000), thermal decomposition (Li et al. 2006) or either by use of EDTA as a chelating agent (Aghaie-Khafri and Lafdani 2012). Among these methods green synthesis has acquired particular attention due to its inherent advantages such as eco-friendly and nontoxic nature, cost effectiveness, simplicity, and easy recoverability (Ramesh et al. 2012). Henceforth, the current research is aimed towards synthesis of Cr2O3 NPs through plant mediated synthesis using ethanolic plant extracts of Calotropis gigentea leaves and utilizing these prepared NPs for the effective treatment of multiple contaminants i.e. microbial and endocrine disrupting chemicals.
Experimental Details
CrCl3.6H2O and Ethanol were procured from BDH Laboratory Supplies Poole, BH15 LTD, England, while Direct Yellow 24 dye was obtained from local industry. The leaves of C. gigentea were collected from the suburbs of city. pH of solutions was adjusted with 0.1 N solutions of hydrochloric acid (Sigma-Aldrich) and sodium hydroxide (Sigma-Aldrich). Technical grade Bifenthrin (91%) was provided by local pesticide manufacturing company with established traceability to Bifenthrin (99%) certified reference material provided by VWR.
Synthesis of Chromium Oxide Nanoparticles
Preparation of Ethanolic Plant Extract
C. gigentea plant leaves were washed several times with tap water followed by distilled water wash to remove dust particles. Afterwards, leaves were dried under shade and hand crushed. The extract was prepared by dipping 300 g of these leaves in 3L ethanol. The mixture was left in closed jar for 2 days at room temperature with occasional shaking. The extract was filtered using Whatman No.1 filter paper and the filtrate was kept in refrigerator at 4⁰C till further use.
Synthesis of Chromium oxide (Cr2O3) NPs
0.5M ethanolic solution of CrCl3.6H2O (100ml) was added in ethanolic plant extract (900ml) of C. gigentea and the contents were sonicated at room temperature for 24h. The UV/Vis spectrum was scanned for the wavelength range of 200 to 800nm at different time intervals ranging from 0-24h by withdrawing 4.5ml sample every time to confirm the formation of nanoparticles. After completion of reaction ethanol extract was rotary evaporated at 70⁰C until a thick viscous material is attained followed by its sintering at 600⁰C for 5h to result in light green powder which was characterized by using different techniques. The flow sheet for the synthesis of GCO is given in Figure 1.
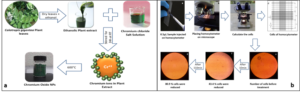
Figure 1: (a) Flow sheet for the ultrasonic assisted green synthesis of GCO NPs and (b) Bacterial cell calculation protocol and reduction in cells with contact time Characterization
GCO NPs were characterized for their surface morphological, physical and chemical properties by UV-Visible Spectroscopy [DB-20S], Fourier-Transform Infrared Spectroscopy (FT-IR) [Tensor-27], Energy Dispersive X-ray Spectroscopy (EDX), scanning electron microscopy (SEM) [S3700N, Hitachi, Japan], atomic force microscopy [AFM 5500 Agilent, USA] and X-ray Diffraction (XRD) analysis [PANalytical] using standard procedures.
Catalytic activity of GCO nanoparticles
Catalytic activity of the prepared GCO nanoparticles was assessed using three potential endocrine disrupting chemicals (ECD) i.e. Azo dye (Direct Yellow 24, DY), Phthalate (Dioctyl phthalate, DOP) and pyrethroid insecticide (Bifenthrin, BF) by employing batch experiments. The adsorption efficacy was measured using Eq. 1:
![]()
Where, Cf is the concentration of adsorbate adsorbed that is calculated by subtracting initial concentration of the adsorbate (Ci, mg L-1) from the final concentration of adsorbate (Cf, mg L-1) at time, t (min) while V represents the volume of solution and W is weight of the adsorbent.
Preparation of stock and working solutions
DY: 1000 mg L-1 stock solution was prepared in distilled water.
BF: 100 mg L-1 was prepared by solubilizing the technical grade bifenthrin in 5ml acetone and making up the volume with distilled water.
DOP: 1000 mg L-1 was prepared by solubilizing the DOP in 5ml acetone and making up the volume with distilled water.
The respective working solutions are prepared by dilutions of the stock solutions.
Direct Yellow 24 Dye (DY)
Catalytic activity of the GCO NPs was determined by using DY as test contaminant. DY (100 -800 mg L-1) with the appropriate amount of catalyst (0.01 – 0.15g) was allowed to remain in contact for different time intervals (2 – 60 min) at variable temperatures (40 – 80ºC) in order to achieve maximum adsorption of DY onto nano-adsorbent surface. After desired contact time is achieved, the contents of reaction flask were Cannula filtered. The progress of reaction is subsequently followed at different time intervals using UV–Visible spectrophotometer (λmax = 380nm) which clearly showed the gradual decrease in intensity of yellow color to almost colorless solution.
Three different variables i.e. contact time (min), temperature (K) and concentration of DY (mg L-1) were selected to study their effect on the removal of dyes from binary system. Each of the factors was optimized by employing graphs whose maxima were taken as the optimized values for corresponding factors.
Bifenthrin (BF)
Considering the harmful effects of pyrethroid insecticides even at very minute levels, the efficacy of GCO towards the removal of these pesticides was also studied using BF as test contaminant. For the purpose working solution of BF (10-200 mg L‑1) was allowed to remain in contact with GCO (0.1g) at room temperature for different timings (2 – 80 min) and the resulting contents were Cannula filtered.
BF in filtrate was extracted using liquid-liquid extraction. For the purpose filtrate was transferred to separating funnel followed by addition of 1ml of 10% NaCl to enhance the extraction efficacy. n-Hexane was used as extracting solvent and extraction was performed thrice with 10 ml × 1 and 5 ml × 2. n-Hexane layer was transferred to rotary receiving flask by passing it through a layer of anhydrous sodium sulphate. The volume was reduced to approx. 1ml and re-constituted to 5ml using anhydrous sodium sulphate treated n-hexane. The working standards were also extracted by same method and analyzed using GC-ECD (Varian CP-3800) equipped with DB-5 column with 0.1µm internal dia and 30m length. The injector and detector temperature were set at 250ºC. The oven temperature ramping was set as follows: Initial temperature 100°C held for 2min; ramp to 200 @ 50°C/min held for 2 min; ramp to 230°C @ 5°C/min held for 2 min; ramp to 250°C @ 50°C/min held for 5 min.
Dioctyl phthalate (DOP)
To check GCO efficacy towards removal of phthalates, DOP working solution (100-400 mg L‑1) was allowed to remain in contact with GCO (0.1g) at room temperature for different timings (2-50 min) and the resulting contents were Cannula filtered. Liquid-Liquid extraction was performed to determine DOP concentration in filtrate. Dichloromethane was used as extracting solvent and extraction was performed thrice with 10 ml × 1 and 5 ml × 2 (Kanchanamayoon et al. 2012). The solvent layer was transferred to rotary receiving flask by passing it through a layer of anhydrous sodium sulphate and evaporated to dryness at 40ºC. The volume was re-constituted to 5ml using sodium sulphate treated n-hexane. The extracted samples and standards were analyzed using GC-FID (Agilent 7890B) with ALS equipped with HP-5 column with 0.25µm internal dia and 30m length. The injector and detector temperature were set at 300ºC. The oven temperature ramping was set as follows: Initial temperature 150°C held for 5min then ramp to 280 @ 20°C/min held for 5 min. The adsorbed percentage was calculated from the GC data by using Eq. 2 and Eq. 1.
![]()
Where Ct and Cstd are the concentrations of BF in the treated sample after time t, min and standard, As and Astd are the peak areas of BF in treated and standard samples as obtained from GC chromatogram, and Vs. and Vstd are the injected volumes of treated sample and standard solution which in this case is kept constant (1µL).
To the adsorption data obtained from experimental studies various adsorption, kinetic and thermodynamic models were applied (Table 1S).
Antimicrobial activity GCO nanoparticles
C. aureus was investigated by examining the growth curves of bacterial cells in liquid medium amended with green synthesized GCO. 2ml S. aureus bacterial agar was added in 2L autoclaved distilled water and the colony count was allowed to increase by keeping the spiked water in incubator for 24h. After that spiked water sample was kept in refrigerator at 4⁰C for further use. 50ml of this spiked water sample was allowed to remain in contact with 0.1h GCO at room temperature for different time intervals (i.e. 10, 20, 30, 40, 50, 60 and 70 min). The contents were then Cannula filtered and filtrate was kept at 4⁰C in refrigerator before cell calculation.
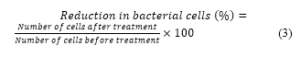
For purpose of cell calculation 0.5µL of stain was injected on homocytometer, stained with Safranin and Crystal Violet followed by loading on microscope for cell counting. The reduction in bacterial cells was calculated as percentage (%) reduction of cells (Eq. 3) by comparing each sample with untreated water sample. The % reduction of cell was calculated by following equation.
The flow sheet showing protocol of bacterial cell count after contact with GCO and the cell reduction observed at various contact times is presented in Figure 1b.
Results and Discussion
Synthesis of GCO
The ethanolic extract of plant leaves of C. gigentea was employed in essence to exploit its prospective as potential bio-factory for the synthesis of GCO NPs. C. gigentea leaves extract have rich source of active organic compounds such as proteins, aminoacids, glycosides, flavonoids etc. Therefore, naturally occurring plant metabolites have favorable effect for NPs synthesis by acting as good reducing as well as capping /chelating agents (Sharma et al. 2015; Venigalla 2009). During the course of reaction, reduction of Cr (III) ions to Cr (0) ions takes place as evidenced via UV-vis spectra of the plant extract (Figure 2) which clearly shows the decrease in CrCl3 peak recorded at 664 cm-1 (Chhonkar 1984). Earlier studies have shown that in green synthesis the reduction and conversion of Cr (III) ions to zero-valent NPs is assisted by formation of Cr(III) chelated complexes with plant phytochemicals which can be easily decomposed at temperatures ≤ 400ºC leading to formation of metal oxide NPs (Sharma et al. 2015).

Figure 2. UV-Visible spectra showing decrease in CrCl3 peak (664cm-1) during the course of synthesis of Cr2O3 NPs
Characterization of GCO
FT-IR Spectroscopy
The FT-IR spectra of ethanolic extract of plant leaves of C. gigentea is presented in Figure 3a which depicts typical spectra showing broad peak at 3500cm-1 of ethanol hydroxyl group, small peak of C-H stretching at 2900cm-1 attributed to chlorophyll groups, C=O at 1645cm-1 due carbonyl containing compounds, peaks at 1400-1300cm-1 owing to bending vibrations of C-H, C-O-C bands at 1085-1016cm-1 and several peaks between 876-609 cm-1 because of various aromatic moieties present in the plant extract (Ezhilarasi et al. 2018). The bonding state of Cr and O in the dried powder was checked with help of FTIR spectroscopy (Figure 3b). The small but broad peak at 3321.90 cm-1 appears due to O-H groups that would have been caused due to moisture and 1637.01 cm-1 carbon dioxide adsorbed on the sample from the atmosphere (Jaswal et al. 2014). The peaks at 950.56 cm-1 and 670 cm-1 may be due to the stretching vibration of Cr-O-Cr and Cr-O (Rakesh et al. 2013).
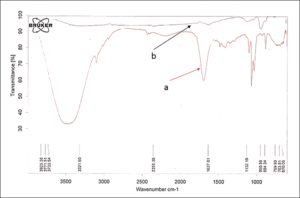
Figure 3: FT-IR spectra of a) ethanolic extract of plant leaves of C. gigentea and b) Cr2O3 NPs.
SEM/EDX and AFM analysis
To get insight into the morphology, particle size and compositional analysis SEM/EDX and AFM analysis were performed. SEM image (Figure 4a) illustrates the porous nature of material having agglomerated particles. EDX analysis (Figure 4b) confirms the formation of Cr2O3 NPs having experimental percentage by weight of chromium and oxygen i.e. 65.96% and 25.08%, respectively which is in close match with the theoretical yield of chromium (68.42%) and oxygen (31.58%) as shown in Figure 4b inset. Impurities (carbon, sodium, magnesium, and potassium) are also observed in the sample prepared which might be due to their presence in leaves of C. gigantea. Chloride ion presence is due to CrCl3 used as raw material while aluminum usually comes from the grouch crucible used for sintering.
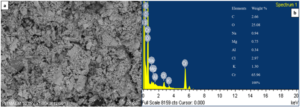 Figure 4. a) SEM image and b) EDX spectra of Cr2O3 NPs showing morphology and elemental composition, respectively.
AFM images presented in Figure 5 a&b clearly evidence the agglomeration/ cluster formation of the particles resulting in increase in average particle size i.e. 292 µm and broad particle size range (Figure 5c).
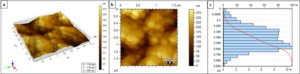
Figure 5. AFM images of Cr2O3 NPs a) 3D, b) 2D and c) histogram showing particle size distribution
Powder XRD
The crystalline structure of green synthesized GCO NPs was investigated by X-ray diffraction. XRD spectrum (Figure 6) was recorded from 20 to 60° 2θ angles and showed best match with standard reference pattern of Cr2O3 (96-901-6610) having Eskolaite phase confirming formation of single-phase material. The particle size as calculated by Debye Scherer Equation comes out to be 85.72nm.
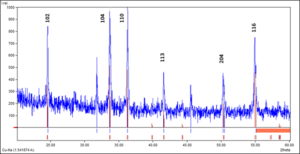
Figure 6. Powder XRD spectra of green synthesized chromium oxide nanoparticles (blue) along with matching with reference pattern (red lines).
Catalytic activity chromium oxide nanoparticles
The catalytic activity of prepared GCO towards multiple contaminants i.e. dye (DY), pesticide (BF) and phthalate (DOP) was checked by carrying out adsorption at varying experimental parameters like contact time (t, min), temperature (T, K) and initial dye concentration (Ci, mg L-1) to determine the maximum adsorption conditions. The temperature studies were not performed in case of BF and DOP, considering the fact that high temperatures result in their degradation to other compounds and the sole impact of adsorbent will not be depicted in true sense.
Effect of contact time and kinetics model
Room temperature studies were carried out to study the effect of contact time between adsorbent (0.1g) and adsorbates (DY, BF and DOP) on adsorption by varying time (Figure 7A). The incremental increase in adsorption capacity is observed in all the three cases as time increases with maxima lying at 20min (43.0mg g-1) for DY, 15min (4.94 mg L-1) for BF and 15min (80.53 mg L-1) for DOP. Therefore, rest of the experiments were performed at these respective contact times. Earlier studies carried out by use of Cr2O3 based nano-adsorbents required longer time (120min) for removal of dye from the system and with much lower adsorption capacities (1.99 to 35.47mg g-1) (Ibrahim 2019).
Adsorption data was also analyzed using pseudo-first and second-order kinetic models (non-linear and linear) (Table 1S, Figure 7A&B); the parameters obtained after fitting (Figure 7) are tabulated in (Table 1) which showed the best fit model (decided on based of higher R2, small SD and lower χ2– value) to be second-order kinetic model in both linear and non-linear forms for all the three cases. This indicates that the rate limiting step for adsorption of all the three EDC onto GCO is chemisorption involving valence forces attributed to sharing/ exchange of electrons between the two systems, coordination or complexation (Febrianto et al. 2009; Zhang et al. 2019). To further get insight into the rate limiting step diffusion models were also applied to the adsorption data obtained (Table 1, Figure 7). The application of intra-particle diffusion model fitting (Figure 8A) to the data obtained for DY adsorption onto GCO results in two straight lines. Such fit points to different sorption phenomena occurring during the course of adsorption. Similar observation was recorded in cases of BF and DOP (Figure 8A). The line of plot qt vs t0.5 (Figure 8A) when studied for full adsorption range showed non-linear dependence with line not passing through origin indicating the main rate-limiting step to be boundary layer diffusion controlled instead (Ali et al. 2019; Ciopec et al. 2014) based on particle diffusion (Figure 8B) rather than pore diffusion as depicted by high R2 value (Table 1). Figure 7. A) Removal of EDC (DY, BF and DOP) by GCO as a function of time and application of pseudo-first and pseudo-second order kinetic models in non-linear (NL) and B) linear (L) forms, respectively.
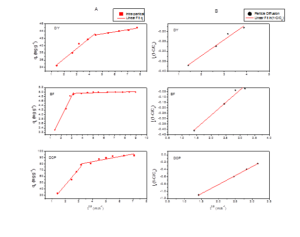
Figure 8. Application of A) intra-particle and B) particle diffusion models to adsorption of EDC (DY, BF and DOP) onto GCO.
| Model | Parameter | Value (DY) | Value (BF) | Value (DOP) |
| qe,cal (mg g-1) | 43.0 | 4.9 | 80.53 | |
| Pseudo-first order
(linear) |
qe,exp (mg g-1) | 12.3 | 5.7 | 91.666 |
| k1NL (min-1) | 0.151 | 0.472 | 0.171 | |
| Radj2 | 0.9738 | 0.8801 | 0.9693 | |
| SD | 0.059 | 0.252 | 3.476 | |
| Reduced χ2 | 0.003 | 0.064 | 12.085 | |
| Pseudo-second order
(linear) |
qe,exp (mg g-1) | 43.36 | 5.64 | 104.36 |
| k2NL (min-1) | 3.31×10⁻² | 0.114 | 0.002 | |
| Radj2 | 0.9978 | 0.9905 | 0.9743 | |
| SD | 0.006 | 0.0591 | 3.178 | |
| Reduced-χ2 | 3.51×10⁻⁵ | 0.003 | 10.098 | |
| Pseudo-first order
(Non-linear) |
qe,exp (mg g-1) | 42.55 | 4.952 | 142.23 |
| k1NL (min-1) | 0.815 | 0.498 | 0.364 | |
| Radj2 | 0.5597 | 0.9032 | 0.7202 | |
| SD | 2.281 | 0.151 | 0.316 | |
| Reduced χ2 | 5.201 | 0.911 | 0.100 | |
| Pseudo-second order
(Non-linear) |
qe,exp (mg g-1) | 44.212 | 5.167 | 117.65 |
| k2NL (min-1) | 0.034 | 0.191 | 1.48×10⁻³ | |
| Radj2 | 0.8669 | 0.9282 | 0.9051 | |
| SD | 1.253 | 0.130 | 0.009 | |
| Reduced-χ2 | 1.572 | 0.017 | 8.55×10⁻⁵ | |
| Particle diffusion | kp (mg g-1min-1) | 0.48 | 0.531 | -1.56 |
| Radj2 | 0.9705 | 0.9808 | 0.8866 | |
| Intra-particle diffusion | kid1 (mg g-1 min-0.5) | 0.8292 | 1.820 | 25.466 |
| Ci1 (mg g-1) | 1.489 | 1.037 | 4.295 | |
| R12 | 34.6316 | 0.9928 | 0.9755 | |
| kid2 (mg g-1 min-0.5) | 0.9169 | 0.021 | 4.067 | |
| Ci2 (mg g-1) | 0.725 | 4.848 | 67.241 | |
| R22 | 39.359 | 0.7609 | 0.8311 |
Table 1 Pseudo-first order (Linear, Non-linear), pseudo-second order (Linear, Non-linear), particle diffusion and intra-particle diffusion parameters for DY, BF and DOP adsorption on GCO along with goodness of fit parameters.
Effect of temperature and thermodynamic models
Adsorption experiments conducted at variable temperatures ranging from 25-70°C points to maximum adsorption of DY by GCO at 25°C (RT) in 20 min as obvious from Figure 9. The decrease in adsorption of the dye by nano-adsorbent (2g/L) from 25°C to 70°C points to exothermic nature of the process. Thermodynamic models (Table 1S, Table 2) were applied for calculating ΔHº, ΔSº, ΔGº, Ea and S* from fitting parameters. The values of these tabulated in Table 2 revealed about the adsorption process being spontaneous (-ΔGº) and exothermic (+ΔHº) with disorderness (+ΔSº) prevailing around GCO surface (Al-Degs et al. 2008; Almeida et al. 2009).
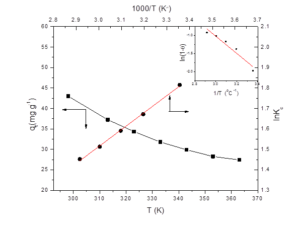
Figure 9. Plot showing effect of temperature on adsorption capacity of GCO (n), plot of lnKC vs T-1 (l) and plot of ln(1-θ) vs T-1 (inset).
| T
(K) |
ΔGº
kJ mol-1 |
ΔHº
kJ mol-1 |
ΔSº
kJ mol-1 |
Ea
kJ mol-1 |
S*
kJ mol-1 |
| 303 | -4.497 | 26.67 | 0.075 | -19.769 | 0.006 |
| 313 | -2.789 | ||||
| 323 | -2.111 | ||||
| 333 | -1.540 | ||||
| 343 | -1.131 |
Table 2. Activation and thermodynamic parameters’ values for adsorption of DY onto GCO.
Effect of adsorbate concentration and adsorption isotherms
For determination of optimal amount of adsorbate that can be removed effectively, catalytic degradation was checked out with various concentrations of DY (100 to 700mg L-1), BF (10-200mg L-1) and DOP (100-400mg L-1) at 25oC and neutral pH with 0.1g nano-adsorbent. For all the three cases, incremental increase in qt (mg g-1) with escalating concentration was observed till it achieves the equilibrium at 600, 150 and 300 mg L-1 for DY, BF and DOP, respectively (Figure 10). The application of three adsorption isotherms (Langmuir, Freundlich and Liu) on experimental points were done and it was clear from fitting parameters (Table 1S, Table 3) that the best fit model is Liu for DY as well as BF and DOP having highest R2, lowest reduced χ2 and smallest SD values. The qm as obtained from the fitting comes out to be for DY, BF and DOP as 296.11, 87.92 and 231.82 mg g-1, respectively.
 Figure 10. a) DY, b) BF and c) DOP removal as a function of concentration and application of adsorption models i.e. Langmuir, Freundlich and Liu.
Model
Parameter
Value (DY)
Value (BF)
Value (DOP)
qe,exp (mg g-1)
200.4
56.93
177.96
Langmuir
KL (L g-1)
0.0017
0.005
0.003
qm (mg g-1)
475.951
131.129
360.819
Radj2
0.9885
0.9930
0.9647
SD (mg g-1)
6.565
1.818
8.085
Reduced χ2
43.101
3.306
65.361
Freundlich
KF (mg g-1 (mg L-1)-1/nF)
2.111
1.709
6.054
nF
1.410
1.441
1.702
Radj2
0.9715
0.9746
0.9346
SD (mg g-1)
10.348
3.475
11.008
Reduced χ2
107.081
12.073
121.922
Liu
qm (mg g-1)
296.111
87.92
231.281
Kg (L mg-1)
0.0027
0.010
0.007
nL
1.403
1.357
1.736
Radj2
0.9954
0.9987
0.9816
SD (mg g-1)
4.140
0.772
5.838
Reduced χ2
17.142
0.595
34.091
Table 3. Langmuir, Freundlich and Liu adsorption models constant as applied to DY, BF and DOP adsorption on GCO.
Antimicrobial activity
The antimicrobial potential of GCO NPs was checked using S. aureus as test contaminant. The nanoparticles were found quite effective in disinfecting water as depicted in Figure11. The appreciable % reduction of cell was observed with increase in contact time from 10min to 110min which is 43% to 80.9%. Earlier studies have also shown antimicrobial activity of the chemically synthesized chromium oxide nanoparticles against E. coli, and P. aeruginosa (Raza et al. 2016).
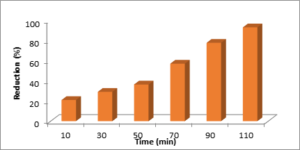
Figure 11. Percentage reduction of cell for S. aureus by using Cr2O3 NPs.
Conclusion
Simple and room temperature synthesis of single phased Cr2O3 nanoparticles was achieved by using Calotropis gigentea ethanolic leaves extract. The prepared NPs were exploited as potential material for water treatment applications to remove multiple natured contaminants which occur in water simultaneously and earlier required various multifold treatments for their effective removal. The adsorption studies conducted without involving any stringent experimental parameters resulted in considerable high removal rates for all the contaminants i.e. direct yellow 24 dye, bifenthrin, dioctyl phthalate and S. aureus microbes. The maximum adsorption occurs in just 15-20min at room temperature making the prepared NPs a good material for effective and multiple contaminants removal from polluted water.
References
- Aghaie-Khafri M, Lafdani MK (2012) A novel method to synthesize Cr2O3 nanopowders using EDTA as a chelating agent Powder Technnol 222:152-159.
- Al-Degs YS, El-Barghouthi MI, El-Sheikh AH, Walker GM (2008) Effect of solution pH, ionic strength, and temperature on adsorption behavior of reactive dyes on activated carbon Dyes Pigments 77:16-23.
- Ali I, Alharbi OML, Alothman ZA, Al-Mohaimeed AM, Alwarthan A (2019) Modeling of fenuron pesticide adsorption on CNTs for mechanistic insight and removal in water Environ Res 170:389-397.
- Almeida C, Debacher N, Downs A, Cottet L, Mello C (2009) Removal of methylene blue from colored effluents by adsorption on montmorillonite clay J Colloid Interface Sci 332:46-53.
- Balouria V, Singh A, Debnath A, Mahajan A, Bedi R et al. (2012) Synthesis and characterization of sol-gel derived Cr2O3 In: AIP Conf. Proc 1447:341-342.
- Chevalier S, Bonnet G, Larpin J (2000) Metal-organic chemical vapor deposition of Cr2O3 and Nd2O3 Oxide growth kinetics and characterization Appl Surf Sci 167:125-133.
- Chhonkar N (1984) Studies on the absorption spectra of Cr3+ ion in CrCl3 in different organic solvents Zeitschrift für Physikalische Chemie 265:113-126.
- Ciopec M, Negrea A, Lupa L, Davidescu C, Negrea P (2014) Studies regarding As (V) adsorption from underground water by Fe-XAD8-DEHPA impregnated resin. Equilibrium sorption and fixed-bed column tests Molecules 19:16082-16101.
- El-Sheikh S, Mohamed R, Fouad O (2009) Synthesis and structure screening of nanostructured chromium oxide powders J Alloys Compd 482:302-307.
- Ezhilarasi AA, Vijaya JJ, Kaviyarasu K, Kennedy LJ, Ramalingam RJ et al. (2018) Green synthesis of NiO nanoparticles using Aegle marmelos leaf extract for the evaluation of in-vitro cytotoxicity, antibacterial and photocatalytic properties J Photochem Photobiol B 180:39-50.
- Febrianto J, Kosasih AN, Sunarso J, Ju Y-H, Indraswati N et al. (2009) Equilibrium and kinetic studies in adsorption of heavy metals using biosorbent: A summary of recent studies J Hazard Mater 162:616-645.
- Hakim A, Hossain J, Khan K (2009) Temperature effect on the electrical properties of undoped NiO thin films Renew Energ 34:2625-2629.
- Helan V et al. (2016) Neem leaves mediated preparation of NiO nanoparticles and its magnetization, coercivity and antibacterial analysis Results Phys 6:712-718.
- Ibrahim MM (2019) Cr2O3/Al2O3 as adsorbent: Physicochemical properties and adsorption behaviors towards removal of Congo red dye from water J Environ Chem Eng 7:102848.
- Jaswal VS, Arora AK, Singh J, Kinger M, Gupta VD (2014) Synthesis and characterization of chromium oxide nanoparticles Orient J Chem 30:559-566.
- Kanchanamayoon W, Prapatpong P, Chumwangwapee S, Chaithongrat S (2012) Analysis of phthalate esters contamination in drinking water samples Afr J Biotechnol 11:16263-16269.
- Kawabata A, Yoshinaka M, Hirota K, Yamaguchi O (1995) Hot isostatic pressing and characterization of sol‐gel‐derived chromium (III) oxide J Am Ceram Soc 78:2271-2273.
- Khalil AT, Ovais M, Ullah I, Ali M, Shinwari ZK et al. (2017) Physical properties, biological applications and biocompatibility studies on biosynthesized single phase cobalt oxide (Co3O4) nanoparticles via Sageretia thea (Osbeck.) Arab J Chem 13:606-619.
- Khojier K, Savaloni H, Ashkabusi Z, Dehnavi N (2013) Structural, mechanical and tribological characterization of chromium oxide thin films prepared by post-annealing of Cr thin films Appl Surf Sci 284:489-496.
- Kohli N, Singh O, Anand K, Singh RC (2012) Effect of reaction temperature on crystallite size and sensing response of chromium oxide nanoparticles Mater Res Bull 47:2072-2076.
- Li L, Yan ZF, Lu GQ, Zhu ZH (2006) Synthesis and structure characterization of chromium oxide prepared by solid thermal decomposition reaction J Phys Chem B 110:178-183.
- Lima M, Bonadimann R, de Andrade M, Toniolo J, Bergmann C (2006) Nanocrystalline Cr2O3 and amorphous CrO3 produced by solution combustion synthesis J Eur Ceram Soc 26:1213-1220.
- Mauter MS, Zucker I, Perreault F, Werber JR, Kim J-H et al. (2018) The role of nanotechnology in tackling global water challenges Nat Sustain 1:166-175.
- Pei Z, Xu H, Zhang Y (2009) Preparation of Cr2O3 nanoparticles via C2H5OH hydrothermal reduction J Alloys Compd 468:L5-L8.
- Qu X, Alvarez PJ, Li Q (2013) Applications of nanotechnology in water and wastewater treatment Water Res 47:3931-3946.
- Rakesh S, Ananda S, Gowda N (2013) Synthesis of chromium (III) oxide nanoparticles by electrochemical method and Mukia maderaspatana plant extract, characterization, KMnO4 decomposition and antibacterial study Mod Res Catal 2:127-135.
- Ramesh C, Mohan Kumar K, Latha N, Ragunathan V (2012) Green synthesis of Cr2O3 nanoparticles using Tridax procumbens leaf extract and its antibacterial activity on Escherichia coli Curr Nanosci 8:603-607.
- Raza MA, Kanwal Z, Riaz S, Naseem S (2016) Antibacterial performance of chromium nanoparticles against Escherichia coli, and Pseudomonas aeruginosa. In: Proceedings of the World Congress on Advances in Civil, Environmental and Materials Research (ACEM’16), Jeju Island, Korea.
- Savage N, Diallo MS (2005) Nanomaterials and water purification: Ppportunities and challenges J Nanoparticle Res 7:331-342.
- Sharma JK, Akhtar MS, Ameen S, Srivastava P, Singh G (2015) Green synthesis of CuO nanoparticles with leaf extract of Calotropis gigantea and its dye-sensitized solar cells applications J Alloys Compd 632:321-325.
- Venigalla M (2009) Phytochemical screening of leaf extracts of Calotropis gigantea Linn Advances in Pharmacology and Toxicology
- Yu S et al. (2018) Cleaner production of spherical nanostructure chromium oxide (Cr2O3) via a facile combination membrane and hydrothermal approach J Clean Prod 176:636-644.
- Zhang M, Yang J, Geng X, Li Y, Zha Z et al. (2019) Magnetic adsorbent based on mesoporous silica nanoparticles for magnetic solid phase extraction of pyrethroid pesticides in water samples J Chromatogr A 1598:20-29.
