Publication Information
Frequency: Continuous
Format: PDF and HTML
Versions: Online (Open Access)
Year first Published: 2019
Language: English
| Journal Menu |
| Editorial Board |
| Reviewer Board |
| Articles |
| Open Access |
| Special Issue Proposals |
| Guidelines for Authors |
| Guidelines for Editors |
| Guidelines for Reviewers |
| Membership |
| Fee and Guidelines |
 |
Business Potential and Feasibility of Successive Crop Farming on Dry Land in Madiun Indonesia
S Rahayu, L S Budi1*, I R Puspitawati, M P Nurwantara|
Departement Agrotechnology of Agriculture Faculty, Merdeka Madiun University, Madiun, INA
Received Date: January 20, 2022; Accepted Date: January 28, 2022; Published Date: February 03, 2022;
*Corresponding author: L S Budi, Departement Agrotechnology of Agriculture Faculty, Merdeka Madiun University, Madiun, INA. Email: luluksb@unmer-madiun.ac.id
Citation: Budi L S, Rahayu S, Puspitawati I R, Nurwantara M P (2022) Business Potential and Feasibility of Successive Crop Farming on Dry Land in Madiun Indonesia. Adv Agri Horti and Ento: AAHE-166.
DOI: 10.37722/AAHAE.2022101
Abstract
Proper dry land management can increase efficiency and productivity, this will have an impact on technical and economic improvements. One of the efforts that can be done is to manage successive crop models. The purpose of the study was to determine the business opportunities and financial feasibility of dry land management with the successive crop model. The research was conducted in March 2021 – August 2021 in Madiun, East Java. The study used primary data and secondary data. Primary data collection was carried out by surveys and expert discussions, secondary data using literature studies and literature reviews. This study uses a technical approach and financial analysis methods. The results of the study showed that the successive crop business opportunity has good prospects if managed properly. Good management of successive crop models is obtained through proper selection of commodities and management of successive plantings. The financial feasibility of continuous crop mode cultivation with corn, peanut, cucumber cropping patterns has a B/C ratio value of 2.26, corn, chili, peanut, cucumber patterns have a B/C ratio value of 2.67. The conclusion is that the cultivation of successive crop models provides good business opportunities for the use of dry land in Indonesia.
Keywords: Business opportunity; Crop model; Dry land; Financial feasibility
Introduction
Food is a commodity that is needed by every resident who lives in a place, every presence of the population can certainly add to the food that must be prepared (Budi, 2007). Without food, there will be no energy coming out of the human body. Foodstuff development can be carried out on wet land or dry land with food crops combined with horticultural crops and or other plants. The availability of land until almost every country has decreased due to conversion, it is very necessary to increase the productivity of the available land area by applying the perfect intensification model. Foodstuff development must continue throughout the year as long as growth factors are available in sufficient condition. The reality is that in times of uncertain climatic conditions, a lot of land management, especially dry land, often produces materials that are not optimal in other words low productivity. The most appropriate strategy in land management is through a pattern of intensification of cropping models, one of which is the successive cropping model. The successive cropping pattern model has advantages, in addition to efficiency in management, saving time and increasing the yield per unit area or being economically feasible and more profitable (Rahayu 2011). The successive planting model is an important factor in implementing the successive planting model, namely the type of selection, determining the right planting time and maintenance. The choice of doing in the successive cropping model is absolute, errors in the selection of commodities greatly affect the expected results. Agricultural commodities that are planting is a type of plant that is feasible with high economics, easy marketing opportunities and high yield potential, easy to cultivate and available technology (Budi, 2013). In addition, it is also prioritized as a local regional superior commodity that has been previously developed (Soleh, 1999). The successive cropping pattern is one way of managing land wisely by paying attention to many aspects so that the results obtained are higher in unity and broad unity. The advantages of the consecutive cropping pattern are to plant crops sustainably in a short time, efficient tillage and production is guaranteed by the selected commodities for planting with available marketing opportunities (Sunu and Wartoyo, 2006). The purpose of the research is to find out on farmers’ income knowing production costs, income and business opportunities, as well as timely managing dry land with successive crop models.
Research methods
The research was carried out for 5 months, starting from April to August 2021, in Madiun Regency, East Java, Indonesia. The data consists of primary data and secondary data. Primary data were obtained by direct observation at the research site, conducting interviews with respondents (questionnaires) which had been prepared in accordance with the research objectives. While secondary data is obtained by collecting data from other parties including related agencies, expert studies, literature studies and other sources that support this research.
This study calculates the production costs, revenues, and income of three crops: corn, peanuts and cucumbers that are cultivated. The income of these three crops will be calculated and then the total income will be added up in one year. These results will show the income of horticultural crops with successive cropping patterns.
The contribution of each plant to farmers’ income with successive cropping patterns can be determined based on the amount of income from each plant. Business feasibility can be calculated from the ratio of income compared to expenses (Benefit Cost Ratio). Benefit Cost Ratio is the comparison between Present Value Benefit divided by Present Value Cost. The results of the B/C Ratio of a project are said to be economically feasible, if the value of the B/C Ratio is more than the value of 1 (one).
According to Sukirno (2002), for the analysis of the number of receipts can be calculated by the formula:
TR = P.Q
Information:
TR = Total Revenue / Total Revenue (Rp)
P = Product Price (Rp)
Q = Number of Products (Kg)
Total costs incurred inproduction activities can be calculated by the formula:
TC = TFC + TVC
Information:
TC = Total Cost (Rp)
TFC = Total Fixed Cost (Rp)
TVC = Total Variable Cost (Rp)
According to Boediono (1992), income is calculated by subtracting the total revenue from the total cost, with the following formula:
I = TR –TC
Information:
I = Income (Revenue)
TR = Total Revenue
TC = Total Cost
Results and discussion
Overview of successive cropping models
The successive planting model is one of the cropping models carried out by respondents in Madiun Regency, Indonesia with the selection of appropriate commodities, namely peanuts, corn and cucumbers. The average area of the respondents is as shown in Figure 1 below:
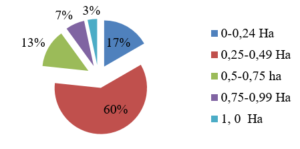
Figure 1: Average land area cultivated.
Figure 1 shows the number of respondents who cultivate the most managed land area is 60% with a land area of 0.25-0.49 Ha. Commodities planted in succession are a combination of food crops and horticultural crops (peanuts, corn and cucumbers) grown on their own land.
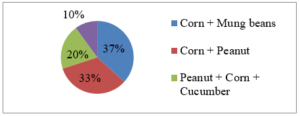
Figure 2: Number of farmers who practice successive planting.
Figure 2 shows that there are 4 kinds of commodity selection for the cultivation of the consecutive cropping model, the highest is 37% corn + green beans, 33% corn + peanuts, 20% peanuts + corn + cucumber and 10% corn + peanuts + chili.
Production cost
Production cost is the value of all production factors used in farming activities. Production costs for corn, peanut, cucumber, and chili plants consist of several costs. Production costs consist of fixed costs, variable costs and other costs. The results of the production cost survey are presented in Table 1. Table 1: Farming analysis corn and mung beans model. Table 1 shows that the sequential cultivation model of 2 (two) commodities in a row by combining corn and mungbean food crops has an average R/C ratio = 2.27. The value of the R/C ratio of the two combinations of these commodities can be interpreted as profitable. This value can be interpreted that this model is still profitable, where the profit value reaches Rp. 22 515 000.
Fixed cost (IDR)
Corn
%
Mung beans
%
Total
Seeds
720000
9.66%
1200000
11.34%
1920000
Fertilizer
875000
11.74%
375000
3.54%
1250000
insecticide
700000
9.39%
700000
6.62%
1400000
Labor Cost (IDR)
Tillage
750000
10.06%
250000
2.36%
1000000
Planting
600000
8.05%
1600000
15.12%
2200000
fertilization
640000
8.58%
800000
7.56%
1440000
Spraying
960000
12.88%
1600000
15.12%
2560000
weeding
1280000
17.17%
800000
7.56%
2080000
harvesting
640000
8.58%
2400000
22.68%
3040000
Herbicide
140000
1.88%
700000
6.62%
840000
Other Cost (IDR)
Shrinkage
150000
2.01%
155000
1.47%
305000
Total production cost
7455000
100%
10580000
100%
18035000
Production (Kg/Ha)
4000
1100
Price (IDR)
4500
20500
Reception (IDR)
18000000
22550000
Profit
10545000
11970000
22515000
R/C
2.41
2.13
2.27
Fixed cost (IDR)
Corn
%
Peanut
%
Total
Seeds
1080000
13.28%
4000000
26.70%
5080000
Fertilizer
875000
10.76%
375000
2.50%
1250000
insecticide
700000
8.60%
700000
4.67%
1400000
Labor Cost (IDR)
Tillage
750000
9.22%
250000
1.67%
1000000
Planting
600000
7.38%
1600000
10.68%
2200000
fertilization
640000
7.87%
800000
5.34%
1440000
Spraying
1280000
15.73%
1600000
10.68%
2880000
weeding
1280000
15.73%
800000
5.34%
2080000
harvesting
640000
7.87%
4000000
26.70%
4640000
Herbicide
140000
1.72%
700000
4.67%
840000
Other Cost (IDR)
Shrinkage
150000
1.84%
155000
1.03%
305000
Total production cost
8135000
100%
14980000
100%
23115000
Production (Kg/Ha)
3920
1300
Price (IDR)
4500
27000
Reception (IDR)
17640000
35100000
Profit
9505000
20120000
R/C
2.17
2.34
2.26
Table 2 shows that the productivity of peanuts can reach 1.3 tons/ha, this is in accordance with the results of research conducted by Polakitan and Taulu, (2014), Purba and Yurzak, (2012). The model of consecutive cultivation of 2 corn commodities with peanuts has an average R /C ratio 2.26. This value can be interpreted that this cultivation model is still profitable. The profit value that can be achieved is Rp. 29 895 000.
Fixed cost (IDR)
Peanut
%
Corn
%
Cucuber
%
Total
Seeds
4000000
28.86%
720000
9.66%
4900000
38%
9620000
Fertilizer
375000
2.71%
875000
11.74%
500000
4%
1750000
insecticide
700000
5.05%
700000
9.39%
560000
4%
1960000
Labor Cost (IDR)
Tillage
250000
1.80%
750000
10.06%
250000
2%
1250000
Planting
1600000
11.54%
600000
8.05%
1280000
10%
3480000
fertilization
800000
5.77%
640000
8.58%
800000
6%
2240000
Spraying
1280000
9.24%
960000
12.88%
1280000
10%
3520000
weeding
800000
5.77%
1280000
17.17%
400000
3%
2480000
harvesting
3200000
23.09%
640000
8.58%
2400000
19%
6240000
Herbicide
700000
5.05%
140000
1.88%
350000
3%
1190000
Other Cost (IDR)
Shrinkage
155000
1.12%
150000
2.01%
115000
1%
420000
Total production cost
13860000
100%
7455000
100%
12835000
100%
21315000
Production (Kg/Ha)
1300
4000
15000
Price (IDR)
20500
4500
2600
Reception (IDR)
26650000
18000000
39000000
Profit
12790000
10545000
26165000
23335000
R/C
1.92
2.41
3.04
2.46
Table 3 shows that the consecutive cropping model for peanut, corn and cucumber crops has an R/C value of 2.46. This value means that this planting model is profitable, with a profit of Rp. 49 500 000.
Fixed cost (IDR)
Peanut
%
Corn
%
Chilli
%
Total
Seeds
4000000
26.42%
720000
9.66%
2800000
14%
7520000
Fertilizer
375000
2.48%
875000
11.74%
625000
3%
1875000
insecticide
700000
4.62%
700000
9.39%
840000
4%
2240000
Labor Cost (IDR)
Tillage
250000
1.65%
750000
10.06%
1250000
6%
2250000
Planting
1600000
10.57%
600000
8.05%
2400000
12%
4600000
fertilization
800000
5.28%
640000
8.58%
2400000
12%
3840000
Spraying
1600000
10.57%
960000
12.88%
2880000
15%
5440000
weeding
960000
6.34%
1280000
17.17%
2880000
15%
5120000
harvesting
4000000
26.42%
640000
8.58%
3200000
16%
7840000
Herbicide
700000
4.62%
140000
1.88%
350000
2%
1190000
Other Cost (IDR)
Shrinkage
155000
1.02%
150000
2.01%
115000
1%
420000
Total production cost
15140000
100%
7455000
100%
19740000
100%
22595000
production (Kg/Ha)
1300
3898
3995
Price (IDR)
27000
4500
16500
Reception (IDR)
35100000
17541000
65917500
profit
19960000
10086000
46177500
300460000
R/C
2.32
2.35
3.34
2.67
Table 4 shows that the sequential cropping model for peanut, corn, and chili commodities sequentially gives an R/C value of 2.67, or it can be concluded that this model is profitable. This 3-commodity successive planting model will increase profits to Rp. 76, 223,500. In addition, there was an increase of 54% compared to consecutive planting of 2 commodities (corn, beans) and 3 commodities (peanuts, corn and cucumbers), the results of this study are in accordance with (Budiman 2012).
Conclusion
This study shows that the successive cropping model provides a promising business customer, which provides a high R/C value and provides large profits. In addition to technical factors, an important factor in the application of sequential model cultivation is the selection of the right commodity. The successive cropping model has a fairly high efficiency value at the cost of implementation in the field with an efficiency value of 13 – 30%. In addition, choosing the right commodity can save on pest and disease control costs and increase product sales in the market. Cultivating the right successive model can guarantee multiple profits.
Acknowledgments
Directorate General of Higher Education Minister of education, culture, research and technology of the Republic of Indonesia.
Rector of the Independent University of Madiun.
Head of the Institute for Research and Community Service, Universitas Merdeka Madiun.
References
- Budi L S (2007) Pengaruh cara tanam dan penggunaan varietas terhadap produktivitas wijen (Sesamum indicum L.) J Agronomi Indonesia 35 (2).
- Budi L S (2013) Development of Agro-Horticultural Commodity Approach and Institutional Models in The District of Madiun, Indonesia J Advanced Science, Engineering and Information Technology 3:363-367.
- Boediono (1992) Ekonomi Mikro Pengantar Ekonomi BPFE Universitas Gajah Mada: Yogyakarta.
- Budiman H (2012) Sukses Bertanam Jagung Komoditas pertanian yang Menjanjikan Pustaka Baru Press Yogyakarta.
- BPS (2010) Biro Pusat Statistik Kabupaten Samosir 2008-2010.
- Polakitan A, Taulu L A (2014) Keragaan Beberapa Varietas Unggul Kacang Tanah Pada Musim Kemarau di Sulawesi Utara Prosiding Seminar Hasil Penelitian Tanaman Aneka Kacang dan Umbi: Inovasi Teknologi Tanaman Aneka Kacang dan Umbi Untuk Mewujudkan Sistem Pertanian Bioindustri Berkelanjutan, 668-671.
- Purba R, Yursak Z (2012) Peningkatan Usahatani Kacang Tanah Melalui Introduksi Teknologi Varietas Unggul di Desa Sigedong Kecamatan Mancak Kabupaten Serang Buletin IKATAN 2:61-69.
- Rahayu S, Budi L S (2011) Tumpang Sari Kacang Tanah (Arachis hypogeae L.) dengan Wijen (Sesamum indicum L.) sebagai Upaya Peningkatan Produktivitas Lahan Kering. J Agritek 12:1-14.
- Sukirno S (2002) Pengantar Mikro Ekonomi Jakarta: Raja Grafindo Persada.