Publication Information
ISSN 2692-1529
Frequency: Continuous
Format: PDF and HTML
Versions: Online (Open Access)
Year first Published: 2019
Language: English
| Journal Menu |
| Editorial Board |
| Reviewer Board |
| Articles |
| Open Access |
| Special Issue Proposals |
| Guidelines for Authors |
| Guidelines for Editors |
| Guidelines for Reviewers |
| Membership |
| Fee and Guidelines |
 |
Beta-glucan induced trained immunity is associated with changes in gut Nccrp-1+ and Mpeg-1+cell populations in rag1-/- zebrafish
Beth Peterman1 and Lora Petrie-Hanson1*
Department of Comparative Biomedical Sciences, College of Veterinary Medicine, Mississippi State University, USA
Received Date: August 12, 2021; Accepted Date: August 25, 2021; Published Date: September 03, 2021
*Corresponding author: Lora Petrie-Hanson, Department of Comparative Biomedical Sciences, College of Veterinary Medicine, Mississippi State University, PO Box 6100, Mississippi State, MS 39762, USA. Tel: +16623251291; Email: lora@cvm.msstate.edu
Citation: Peterman B, Petrie-Hanson L (2021) Beta-glucan induced trained immunity is associated with changes in gut Nccrp-1+ and Mpeg-1+cell populations in rag1-/- zebrafish. Jr Aqua Mar Bio Eco: JAMBE-112.
DOI: 10.37722/JAMBE.2021101
Abstract
This study determined the effects of beta-glucan and Resiquimod (R848) on the non-specific cytotoxic cell (NCC), Natural Killer cell (NK) and macrophage/monocyte cell populations in the gut of rag1-/- zebrafish. This study also determined if these changes were long-term and if changes in cell populations were associated with increased survival. Innate immune cells in rag1-/- zebrafish include a decreased lymphocyte-like cell population with NCC’s and NK cells, a macrophage/monocyte population, and neutrophils. Rag1-/- zebrafish were exposed to phosphate buffered saline (PBS), beta-glucan or R848 by intracoelomic injection and after four weeks, gut samples were collected to analyze cell type distribution and protein expression of Nccrp-1 (NCC cells), Mpeg-1 (macrophages/monocytes) and Nitr9 (NK cells) by flow cytometry and western blot analyses. A separate group of rag1-/- zebrafish was gavage challenged with Edwardsiella ictaluri at 4 weeks post PBS, beta-glucan or R848 injection and survival and cell type distribution were analyzed. There were significantly more NCCs and macrophages in rag1-/- zebrafish gut tissue 4 weeks post beta-glucan injection when compared to PBS injected control tissues. There were significant differences in the relative protein expression of Mpeg-1 and Nitr9 after stimulation with beta-glucan or R848. Following gavage bacterial challenge, rag1-/- zebrafish previously exposed to beta-glucan had significantly higher survival than rag1-/- zebrafish previously exposed to PBS and significantly more NCCs and macrophages in the gut. These findings demonstrate that resident gut NCCs and macrophages in rag1-/- zebrafish increase in number and undergo immune-modulation or training and contribute to increased survival after exposure to an enteric pathogen four weeks post immune-modulation.
Keywords: Beta-glucan; Gut immunity; Nccrp-1; NCCs; Mpeg-1; rag1-/- zebrafish
Introduction
Mucosal surfaces provide fish with a first line of defense against threats in their environment [1, 2]. At gut surfaces, host nutrition and immunity, and the microbiome combine to impact pathogen prevalence, fish growth and fish health [3]. The mucosal epithelium is composed of a lamina propria, blood vessels, nerves, collagenous matrices and gut associated lymphoid tissue (GALT). The gut has the largest aggregation of immune cells in the vertebrate body. Teleosts have a diffuse gut associated lymphoid system with some structures that are morphologically different from mammalian GALT [4]. Zebrafish gut associated immune cells include macrophages, neutrophils, eosinophils, dendritic cells [5-9], Natural Killer or NK cell proteins [10], and several populations of innate lymphocyte-like cells [11]. Nonspecific cytotoxic cell (NCC) genes have been identified in gut tissues [11, 12], but NCCs have not been specifically isolated from the zebrafish gut. Innate lymphoid cells (ILCs) are tissue-resident lymphocytes that occur predominately in the gut and have been identified in the rag1-/- (rag1 mutant) zebrafish gut [11]. ILCs do not express immune recognition receptors whose assemblies depend on recombination activating gene (RAG) proteins [13]. In the absence of adaptive antigen receptors, ILCs have cytokine receptors and respond to tissue changes by producing cytokines [11]. In mammals there are five populations of ILCs [14]. The NK cell group can directly kill target cells. Groups 1, 2 and 3 are cytokine producing helper ILCs based on their transcription factor and cytokine secretion profiles, as well as phenotypic cell surface markers [14-16]. The LTi group are lymphoid tissue inducer cells. Hernández et al. (2018) [11] determined that rag1 mutant zebrafish have gut cells that resemble ILC2 and ILC3 cells and appear to contain an ILC-like population that responds to immune challenge. In rag1 mutant zebrafish anterior kidney, liver and spleen tissues, four populations of lymphocyte like cells (LLCs) were morphologically described [17], and if any of these may be ILCs has not been determined.
Immune stimulants can provide predictable protection [18]. In mammals, Dectin-1 is a member of the C-type lectin receptor (CLR) family and is the best described receptor for beta-glucans [19]. Beta-glucan is one of the most promising immune stimulants in mammals and its mechanism of action has been documented [20]. The dectin-1 receptor binds to beta-glucan which results in enhanced immune responses. Beta-glucan triggers the activation of innate immune cells and can also enhance opsonic and non-opsonic phagocytosis as well as the function of cytotoxicity [21]. Dectin-1 is thought to act in conjunction with TLR2 [22]. The presence of Dectin-1 is limited to mammalian genomes [23]. No clear homologue of Dectin-1 has been identified in fish genomes [19]. However, other CLRs probably play a role in the recognition of beta-glucans in fish. Beta-glucan is one of the compounds known to induce trained immunity. Trained immunity is characterized by enhanced protection to secondary pathogen exposure mediated by innate immune cells [24]. Leukocytes from rag1 mutant zebrafish mediate protective immunity [25], but a specific cell type or mechanism has not been identified.
In bony fish, the family of immune-related, lectin-like receptors (illrs) are candidate receptors for recognition of beta-glucan. Illr genes were shown to be differentially expressed in the myeloid and lymphoid lineages in zebrafish suggesting they function in NK cells and myeloid cells [26]. Carp illr genes are highly similar to zebrafish illr genes suggesting they are homologs, and basal expressions between carp and zebrafish are also very similar [27]. Common carp macrophages exposed to beta-glucan were found to have a gene expression profile typical of a signaling pathway associated with CLR activation suggesting that the immune-modulation effects of beta-glucan could be a result of signaling mediated by a member of the CLR family [19]. Resiquimod (R848) is a TLR7/8 ligand and belongs to the family of imidazoquinolines that are known to induce mammalian NK cells [28] and induce type I ifn responses in salmonids [29]. In rag1 mutant zebrafish anterior kidney, liver and spleen tissues, LLC and macrophage immune genes were upregulated following R848 exposure [17]. Trained immunity is the re-programming of innate immune cells that results in long-term functional changes in those cells. These changes include enhanced pathogen recognition and increased anti-microbial functional responses [24].
This is the first study to describe the morphological characteristics and phenotypes of innate immune cells in the gut of rag1 mutant zebrafish. This investigation was performed to determine if TLR ligands beta-glucan or R848 induce long-term changes, or trained immunity, in innate immune cell populations in the rag1 mutant zebrafish gut. Flow cytometry was used to observe changes in gut cell populations after stimulation and after gavage bacterial exposure. Survival trials of zebrafish in E. ictaluri challenges following exposure to the TLR ligands were performed to determine if immune modulation resulting from TLR ligand exposure can provide protection against later pathogen exposure.
Methods
Fish Care
Zebrafish used for this study were from a homozygous colony of rag1 mutant zebrafish previously established in the specific pathogen free hatchery in the College of Veterinary Medicine, Mississippi State University (MSU) [30]. Prior to TLR ligand injection or bacterial challenge, fish were stocked into 15 L experimental tanks supplied with de-chlorinated city water at a flow rate of approximately 0.2 L/min, constant aeration and a water temperature of 28 ± 0.2°C. Propagation and experimental protocols were approved by the MSU Institutional Animal Care and Use Committee (IACUC).
TLR Ligands Beta-Glucan and Resiquimod Injections
Zebrafish were exposed to endotoxin free phosphate buffered saline (PBS) (10 µl/0.5g fish) beta-glucan (50 µg/0.5 g fish) or Resiquimod (R848) (0.08 µg/0.5g fish) (Figure 1). Gut cell isolation samples were taken for flow cytometry and cytospins, and entire gut tissues were sampled for western blot analyses at 1-month post-injection. Ten fish were used in each treatment. Five fish were sampled for flow cytometry and cytospins and five fish were sampled for western blot analyses. Fish were euthanized by overdose of methane tricaine sulfonate (MS222, Tricaine-S®, Western Chemical Inc.).
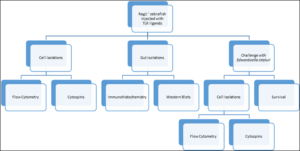
Figure 1: Flow chart demonstrating the experiments for TLR ligand exposures and analyses.
Cell Isolations
Gut leukocytes were isolated following routine procedures [31]. The intestine from each of five zebrafish per treatment was processed separately. Briefly, tissues were removed from rag1 mutant zebrafish and collected in ice cold FACS buffer (Hanks balanced salt solution without calcium or magnesium with 0.02% bovine serum albumin). Tissues were held on ice and dissociated with a Teflon homogenizer on a 40 µm strainer in FACS buffer with protease inhibitor (Pierce, A32963) added. Filtered cells were layered on a Histopaque 1119 gradient (Sigma-Aldrich, 11191). The suspension was centrifuged at 700 x g for 20 minutes. The Buffy layer at the interface between the cell suspension and the gradient was collected, washed with 500 µl FACS buffer and resuspended to a concentration of 1×10⁶ cells/ml in FACS buffer.
Flow Cytometry
After washing collected intestine cells in FACS buffer, 1×10⁵ cells/ml were transferred to individual 3 ml flow cytometry tubes in 100 µl aliquots. Cells were fixed with 50 µl 4% paraformaldehyde for 15 minutes on ice, washed 3 times with 500 µl FACS buffer at 400 x g at 4°C, then permeabilized with 50 µl 1X BD Perm/wash buffer (BD, 51-2091KZ) for 5 minutes on ice, washed 3 times with 500 µl FACS buffer at 400 x g at 4°C and all supernatant removed. Fc block (Invitrogen, 14-9161-73) was added according to the manufacturer’s instructions at 20 µl/tube and incubated on ice for 20 minutes and not washed. Cells were labeled with either 10 µg 5C6 (Invitrogen, MA5-16528), 20 µg anti-Mpeg-1 (AS-55917, Ana Spec), or 10 µg IgG mouse anti-zebrafish Nitr-990.10.5 (University of North Carolina at Chapel Hill Core Facility) antibody and incubated on ice for 1 hour. 5C6 is a monoclonal antibody that binds to Nccrp-1 [32]. Mpeg-1 is a synthetic peptide derived from the C-terminus of zebrafish Mpeg-1 protein (GenBank accession # NP_997902.1). The cells were washed with 500 µl FACS buffer three times at 400 x g at 4°C for 5 minutes each wash. The cells were then mixed with 50µl of fluor labeled secondary antibody (fluorescein isothiocyanate (FITC), APC-CY7, and phycoerythrin (PE) for Nccrp-1, Mpeg-1 and Nitr9, respectively) at a concentration of 10 µg and incubated on ice for 30 minutes. Following secondary labeling, the cells were washed three times at 500 x g at 4°C for 5 minutes each wash and re-suspended in 200 µl ice cold FACS buffer.
Isotype controls were used as a negative control to help differentiate non-specific background signal from specific antibody signal. Rat IgG2b isotype control (Invitrogen, 02-9288) was used for Nccrp-1, mouse IgG2b isotype control (Invitrogen, 02-6300) for Nitr-9, and rabbit IgG polyclonal isotype control (Abcam, ab37415) was used as a negative control for Mpeg-1. The five isotype controls for each fluor were stained using the isotype control as the primary antibody for 1 hour followed by 30 minutes’ incubation with specific fluor for 30 minutes. Samples were incubated on ice until analyzed.
Flow cytometry analyses of rag1 mutant zebrafish intestine cells involved forward scatter (FSC) and side scatter (SSC) determinations on a NovoCyte Acea novosampler. FSC represents cell size in diameter and SSC represents cell granularity, or complexity. Twenty thousand cells were collected each sample. Cells were gated in two areas. Small agranular and granular lymphocyte-like cells (LLCs) were included in gate 1 and large agranular and granular LLCs were included in gate 2 (Figure 2) based on cell sizes defined in Muire et al., 2017 [17]. Unstained, fluorescence minus 1 (FMO), and isotype controls were used to set gates and determine positivity. The positive cells were calculated using the percent positive cells minus the number positive for the isotype control. Results are presented as mean number of cells positive for a specific antibody. Novoexpress software was used for the analysis.
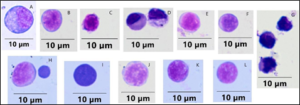
Figure 2: Large and small lymphocyte-like cells (LLCs) in rag1-/- mutant zebrafish intestine. Cells were stained with Wright-Giemsa and examined under oil immersion by light microscopy and viewed at 1000x magnification. The size bar represents 10 µm.
Cytospins
Cytospin preparations were performed following procedures routinely used in our lab [33]. Briefly, cell suspensions containing 104 to 106 cells/ml were loaded into cytospin cartridges in 400 µl aliquots and centrifuged in a Cyto-tech® centrifuge at 500 x g for 1 minute. The cytospin slides were air dried for 20 minutes and stained with modified Wright-Giemsa stain (Sigma-Aldrich) following manufacturers’ instructions. Slides were viewed on an Olympus BX43 microscope at 1000x magnification. LLCs including Natural Killer (NK) cells and non-specific cytotoxic cells (NCCs) and were discriminated by size, and by the absence or presence of cytoplasmic granules and categorized as large agranular, large granular, small agranular and small granular. Ten cells of each size and granularity were measured for each of the five cytospin slides for each treatment.
Western Blots
Four weeks after the R848 or beta-glucan injections, intestines were homogenized in tissue protein extraction buffer (Thermo Scientific, 78510) and the supernatant was collected. Protein concentration was measured on a Nanodrop spectrophotometer (Nanodrop, Wilmington, Delaware). A total of 30 µg of protein was resolved on a 12% SDS-polyacrylamide gel and transferred to polyvinylidene difluoride (PVDF) membranes (BioRad) for western blot analysis. PVDF membranes were incubated in blocking buffer 3% milk in tris-buffered saline with 0.1% Tween®20 detergent) overnight. Membranes were washed in tris-buffered saline with 0.1% Tween®20 detergent (TBS-T) three times for 5 minutes each then incubated with primary antibody: Nccrp-1, Mpeg-1 or Nitr-9 or isotype control at 5 µg/ml overnight. Rat IgG2b isotype control (Invitrogen, 02-9288) was used as negative control for Nccrp-1, Mouse IgG2b isotype control (Thermo Fisher, 02-6300) was used as negative control for Nitr-9 and Rabbit IgG isotype control (Abcam, ab37415) was used as negative control for Mpeg-1 to help differentiate non-specific background signal from specific antibody signal.
The membrane was washed in TBS-T three times as described previously for 5 minutes each wash followed by incubation with HRP conjugated secondary antibody: goat anti-mouse IgG/HRP conjugated (Nccrp-1 and Nitr-9)(1:5000) or goat anti-rabbit IgG/HRP conjugate (Mpeg-1) (1:5000) (Thermo Scientific) for 1 hour at 4°C. The membrane was washed in TBS-T three times for 5 minutes each and TMB solution for blotting (Life Technologies, 002019) was added until color development. The reaction was stopped by rinsing the membrane in distilled water. Western blot bands were analyzed by Image Processing & Analysis in Java (ImageJ, NIH, USA). Western blot bands were quantified as log2 relative to the standard.
Survival
Administration of TLR ligands was performed to determine the effects of beta-glucan and R848 on survival when challenged with a field isolate of E. ictaluri. Rag1 mutant zebrafish were stocked (15 fish/tank with 3 tank replicates for each treatment) into 15 L experimental flow through tanks supplied with de-chlorinated municipal water. Tank temperatures were maintained at 27 ± 0.2°C. Zebrafish were exposed to PBS, beta-glucan or R848 at concentrations described previously in the TLR ligand injection section (2.2). After 1 month, zebrafish were challenged by gavage with 1×10⁸ CFU/fish E. ictaluri. For bacterial exposure, 250 ml of bacteria at an OD540 of 0.4 was centrifuged at 1500 x g for 10 minutes, supernatant discarded, and bacteria re-suspended in 2.5 ml PBS. Zebrafish were anesthetized with 150 mg/L MS-222. Ten µl of bacterial suspension was gavaged to each fish using flexible catheter implantation tubing (0.83 mm) attached to a 22-G needle. The flexible tubing was passed into the oral cavity of the zebrafish until the tip of the tubing extended approximately 1 cm [34]. The bacterial suspension was then released slowly into the fundic stomach. Zebrafish were allowed to recover and then returned to the tank. Control fish were sham gavaged with 10 µl PBS. Zebrafish were monitored and moribund fish were counted and removed 3 times a day. Brain and kidney of these fish were cultured on E. ictaluri media (EIM) [35] to confirm the presence of E. ictaluri. Deaths were recorded for 15 days.
Characterization of Isolated Cell Populations after Immune Stimulation and Exposure of Fish to Bacteria
To characterize gut innate immune cell populations after immune stimulation and subsequent bacterial exposure, rag1 mutant zebrafish (5 fish each treatment) were stocked into 15 L flow through tanks supplied with de-chlorinated municipal water and constant aeration. Tank temperatures were maintained at 27 ± 0.2°C. Zebrafish were exposed to PBS, beta-glucan or R848 at concentrations previously described in section 2.2. One-month post immune stimulation; zebrafish were challenged by gavage with E. ictaluri at 1 x 10⁸ CFU/fish using procedures described in section 2.8. One-month after gavage challenge, zebrafish were euthanized, gut removed, and processed for flow cytometry and cytospins as previously described in sections 2.4 and 2.5, respectively.
Statistical Analyses
Student’s t-test statistical analysis was performed to compare cell sizes in the intestine. Flow cytometry results were analyzed by one-way analysis of variance (ANOVA) with Duncan T3 for pair wise comparisons. Statistical analyses were conducted using SPSS statistical package version 25.0 (SPSS Inc., Chicago, Il, USA). For survival analyses, time of death was used to perform Kaplan Meier survival analysis using Graph Pad Prism version 8.00 for Windows, Graph Pad Software, La Jolla California USA, www.graphpad.com. The non-parametric statistic tests Gehan-Breslow-Wilcoxon and Log ranked (Mantel-Cox) were used to estimate the statistical significance between the survival curves. In all statistical tests, values were considered significantly different at p<0.05.
Results
Cytospins
Cytospin preparations of non-erythroid gut cells revealed LLC populations in the rag1 mutant zebrafish. The average number of cells isolated from the Histopaque 1119 gradients was 1 x 10⁶ cells/ml. Gut preparations consisted of enterocytes, agranular LLCs, granular LLCs and macrophages/monocytes. LLCs were categorized as either small agranular, small granular, large agranular or large granular. Small LLCs were 5.8 ± 0.4 µm and large LLCs were 9.0 ± 0.4 µm (Figure 2) and the average size of these groups was significantly different. Cells stained with Wright-Giemsa varied in size and shape (Figure 2 and 3). Small and large LLCs were similar to one another in staining pattern with a range of staining from light blue to deeply basophilic cytoplasm with a light basophilic to deeply acidophilic nucleus and a large nuclear: cytoplasmic ratio. There were also cells in which the nuclear: cytoplasmic ratio was so high that no cytoplasm was visible (Figure 2). Lymphocytes were round with a rounded nucleus occupying more than half of the cytoplasm. The cytoplasm varied in color from light blue to deeply basophilic.
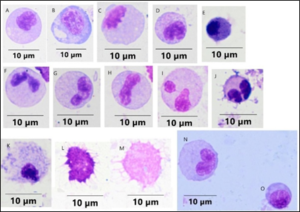
Figure 3: Leukocytes in rag1-/- mutant zebrafish intestine: (A), (B), (C), (N) monocytes/macrophages; (D) eosinophil; (E) basophil; (F), (G), (H), (I), (J) neutrophils, (K) mast cell; (L), (M) dendritic cells, (O) lymphocyte. Cells were stained with Wright-Giemsa and examined under oil immersion by light microscopy and viewed at 1000x magnification. The size bar represents 10 µm.
Monocytes/macrophages were distinguished by their larger size, ovoid nucleus, smaller nuclear: cytoplasmic ratio, and increased amounts of vacuoles in a lighter cytoplasm. Neutrophils were distinguished by the grainy appearance of the cytoplasm, with pale blue to acidophilic small granules with the nucleus having a segmented, banded or rounded appearance. Eosinophils had a peripheral deeply basophilic nucleus and nuclear borders were not evident because of vacuolization in the cytoplasm. Dendritic cells were distinguishable by the projections that are characteristic of these cells and stained from light to dark acidophilic.
Flow Cytometry
Flow cytometry results are presented as the mean number of positive fluorescent cells (out of 20,000) for five fish for each of the mAbs used. Unstained, FMO, and isotype controls were used to set gates and determine positivity. Gates were set to exclude cells emitting auto fluorescence. The positive cells were calculated using the percent positive cells minus the number positive for the isotype control. Results are presented as mean number of cells positive for a specific antibody. Scatter gates were set around two populations. An average of 25% of the 20,000 cells were in gated area 1 whereas an average of 37% of the 20,000 cells were in gated area 2 (Figure 4). All other cells were outside the gates 1 and 2 and were not considered the size or granularity to be included. Small agranular and granular LLCs were included in gate 1 and large granular LLCs were included in gate 2. The majority of cells in gate 1 and the majority of cells in gate 2 were of similar granularity. The difference between the cells in the two gates was cell size. Cells stained positive with Nccrp-1 (5C6), Mpeg-1 and Nitr-9 and this positive staining determined the phenotypic classification of the cell.
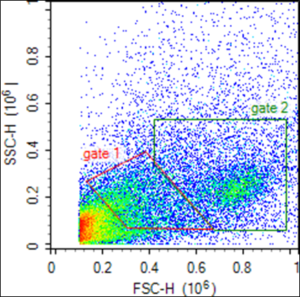
Figure 4: Flow cytometry scatterplot of leukocytes from rag1-/- mutant zebrafish gut tissue based on forward scatter (FSC) and side scatter (SSC) characteristics. Gate 1 includes small agranular and granular lymphocyte-like cells (LLCs) and gate 2 includes large agranular and granular LLCs.
When cell phenotypes were compared in the PBS control fish, there were significantly more Nccrp-1+ cells than Mpeg-1+ (p= 0.002) or Nitr9+ (p= 0.001) cells in gates 1 and 2. Within each gate, these ratios remained similar after zebrafish were exposed to either R848 or beta-glucan (Supplemental Table 1). When comparing cell phenotypes across treatments (Table 1), there were significantly more Nccrp-1+ cells in gates 1 and 2 after beta-glucan exposure compared to PBS or R848 exposure. There were also significantly more Mpeg-1+ cells in gates 1 and 2 after beta-glucan exposure compared to PBS or R848 exposure. There were no significant differences in the number of Nitr-9+ cells in either gate at 4 weeks post R848 or beta-glucan injections. Gate 1 PBS R848 BG Gate 2 BG
Gate
Treatment
Antibody and Mean ± se
p value
Nccrp-1
Mpeg-1
Nitr-9
688 ± 40
67 ± 8
0.001*
688 ± 40
57 ± 5
0.001*
67 ± 8
57 ± 5
1.0
902 ± 77
76 ± 6
0.003*
902 ± 77
52 ± 6
0.003*
76 ± 6
52 ± 6
0.3
1076 ± 69
106 ± 9
0.001*
1076 ± 69
68 ± 9
0.001*
106 ± 9
68 ± 9
0.2
PBS
1417 ± 93
248 ± 14
0.002*
1417 ± 93
221 ± 28
0.001*
248 ± 14
221 ± 28
1.0
R848
1469 ± 58
280 ± 10
<0.001*
1469 ± 58
220 ± 41
<0.001*
280 ± 10
220 ± 41
0.3
1870 ± 128
354 ± 42
0.001*
1870 ± 128
234 ± 74
0.001*
354 ± 42
234 ± 74
0.7
(5C6) Gate 2 Mpeg-1 Gate 1 Gate 2 Nitr-9 Gate 1 Gate 2
Antibody
Gate
Treatment
Mean ± se
p value
Nccrp-1
Gate 1
PBS
688 ± 40
R848
902 ± 77
0.08
BG
1076 ± 69
0.003*
PBS
1417 ± 93
R848
1469 ± 58
0.9
BG
1870 ± 128
0.02*
PBS
67 ± 8
R848
76 ± 6
0.4
BG
106 ± 9
0.02*
PBS
248 ± 14
R848
280 ± 10
1.0
BG
354 ± 42
0.04*
PBS
57 ± 5
R848
52 ± 6
0.9
BG
68 ± 9
0.6
PBS
221 ± 28
R848
220 ± 41
1.0
BG
234 ± 74
0.9
Western Blots
The predicted molecular weight for Nccrp-1 is 127 kDa [32]. Bands for Nccrp-1 in the western blot analysis were at 151 kDa (Figure 5). Four weeks after R848 and beta-glucan exposures, the relative densities of the Nccrp-1 bands were not significantly different from the PBS control Nccrp-1 bands (Table 2). The predicted molecular weight for Mpeg-1 is 79 kDa. Bands for Mpeg-1 were in the western blot analysis at 74 kDa (Figure 5). R848 and beta-glucan bands for Mpeg-1 were significantly denser than the PBS control Mpeg-1 bands (Table 2). There are three isoforms of Nitr9 with varying molecular weights of 20 kDa, 30 kDa, and 34 kDa (Shah et al., 2012). In our study, the predominant band for Nitr9 was at 36 kDa (Figure 5), representing the heavy isoform. The relative densities of the bands after R848 and beta-glucan exposure were significantly greater than those from the PBS controls (Table 2).
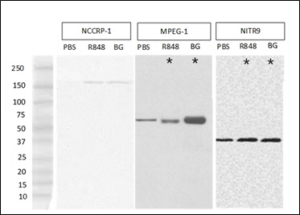
Figure 5: Western blot analyses demonstrating Nccrp-1, Mpeg-1 or Nitr-9 heavy chain isoform expression in the gut of rag1-/- mutant zebrafish injected with phosphate buffered saline (PBS), resiquimod (R848), or beta-glucan (BG). Asterix* denote significance (p<0.05).
(5C6) Mpeg-1 Nitr-9
mAb
Treatment
Mean ± SEM
p value
Nccrp-1
PBS
2.55 ± 0.335
R848
4.46 ± 0.691
0.2
BG
4.59 ± 0.720
0.1
PBS
3.31 ± 0.081
R848
3.93 ± 0.117
0.02*
BG
5.72 ± 0.128
<0.001*
PBS
3.73 ± 0.009
R848
4.39 ± 0.012
<0.001*
BG
4.46 ± 0.009
<0.001*
Survival
Following gavage challenge with E. ictaluri, beta-glucan injected fish had significantly higher survival than PBS injected fish (Table 3, Figure 6). Survival was not significantly increased in fish injected with R848 four weeks before gavage challenge. E. ictaluri was isolated from all moribund fish as shown by growth on EIM agar, confirming the cause of death.
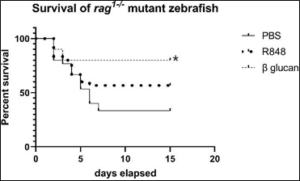 Figure 6: Survival of rag1-/- mutant zebrafish after gavage challenge of 1×10⁸ CFU Edwardsiella ictaluri/fish over a 15-day period. Four weeks before bacterial challenge, fish were intracelomically injected with phosphate buffered saline (PBS), resiquimod (R848) or beta-glucan. Beta-glucan exposed zebrafish had significantly higher survival (*) than PBS exposed zebrafish. Statistical analysis was by Kaplan-Meier survival analysis with 45 fish in each group.
Treatment
Mantel-Cox
Gehan-Breslow-Wilcoxon
PBS vs R848
p=0.1
p=0.3
PBS vs BG
p=0.0008*
p=0.003*
R848 vs BG
p=0.07
p=0.1
Characterization of Cell Phenotypes after Immune Stimulation and Bacterial Gavage
After gavage challenge, gate 1 of the PBS fish had significantly more Nitr9+ cells than Mpeg-1+ cells, and the Nccrp-1+ cells were equivalent to the Nitr9+ cells. In gate 2, there were no differences between any of the cell phenotypes (Supplemental Table 2). In the group originally exposed to R848, there were no significant differences between any phenotypes in either gate 1 or gate 2 one month after the gavage challenge. In the group originally exposed to beta-glucan, there were significantly more Nccrp-1+ and Mpeg-1+ cells than Nitr9+ cells in both gates 1 and 2 one month after gavage challenge (Supplemental Table 2). Gate 1 PBS/ bacteria R848/ bacteria
BG/ bacteria Gate 2 PBS/ bacteria R848/ bacteria BG/ bacteria 0.05*
Gate
Treatment
Mean ± se
p value
Nccrp-1
Mpeg-1
Nitr-9
223 ± 37
93.2 ± 14
1.0
223 ± 37
247 ± 48
1.0
93.2 ± 14
247 ± 48
0.03*
281 ± 68
124.6 ± 28
0.5
281 ± 68
382 ± 38
1.0
124.6 ± 28
382 ± 38
0.1
1386 ± 160
1446 ± 129
1.0
1386 ± 160
332 ± 71
0.03*
1446 ± 129
332 ± 71
0.03*
214 ± 23
171.8 ± 21
1.0
214 ± 23
232 ± 25
1.0
171.8 ± 21
232 ± 25
0.4
330 ± 85
222 ± 63
1.0
330 ± 85
459 ± 116
1.0
222 ± 63
459 ± 116
0.8
1623 ± 101
1313 ± 328
1.0
1623 ± 101
393 ± 126
0.04*
1313 ± 328
393 ± 126
After gavage challenge, there were significantly more Nccrp-1+ cells and significantly more Mpeg-1+ cells in gates 1 and 2 in fish previously exposed to beta-glucan when compared to fish previously exposed to PBS (Table 4). There were no significant differences in the number of Nitr-9+ cells between treatment groups that received beta-glucan or R848 four weeks after the gavage bacterial challenge (Table 4). Gate 1 (5C6) Gate 2 Mpeg-1 Gate 1 Gate 2 Nitr-9 Gate 1 Gate 2
Antibody
Gate
Treatment
Mean ± se
p value
Nccrp-1
PBS/bacteria
223 ± 37
R848/bacteria
281 ± 68
0.9
BG/bacteria
1386 ± 160
<0.001*
PBS/bacteria
214 ± 23
R848/bacteria
330 ± 86
0.5
BG/bacteria
1623 ± 101
<0.001*
PBS/bacteria
93 ± 14
R848/bacteria
125 ± 28
0.9
BG/bacteria
1446 ± 129
<0.001*
PBS/bacteria
172 ± 21
R848/bacteria
222 ± 63
1.0
BG/bacteria
1313 ± 328
<0.001*
PBS/bacteria
247 ± 48
R848/bacteria
382 ± 38
0.3
BG/bacteria
332 ± 71
0.5
PBS/bacteria
232 ± 25
R848/bacteria
459 ± 116
0.2
BG/bacteria
393 ± 126
0.4
Discussion
Gut health is fundamental to homeostasis and disease resistance. Maintaining healthy gut tissue and optimum gut immune responses is important for limiting the spread of enteric pathogens. The gut immune cells we observed in the rag1 mutant zebrafish were small agranular lymphocyte-like cells (LLCs), large agranular and granular LLCs, monocytes, macrophages, large granulocytes (NK like cells), eosinophils, basophils, neutrophils, mast cells and dendritic cells. In T and B cell deficient rag1 mutant zebrafish kidney marrow, innate immune cells include lymphocyte-like cells (LLCs), NK cells and NCCs [30]. The morphology of isolated cells from the rag1 mutant zebrafish gut of our study are comparable to the isolated spleen, liver, and kidney marrow cells from rag1 mutant zebrafish which included small agranular LLCs, large LLCs, and macrophages/monocytes [17]. The scatterplot of zebrafish gut cells was similar to the scatterplot of zebrafish kidney marrow from a previous study [17], and the same cell types were observed. Interestingly, our gut cell types resembled cells from the kidney marrow more than cells from the liver or spleen from that study. Similar lymphocyte-like cells were described from peritoneal lavage in wild-type zebrafish [36]. Morphological descriptions of NCCs and LLCs [17, 36] in zebrafish suggest these may be similar to the ILC-like cells described by Hernandez et al. (2018) [11]. Based on morphological descriptions, we believe these cells could be what Hernandez described as ILC like cells in zebrafish gut tissues.
Our flow cytometry results showed that in the PBS treated fish gut, there were 10 times more Nccrp-1+ than either Mpeg-1+ or Nitr9+ cells in Gate 1 and in Gate 2 there were 6 times more Nccrp-1+ than either Mpeg-1+ or Nitr9+ cells. After beta-glucan stimulation, there were significantly higher numbers of Nccrp-1+ and Mpeg-1+ than Nitr9+ cells in gates 1 and 2 compared to the gut of fish stimulated with R848 or controls (PBS). Beta-glucan IP injection has been shown to stimulate myelomonocytic populations in the zebrafish kidney [37]. Muire et al. (2017) [17] found that beta-glucan injected rag1 mutant zebrafish had upregulated genes associated with LLCs and macrophage immune responses in the liver, kidney, and spleen.
Although fish do not have a dectin-1 ortholog [23], common carp macrophages exposed to beta-glucan were found to have a gene expression profile typical of a signaling pathway associated with CLR activation. This suggests that the immune-modulation effects of beta-glucan could be a result of signaling mediated by a member of the CLR family [19]. The same signaling could be occurring in zebrafish. Zebrafish illrs show a similar constitutive expression pattern as carp illrs [27].
Beta-glucan and R848 exposures caused significantly greater Mpeg-1 and Nitr9 protein expression in the gut tissues. Higher Mpeg-1 expression corresponded to higher Mpeg-1+ cells. However, increased Nitr9 expression did not correspond to any changes in Nitr9+ cell numbers and although there were increased numbers of Nccrp-1+ cells, there was not a significant increase in Nccrp-1 protein expression in the R848 or Beta-glucan – treated groups. This result may be explained by the high standard error of the mean in this treatment group. In another study, R848 significantly increased Nitr9 protein expression and Nitr9 gene expression in rag1 mutant zebrafish liver and kidney tissues [17]. If these changes corresponded to increased cell counts or survival was not determined in that study.
We found significantly higher survival after bacterial challenge with BG exposure and this was associated with increased numbers of Nccrp1+ and Mpeg-1+ cells and increased protein expression of Mpeg-1 and Nitr9. Immune-modulation of fish with beta-glucans has stimulating effects on both intestinal and systemic immunity and can increase protection against a subsequent pathogenic challenge [18]. Beta-glucan IP injection has also been shown to enhance survival against Aeromonas hydrophila challenge in zebrafish [37]. The effect of beta-glucan on macrophages is well documented (reviewed in Meena et al., 2013, Petit and Wiegertjes 2016, Zhang et al., 2019) [18, 20, 38]. Our study demonstrates that beta-glucan also has an effect on NCCs in the rag 1 mutant zebrafish gut.
After the gavage challenge, beta-glucan phenotype ratios remained similar to pre-challenge values, demonstrating a fixed long-term effect. Rag1 mutant zebrafish can develop protective immunity against E. ictaluri [25]. In the current study, we demonstrated that exposure to BG can increase innate immune cell numbers and enhance survival against an enteric pathogen. We also demonstrated an association of higher numbers of Nccrp-1+ and Mpeg-1+ cells and enhanced survival after gavage bacterial challenge. Furthermore, a single injection of beta-glucan induced these long-term effects. Beta-glucan exposure and the induction of trained immunity can be used to enhance fish production and survival [38].
In conclusion, in the absence of T and B cells, zebrafish gut NCCs can be modulated to provide protection. Our study demonstrated enhanced survival and immune modulation of intestinal innate immunity after gavage challenge with an enteric pathogen. Our findings demonstrate that beta-glucan induced trained immunity in rag1 mutant zebrafish gut leukocytes. Resident gut Nccrp-1+ and Mpeg-1+ cells in rag1-/- zebrafish increase in number and undergo immune-modulation or training and contribute to increased survival after exposure to an enteric pathogen. Although Nitr9+ cell numbers did not increase, Nitr9 protein levels did, suggesting Nitr9+ cells also underwent immune training after beta-glucan exposure.
References
- Lazado CC, Caipang CMA (2014) Mucosal immunity and probiotics in In Fish and Shellfish Immunology.
- Salinas I, Parra D (2015) Fish mucosal immunity: In Mucosal Health in Aquaculture.
- Beck BH, Peatman E (2015) Mucosal health in In Mucosal Health in Aquaculture.
- Rombout Jan JHWM, Abelli L, Picchietti S, Scapigliati G, Kiron V (2011) Teleost intestinal immunology. In Fish and Shellfish Immunology.
- Ellett F, Pase L, Hayman JW, Andrianopoulos A, Lieschke GJ (2011). Phagocytes, Granulocytes, and Myelopoiesis mpeg1 promoter transgenes direct macrophage-lineage expression in zebrafish. Blood 27: e49–e56.
- Wittamer V, Bertrand JY, Gutschow PW, Traver D (2017) Characterization of the mononuclear phagocyte system in zebrafish 117: 7126–7136.
- Xu J, Du L, Wen Z (2012) Myelopoiesis during Zebrafish Early Development. Journal of Genetics and Genomics 39: 435-442.
- Balla KM, Lugo-villarino G, Spitsbergen JM, Stachura DL, Hu Y, et al. (2010) Eosinophils in the zebrafish : prospective isolation , characterization , and eosinophilia induction by helminth determinants, 116: 3944-3954.
- Lugo-villarino G, Balla KM, Stachura DL, Bañuelos K, Werneck MBF (2010) Identi fi cation of dendritic antigen-presenting cells in the zebra fish 107: 477.
- Shah RN, Rodriguez-Nunez I, Eason DD, Haire RN, Bertrand JY, et al. (2012) Development and characterization of anti-Nitr9 Advances in Hematology.
- Hernández PP, Strzelecka PM, Athanasiadis EI, Hall D, Robalo AF, et al. (2018). Single-cell transcriptional analysis reveals ILC-like cells in zebrafish. Science Immunology 3:
- Caipang CMA (2013) Expression of genes involved in the early immune response at the distal segment of the gut in Atlantic cod, Gadus morhua L. after vaccination with a bacterial antigen 591-603.
- Gronke K, Kofoed-Nielsen M, Diefenback A (2016) Innate lymphoid cells, precursors and Immunology Letters 179: 9-18.
- Spits H, Artis D, Colonna M, Diefenbach A, Di Santo JP, et al. (2013) Innate lymphoid cells–a proposal for uniform Nat Rev Immunol 13: 145-149.
- Artis D, Spits H (2015) The biology of innate lymphoid Nature 517: 293-301.
- Eberl G, Di Santo JP, Vivier E (2015) The brave new world of innate lymphoid cells. Nat. Immunol 16: 1-5.
- Muire PJ, Hanson LA, Wills R, Petrie-Hanson L (2017) Differential gene expression following TLR stimulation in rag1-/- mutant zebrafish tissues and morphological descriptions of lymphocyte-like cell PLoS ONE.
- Petit J, Wiegertjes GF (2016) Long-lived effects of administering Beta-glucans: Indications for trained immunity in fish. Developmental and Comparative Immunology 64: 93-102.
- Petit J, Bailey EC, Wheeler RT, de Oliveira CAF, Forlenza M, Wiegertjes GF (2019) Studies Into Beta-Glucan Recognition in Fish Suggests a Key Role for the C-Type Lectin 501 Front. Immunol 10: 280.
- Meena DK, Das P, Kumar S, Mandal SC, Prusty AK, et al. (2013) Beta-glucan: An ideal immunostimulant in aquaculture (a review). Fish Physiology and Biochemistry 39: 431-457.
- Chan GCF, Chan WK, Sze DMY (2009) The effects of beta-glucan on human immune and cancer In Journal of hematology & oncology 2: 25.
- Netea MG, van der Graaf C, Van der Meer JW, Kullberg BJ (2004) Toll-like receptors and the host defense against microbial pathogens: bringing specificity to the innate-immune Journal of leukocyte biology. 2004 75: 749-755.
- Sattler S, Ghadially H, Erhard E (2012) Evolution of the C-Type lectin-like receptor genes of the Dectin-1 cluster in the NK gene complex. Scientific World Journal .
- Netea MG, Quintin J, Meer JWM Van Der (2011) Perspective Trained Immunity : A Memory for Innate Host Cell Host and Microbe 9: 355-361.
- Hohn C, Petrie-Hanson L (2012) Rag1-/- Mutant Zebrafish Demonstrate Specific Protection following Bacterial Re-Exposure. PLoS ONE 7: e44451.
- Panagos PG, Dobrinski KP, Chen X, Grant AW, Traver D, et (2006) Immune-related, lectin-like receptors are differentially expressed in the myeloid and lymphoid lineages of zebrafish. Immunogenetics 58: 31-40.
- Pietretti D, Spaink HP, Falco A, Forlenza M (2013) Accessory molecules for Toll-like receptors in Teleost Identification of TLR4 interactor with leucine-rich repeats (TRIL). Molecular Immunology 56: 745-756.
- Hart OM, Athie-Morales V, O’Connor GM, Gardiner CM (2005) TLR7/8-Mediated Activation of Human NK Cells Results in Accessory Cell-Dependent IFN-γ Production. The Journal of Immunology 175: 1636-1642.
- Kileng O, Albuquerque A, Robertsen O (2008) Induction of interferon system genes in Atlantic salmon by the imidazoquinoline S-27609, a ligand for Toll-like receptor 7. Fish Shellfish 24: 514-522.
- Petrie-Hanson L, Hohn C, Hanson L (2009) Characterization of rag1-/- mutant zebrafish leukocytes. BMC
- Hébert P, Ainsworth AJ, Boyd B (2002) Histological enzyme and flow cytometric analysis of channel catfish intestinal tract immune Developmental and Comparative Immunology 26: 53-62.
- Jaso-Friedmann L, Leary 3rd JH, Evans DL (1997) NCCRP-1: a novel receptor protein sequenced from teleost nonspecific cytotoxic cells. Mol Immunol 34: 955-965.
- Petrie-Hanson L, Ainsworth AJ (2000) Differential cytochemical staining characteristics of channel catfish leukocytes identify cell populations in lymphoid Veterinary Immunology and Immunopathology.
- Collymore C, Rasmussen S, Tolwani RJ (2013) Gavaging adult Journal of Visualized Experiments.
- Collins LA, Thune RL (1996) Development of a defined minimal medium for the growth of Edwardsiella ictaluri. Applied and Environmental Microbiology 62: 848-852.
- Moss LD, Monette MM, Jaso-friedmann L, Leary JH, Dougan ST, et al. (2009) Identification of phagocytic cells , NK-like cytotoxic cell activity and the production of cellular exudates in the coelomic cavity of adult zebrafish 33: 1077–1087.
- Rodríguez I, Chamorro R, Novoa B, Figueras A (2009) Beta-Glucan administration enhances disease resistance and some innate immune responses in zebrafish (Danio rerio). Fish and Shellfish 27: 369-373.
- Zhang Z, Chi H, Dalmo RA (2019) Trained innate immunity of fish is a viable approach in larval aquaculture. Frontiers in Immunology, 10: 1-5.