Publication Information
ISSN: 2641-6859
Frequency: Continuous
Format: PDF and HTML
Versions: Online (Open Access)
Year first Published: 2018
Language: English
| Journal Menu |
| Editorial Board |
| Reviewer Board |
| Articles |
| Open Access |
| Special Issue Proposals |
| Guidelines for Authors |
| Guidelines for Editors |
| Guidelines for Reviewers |
| Membership |
| Fee and Guidelines |
 |
Athletic Monitoring in Basketball: A Qualitative Exploratory Approach
Brian Serrano1*, Matt Comer1, Geoffrey Puls1
1Chicago Bulls Basketball Organization
Received Date: August 05, 2022; Accepted Date: August 09, 2022; Published Date: August 18, 2022
*Corresponding author: Brian Serrano, Chicago Bulls Basketball Organization. Email: brianserrano171@gmail.com
Citation: Serrano B, Comer M, Puls G (2022) Athletic Monitoring in Basketball: A Qualitative Exploratory Approach. Adv Ortho and Sprts Med: AOASM-169.
DOI: 10.37722/AOASM.2022302
Abstract
The competitiveness of sport continues to increase with the corollary increase in sport technology. Sport technology is an umbrella that encompasses biometrics, wearable technology, and data analytics. Central to sport technology is a close relative, sport analytics. If sport technology is the general term for measuring what the athlete is experiencing from a performance standpoint, then sport analytics is the process of cleaning, processing, and manipulating these variables into meaningful output. The number of variables that can be collected are extensive but can be generally categorized into internal and external metrics. Internal metrics seek to measure how the athlete responds to training load (HR, HRV, Hormones, Sleep patterns). External metrics seek to measure how much work the athlete is performing (Live player tracking, Countermovement Jump, Isometric Mid-Thigh Pull). Internal and external metrics are continually evolving in the manner they are collected which depends on the time, resources, and staff allocation of an organization. This is where the collaboration between sport scientists and sport performance staff can come together to overlay variables and find relationships. There is no correct way to analyze data because each organization will have their own goals. For example, data could be used for injury mitigation, readiness assessment, or simply to establish baseline values. Some common statistical techniques that can be used include correlation, regression, and principal component analysis (PCA). However, performing these calculations may be complex and some organizations may lack a practitioner which can limit their ability to use data. In seeing this gap, the authors propose a qualitative approach to workload monitoring made for basketball but can be applied to most sports. The purpose of this paper is to empower sports performance staffs to learn and implement the basics of qualitative athletic monitoring approach.
Introduction
The quest to become better in team and individual sport is becoming magnified by the exponential increases in technological advanced made available to organizations [1]. Over the last 25 years, there have been large advances which have revolutionized the way sports data is looked at. Furthermore, the number of numerical streams available to coaches, agents, and performance staff has also increased. Agents can track their clients ‘stats in real-time, coaches can track sport specific metrics, and performance staff can track plater progress. The term Data Science is an umbrella term that encompasses the field of mathematics and statistics that provides useful information based on large amounts of complex data. This combination of math, statistics, and computer science allows data to be leveraged for decision-making purposes. The main purpose of data science within sport will be referred to as “sport science” from this point forward to recognize the intricacy and specificity of leveraging numbers for human performance. The sport scientist is a position is its infancy and most organizations do not yet have a dedicated practitioner in this role [2]. It usually falls on the strength and conditioning coach to collect, clean, and visualize data. Data science within sport focuses on collecting biometrics to reflect the human (biology) behind the metric [3]. Biometrics can be categorized into internal and external metrics. External metrics seek to quantify how much work the athlete is performing (athletic workload) and common instruments include live player tracking, GPD, and LPS [4]. Internal metrics seek to quantify the athlete’s response to said workload through means such as max heart rate and heart rate variability [5]. Recently, there have been tools that seek to measure other athletic qualities such as isometric strength, fatigue, and neuromuscular fatigue. Common isometric strength measures include the hamstring, hip abductors, and hip adductors however the principle can be applied to any relevant muscle group [6]. Fatigue and neuromuscular readiness are indirect measures of current athletic states and are assessed through measures such as countermovement jumps and squat jumps [7]. We can see how the number of biometrics available to practitioners has become large, and some may argue redundant. The important question to address now becomes which of these biometrics is the most important and how do these numbers improve athletic performance.
External Workload Metrics
The purpose of external workload metrics is to quantify how much work an athlete is performing [8]. This allows the performance team to begin programming and creating decisions around this information. Common metrics of external workload include live player tracking, GPS, and LPS systems. Live-player tracking has become common place in higher levels of basketball (NCAA D1, Professional) [9]. Kinexon is one such example and its metrics include total distance, sprints, and metabolic intensity [10]. Kinexon data can be used to establish normative values for each metric, position, and player. This information can function as a decision support system in training and game preparation. The NBA as an example has the advantage of knowing their game schedule and frequency (3.5/week) ahead of time which can help periodize the amount of target for each practice and training session [11]. This is where load management becomes important since performance staff can see which players are under stimulated or over stimulated and adjust accordingly.
Internal Workload Metrics
Internal metrics investigates how the athlete responds to a certain stimulus [12]. This is usually done through metrics like heart rate (HR) and heart rate variability (HRV) [13]. Heart rate metrics are becoming increasingly accessible to users in via smartwatches, rings, and bands. Some companies augment heart rate by also giving a sleep score which is also known as recovery score. The higher a recovery score, the better rested an athlete is and theoretically ready for optimal performance [14]. Other metrics available include maxHR, averageHR, and exploratory metrics into HRV. The basis of HRV is how quickly an athlete’s heart rate can spike up during stress and subsequently come back to resting values [15]. The quicker this return to baseline occurs and the larger the difference between both values the more fit an athlete is. Finally, there has been a push toward indirect measure of readiness through the use of portable force plates. Portable force plates are the ideal modality to test jumps and conduct isometric force tests such as the mid-thigh pull (IMTP). Of these tests, the countermovement jump (CMJ) is the most studied and can track athlete readiness through changes in their metrics [16]. Metrics evaluated can range from superficial jump height to in-depth eccentric duration and eccentric rate of force development. It is easy to see how both styles of workload metrics yield valuable information. It is up to the sports science and performance staff to create meaningful interpretations of said data.
| The Quantitative Approach | Total Training Session Load |
| Drill #1: 1 intensity x 10 minutes= 10 AU |
Total= 200 AU |
| Drill #2: 3 intensity x 15 minutes= 45 AU | |
| Drill #3: 3 intensity x 15 minutes= 45 AU | |
| Drill #4: 4 intensity x 10 minutes= 40 AU | |
| Drill #5: 4 intensity x 15 minutes= 60 AU |
The Quantitative Approach to Sport Science
There is much value that can be discovered through external and internal metrics of workloads. The sport performance staff can use techniques like data mining to discover patterns in existing data [17]. In addition, existing data can be used to create sophisticated forecasts of where player performance is going or how recovered the player may be at the end of a long road trip. Some common quantitative approaches include performing correlation, regressions, and principal component analyses (PCA) [18]. Correlations can be performed between two variables to see if they are related. For example, the relationship between total sprints and heart rate variability can be explored through a correlation. More in-depth, the regressions like to establish a causal relationship between two or more variables [19]. A player’s mechanical intensity can be regressed with their jump height to see how the intensity of a training session impacts their state of readiness. Or the performance staff can narrow down a multitude of metrics such as the countermovement jump (CMJ) into the most relevant variables using a PCA [20]. However, most importantly, it is the duty of the performance staff to overlay and explore these variables and truly explore the relationship between each metric. This allows for meaningful data exploration rather than siloed data interpretation. Yet not every organization will have access to the technology and resources needed to perform advanced quantitative techniques to explore athletic monitoring. Identifying this gap in the literature, the authors have created a qualitative framework for practitioners at all levels that are resource-inclusive to still monitor workload and improve athletic performance.
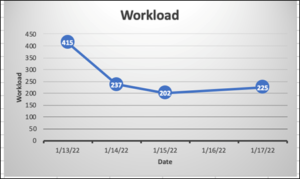
Figure 1: Weekly Workload.
The Qualitative Approach to Sport Science
Since many organizations and performance staffs may not have adequate access to advanced quantitative approaches, the authors seek to add value by creating a qualitative approach. The qualitative approach is still based on sound scientific principles and has the potential to be a useful tool for athlete monitoring. This approach has been named “The Qualitative Approach” to promote its usefulness and simplicity while identifying its primary weakness. It takes from previous work performed by Bove (2021) and extensive work done by Gabbett [21]. The work by Bove (2021) establishes the quadrant system which puts athletes into 1 of 4 quadrants of work achieved. Based on which quadrant the athlete falls into dictatestheir amount of stimulation for a game. As it applies to basketball, if a player has played a certain number of minutes, they met a threshold which warrants rest and recovery. A player that is under-stimulated may require additional work to maintain levels of fitness. Conversely, a player that is over-stimulated may require additional regeneration strategies to be ready for the next competition. Gabbett’s work adds to this the acute: chronic workload ratio, which although proven to be flawed can give the performance team a sense of rolling average [22]. Rolling averages can then be used to guide training sessions while being mindful of on-court performance. According to this work, optimal stimulation is defined as 0.8-1.3 which is the result of dividing the acute workload (7 days) by the chronic workload (28 days). Similarly, values under 0.8 indicate under stimulation while values over 1.3 indicate over stimulation.
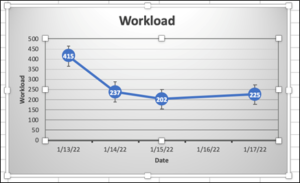
Figure 2: Weekly Workload with Standard Deviation
Practical Applications of the Qualitative Approach
The NBA season consists of 82 regular season games with a weekly average of 3.5 games and the NBA G-League consists of 50 gameswith a weekly average of 2.5 games per week. Even though the qualitative approach can be applied to other team sports, the authors are domain experts in basketball performance thus the example will follow this sport. The basis of the qualitative approach follows using the coaching staff to create consistency and standards within each practice session. Each basketball practice session is organized into different drills (walk through, teaching, scripted drills, live play). The performance coach asks the coach to rate each drill on a scale from 1-5 (1 being the easiest to 5 being the hardest) in regard to intensity and is adopted from the work of Borg [24]. The drills intensity is then multiplied by the amount of time spent in it; and then all drills are added for a total cumulative workload (See Table 1). Each day’s training workload can then be tracked through the week to ensure the team is well rested enough for optimal on-court performance. Over time, the coaching and performance staff may establish normative values (in arbitrary units) for what easy and hard days will look like and what each stimulus will entail. More importantly, this allows the performance staff to program recovery and regeneration ahead of time to best prepares for games (See Figure 1).
Limitations
Although the qualitative approach is a simple and accessible way for performance coaches to monitor athletic workload within team sports, there are limitations. One such limitation is the subjectivity of this method. Since this method is based on the subjective rating from one person, it is susceptible to user error since “intensity” is subjective. Another limitation is the subjective-RPE which only allows for a rating of 1-5. This is also susceptible to intensity discrepancy rather than if the scale would be from 1-10.
Conclusions
Being able to quantify workload within team sports in one important aspect of tracking athlete stress [24]. There are various approached to athletic monitoringsuch as statistical forecasting with data mining techniques and regressional models. From a quantitative approach, technology such as force plates, live player tracking, and heart rate variability are available for data collection. However, not all organizations will have access to this technology or the means to analyze it which is where the qualitative approach comes in [25]. This approach allows the performance staff to measure workload and have objectivity when it comes to programming training and practice sessions during the week and season. By having a better sense of player stress, the performance and coaching staff can plan for optimal court performance.
References
- Omoregie PO (2016) THE IMPACT OF TECHNOLOGY ON SPORT PERFORMANCE. 896.
- Bernards JR, Sato K, Haff GG, Bazyler CD (2017) Current Research and Statistical Practices in Sport Science and a Need for Change. Sports 5: 87.
- Balagué N, Torrents C, Hristovski R, Kelso JAS (2016) Sport science integration: An evolutionary synthesis 17: 51-62.
- Emani MK, Wang Z, O’Boyle MFP (2013) Smart, adaptive mapping of parallelism in the presence of external workload. Proceedings of the 2013 IEEE/ACM International Symposium on Code Generation and Optimization, CGO 2013.
- Seshadri DR, Li RT, Voos JE, Rowbottom JR, Alfes CM, et al. (2019) Wearable sensors for monitoring the internal and external workload of the athlete. Npj Digital Medicine 2: 1-18.
- Lum D, Barbosa TM (2019) Brief Review: Effects of Isometric Strength Training on Strength and Dynamic Performance. International Journal of Sports Medicine 40: 363–375.
- Claudino JG, Cronin J, Mezêncio B, McMaster DT, McGuigan M, wt al. (2017) The countermovement jump to monitor neuromuscular status: A meta-analysis. Journal of Science and Medicine in Sport 20: 397-402.
- Rico-González M, Arcos AL, Rojas-Valverde D, Clemente FM, Pino-Ortega J (2020) A Survey to Assess the Quality of the Data Obtained by Radio-Frequency Technologies and Microelectromechanical Systems to Measure External Workload and Collective Behavior Variables in Team Sports. Sensors 20: 2271.
- Scanlan AT, Dascombe BJ, Reaburn P, Dalbo VJ (2012) The physiological and activity demands experienced by Australian female basketball players during competition. Journal of Science and Medicine in Sport 15: 341-347.
- Blauberger P, Marzilger R, Lames M (2021) Validation of Player and Ball Tracking with a Local Positioning System. Sensors 21: 1465.
- Nutting AW (2009) Travel Costs in the NBA Production Function 11: 533-548.
- Simpson MJ, Jenkins DG, Scanlan AT, Kelly VG (2020) Relationships Between External- and Internal-Workload Variables in an Elite Female Netball Team and Between Playing Positions. International Journal of Sports Physiology and Performance 15: 841-846.
- Dong JG (2016) The role of heart rate variability in sports physiology (Review). Experimental and Therapeutic Medicine 11: 1531-1536.
- Bird SP (2013) Sleep, recovery, and athletic performance: A brief review and recommendations. Strength and Conditioning Journal 35: 43-47.
- van Ravenswaaij-Arts CMA, Kollee LAA, Hopman JCW, Stoelinga GBA, van Geijn HP (1993) Heart rate variability. Annals of Internal Medicine 118: 436-447.
- Watkins CM, Barillas SR, Wong MA, Archer DC, Dobbs IJ, et al. (2017). Determination of vertical jump as a measure of neuromuscular readiness and fatigue. Journal of Strength and Conditioning Research 31: 3305-3310.
- Agarwal S (2014) Data mining: Data mining concepts and techniques. Proceedings – 2013 International Conference on Machine Intelligence Research and Advancement, ICMIRA 2013, 203-207.
- Yan X, Gang Su X (2009) Linear regression analysis: Theory and computing. Linear Regression Analysis: Theory and Computing, 1-328.
- Ludbrook J (2010) Linear regression analysis for comparing two measurers or methods of measurement: But which regression? Clinical and Experimental Pharmacology and Physiology 37: 692-699.
- Abdi H, Williams LJ (2010) Principal component analysis. Wiley Interdisciplinary Reviews: Computational Statistics 2: 433-459.
- Bourdon PC, Cardinale M, Murray A, Gastin P, Kellmann M, et al. (2017). Monitoring Athlete Training Loads: Consensus Statement. International Journal of Sports Physiology and Performance 12: S2-161.
- Hulin BT, Gabbett TJ, Lawson DW, Caputi P, Sampson JA (2016) The acute:chronic workload ratio predicts injury: high chronic workload may decrease injury risk in elite rugby league players. British Journal of Sports Medicine 50: 231-236.
- Williams N (2017) The Borg Rating of Perceived Exertion (RPE) scale. Occupational Medicine, 67(5), 404-405.
- Boltz AJ, Powell JR, Robison HJ, Morris SN, Collins CL, Chandran A (2021) Epidemiology of Injuries in National Collegiate Athletic Association Men’s Baseball: 2014–2015 Through 2018–2019. Journal of Athletic Training 56: 742-749.
- The Quadrant System: Navigating Stress in Team Sport (PAPERBACK) | Athlete Framework. (n.d.). Retrieved July 26, 2022.
