Publication Information
ISSN 2691-8803
Frequency: Continuous
Format: PDF and HTML
Versions: Online (Open Access)
Year first Published: 2019
Language: English
| Journal Menu |
| Editorial Board |
| Reviewer Board |
| Articles |
| Open Access |
| Special Issue Proposals |
| Guidelines for Authors |
| Guidelines for Editors |
| Guidelines for Reviewers |
| Membership |
| Fee and Guidelines |
 |
Assessing the Efficacy of Covid-19 Policies in the Philippines
Lim Chris*
British School Manila, Philippines
Received Date: August 10, 2021; Accepted Date: August 19, 2021; Published Date: August 25, 2021;
*Corresponding author: Lim Chris, British School Manila, Philippines. Email: chris.lim@britishschoolmanila.org
Citation: Chris L (2021) Assessing the Efficacy of Covid-19 Policies in the Philippines. Adv Pub Health Com Trop Med: APCTM-126.
DOI: 10.37722/APHCTM.2021202
Abstract
This research assessed the efficacy of the Philippine government’s COVID-19 policies by calculating the regional and national effective reproduction number (Rt) after the implementation of government policies. Rt was obtained through using a model with a Bayesian framework, which is an approach that creates probabilistic models based on existing evidence. The model, known as “EpiEstim”, provides estimates through analyzing the daily incidence of cases within predefined time periods. The effects of stringency on nationwide transmissibility were determined by analyzing the bi-variate relationship between the Government Stringency Index (OxCGRT) with the estimated nationwide Rt values, between February 6, 2020 and March 3, 2021. This study is relevant because the Philippine government’s response to COVID-19 is known to be one of the most prolonged and stringent approaches to the pandemic, and a quantitative measure of the efficacy of the government’s policies can help determine whether these approaches can mitigate the impact of outbreaks in the future. Regionally, the implementation of government policies has led subsequent Rt values to approximately return to the critical threshold of 1.0 in 10 out of the 16 dates tested. These Rt values ranged between 0.82 and 3.05. Nationally, the level of stringency approximates a negative correlation with transmissibility, most notably between March 6, 2020 and April 6, 2020. Many of the government’s policies can be considered as delayed responses as they were implemented several days after Rt first deviated from the critical threshold of 1.0.
Keywords: COVID-19; Effective reproduction number; Stringency; Transmissibility
Introduction
Following the first wave of COVID-19 cases in the Philippines beginning mid-March, the government’s response consisted heavily of enhanced community quarantines, closure of schools nationwide, and travel restrictions. These approaches have often been questioned by experts and the general public [1].
The main criticism against the Philippine government’s COVID-19 response has been its draconian and prolonged nature, deemed one of the harshest approaches to COVID-19 in Southeast Asia, if not, the world [2]. As a result of severely restricting the country’s economic activity, the economy of the Philippines has experienced a significant recession, with the GDP having contracted by 9.6% year-on-year. Considering this magnitude of decline has not been reached for over 70 years, this has further accentuated the criticism against the government’s response [3].
Hence, this research focused on analyzing the relationship between the stringency of the Philippine government’s COVID-19 policies and the country’s nationwide transmission rates. In addition, the efficacy of policies have been assessed according to region through a close analysis of five major dates of policy implementation. Through adopting a Bayesian approach to model transmissibility, this research has been conducted with the hopes of providing an objective insight into whether the Philippine government’s response has been effective or justified.
Methodology
Data Collection
The Philippine Department of Health (DOH) provides data on the daily cases by date of onset of illness through its nationwide COVID-19 Tracker web page. This research paper considered the five most infected regions in the country as of July 2021 according to the tracker – National Capital Region (NCR), Region IV-A: Calabarzon, Region III: Central Luzon, Region VII: Central Visayas, and Region VI: Western Visayas – as separate cohorts of the population with unique transmission properties. These were the only regions considered in this paper. The effective reproduction number (Rt) values between the date of implementation to two weeks after implementation have been monitored for several policies affecting these regions, which quantifies the effect of government policies in terms of reducing transmissibility.
This paper analyzed the bivariate relationship between the stringency of government response and transmission rates. This has been achieved by collecting the values of the Government Stringency Index (OxCGRT) between February 6, 2020 and March 3, 2021, and comparing these with the value of Rt for nationwide cases. This has been used to quantify the effect that stringency has on transmissibility. Dates beyond March 4, 2021 were not considered nationally as they marked the beginning of vaccination efforts within the country.
Five dates of major policy implementations have been chosen as the sample data, which was collected from the catalog of COVID-19 updates provided on the Department of Health (DOH) web page. When choosing the constituent dates for the sample, only policies that have significantly affected the socio economic activity of regions have been considered – therefore, relatively minor policies (e.g: guidelines, reiteration, updating retail prices) have not been considered as major policies, and thus, were not included in the sample data. The main types of policies considered include but are not limited to: travel bans, community quarantines, restricted industries, etc. The implementation dates, considered independent of calendar time, were equal to t = 1 in the model used to calculate Rt – the first day out of the 14 days measured for each implemented policy.
Statistical Analysis
The research paper used the effective reproduction number (Rt) as a means of measuring transmissibility, where it represents the average number of secondary cases originating from a primary case, taking into account the various factors that affect susceptibility within a population. If the Rt value is greater than 1.0, it indicates a growing epidemic, and if the Rt value is lower than 1.0, it indicates a declining epidemic. This is separate to R0 – the basic reproduction number – which assumes uniform susceptibility for each individual in the population and disregards. Rt was calculated using a simple branch processing model where it is considered as a function of time t with 95% confidence intervals, independent of calendar time. According to “EpiEstim” (Cori et al., 2019, 2013; R Core Team, 2019), which was the model used in this paper, it was assumed that the serial interval distribution followed a gamma distribution with a mean (μsi) of 4.8 and standard deviation (σsi) of 2.3 [4].
The equation for the effective reproduction number used in the model is shown below: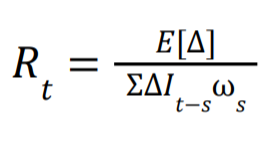
- E[∆] = expected number of new infections in day
- Σ∆It-sωs = weighted average of the number of secondary cases caused by previous new infections, weighted by the probability distribution of the serial
For each individual policy assessed on the five major policy implementation dates, Rt was considered as the case reproduction number, which measures the transmission between a select cohort of individuals within a population. This is necessary as the cases are divided by regions. On the other hand, for the analysis of stringency in relation to transmissibility, Rt was considered as the instantaneous reproduction number, which measures the transmission of a population without subdivided cohorts at a specific point in time. This is because cases are considered on a nationwide scale which reflects transmission properties of the entire population.
To estimate Rt, the model generated a function of time t, where t = 1 is equal to the date of policy implementation, independent of calendar time. Each value of Rt was the mean of a seven-day sample. Therefore, each two-week interval tested yielded seven Rt values, with the first between t = 1 and t = 7, and the last between t = 7 and t = 14. Graphical representations also include the minimum and maximum values of Rt based on the respective quantiles calculated through the model.
Quarantine Policies
The Philippine government’s response primarily consists of community quarantines with varying levels of severity [5]. The four categories of quarantines in decreasing level of severity are:
- Enhanced Community Quarantine (ECQ)
- Modified Enhanced Community Quarantine (MECQ)
- General Community Quarantine (GCQ)
- Modified General Community Quarantine (MGCQ).
Travel Restriction Policies
The travel restriction policies implemented by the government can be categorized into those affecting domestic travel, international departure, and international entry. Since most of the travel policies implemented were the gradual addition or removal of country-specific restrictions, a vast majority were not considered significant enough to create a new function for Rt.
Sample Data
The policies considered as significant enough for the sample data have been listed below. As mentioned above, each date listed below is equal to t = 1 in their respective Rt functions.
| Policy Implementation Dates |
| March 16, 2020 (NCR, Region IV-A, Region III):
First Enhanced Cormnunity Quarantine (ECQ) i1nplemented in Luzon, which includes National Capital Region (NCR), Region IV-A: Calabarzon, and Region Ill:Central Luzon [6]. Land, domestic air, and domestic sea travel within Metro Manila suspended until April 14, 2020 (international departures permitted) [7]. |
| April 30, 2020 (Region VII, Region VI):
Executive Order No. 112, s. 2020 -ECQ restrictions i1nple1nented in Region VII: Central Visayas and Region VI: Western Visayas [8]. |
| January 15, 2021:
Travel ban expand to 35 countries, namely: Australia, Austria, Brazil,Canada, China, Denmark, Finland, France, Gennany, Hong Kong, Iceland, India, Ireland, Israel, Italy, Jamaica, Japan, Jordan, Lebanon, Luxe1nbourg, Netherlands, Norway, Oman, Pakistan, Portugal, Singapore, South Africa, South Korea, Spain, Sweden, Switzerland, United Kingdo1n, and United States [9]. |
| February 12, 2021:
The Inter-Agency Task Force for the Management of Emerging Infectious Diseases (IATF-EID) allows thereopening of select public facilities under General Community Quarantine. Seating capacity for religious gatherings in GCQ areas has increased to 50% [10]. |
| March 29, 2021 (NCR):
NCR shifts from MGCQ to ECQ due to asurge in cases. [11]. |
Results
Impact of Stringency on Nationwide Rt
A graphical representation of the bi-variate relationship between OxCGRT and Nationwide Rt has been provided below.
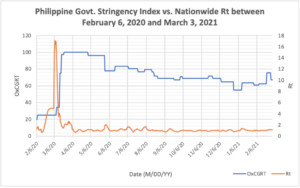
Figure 1: A graphical representation of the OxCGRT vs. Rt for nationwide cases between February 6, 2020 and March 3, 2021.
Impact of Policies on Regional Rt
Graphical representations of Rt by each region affected by major policy implementations have been provided below. The critical threshold (1.0) has been denoted with a dotted line in each graph. Each data value is equal to the mean of 7 consecutive days, therefore, Rt values are only provided for a one-week period after the implementation date. The range of Rt for each date has been denoted through a shaded area.
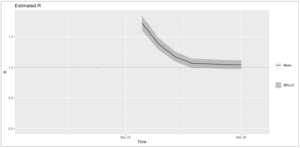
Figure 3: A graphical representation of estimated Rt values in National Capital Region (NCR), between March 16, 2020 and March 30, 2020.
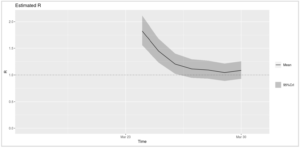
Figure 4: A graphical representation of estimated Rt values in Region IV-A: Calabarzon, between March 16, 2020 and March 30, 2020.
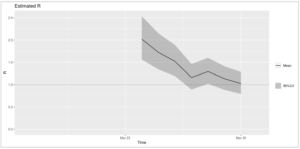
Figure 5: A graphical representation of estimated Rt values in Region III: Central Luzon, between March 16, 2020 and March 30, 2020.
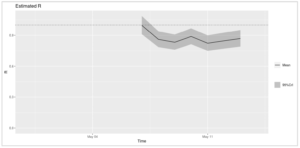 Figure 6: A graphical representation of estimated Rt values in Region VII: Central Visayas, between April 30, 2020 and May 14, 2020.
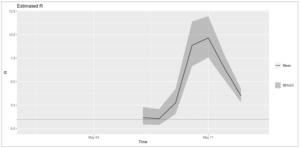 Figure 7: A graphical representation of estimated Rt values in Region VI: Western Visayas, between April 30, 2020 and May 14, 2020.
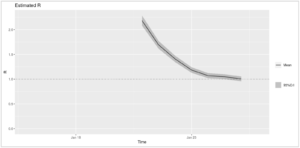
Figure 8: A graphical representation of estimated Rt values in National Capital Region (NCR), between January 15, 2021 and January 29, 2021.
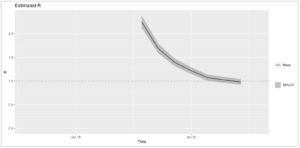
Figure 9: A graphical representation of estimated Rt values in Region IV-A: Calabarzon, between January 15, 2021 and January 29, 2021.
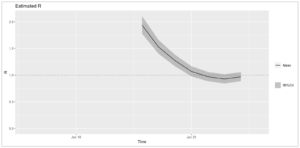
Figure 10: A graphical representation of estimated Rt values in Region III: Central Luzon, between January 15, 2021 and January 29, 2021.
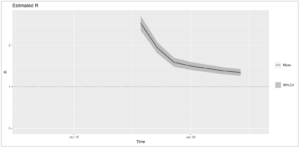 Figure 11: A graphical representation of estimated Rt values in Region VII: Central Visayas, between January 15, 2021 and January 29, 2021.
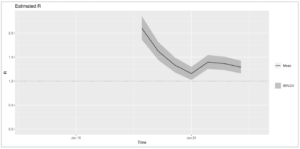 Figure 12: A graphical representation of estimated Rt values in Region VI: Western Visayas, between January 15, 2021 and January 29, 2021.
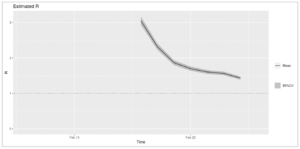 Figure 13: A graphical representation of estimated Rt values in National Capital Region (NCR), between February 12, 2021 and February 26, 2021.
 Figure 14: A graphical representation of estimated Rt values in Region IV-A: Calabarzon, between February 12, 2021 and February 26, 2021.
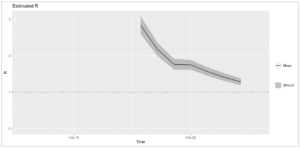 Figure 15: A graphical representation of estimated Rt values in Region III: Central Luzon, between February 12, 2021 and February 26, 2021.
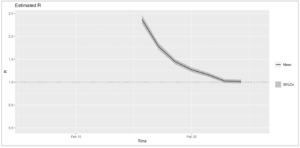 Figure 16: A graphical representation of estimated Rt values in Region VII: Central Visayas, between February 12, 2021 and February 26, 2021.
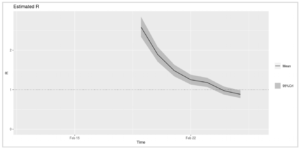 Figure 17: A graphical representation of estimated Rt values in Region VI: Western Visayas, between February 12, 2021 and February 26, 2021.
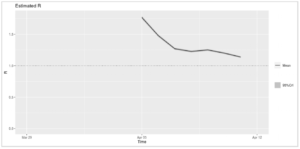 Figure 18: A graphical representation of estimated Rt values in National Capital Region (NCR), between March 29, 2021 and April 12, 2021.
Discussion
Regionally, the implementation of government policies has led subsequent Rt values to approximately return to the critical threshold of 1.0 in 10 out of the 16 dates tested, and the majority of Rt values ranged between 0.82 and 3.05. The only anomaly to this occurred in Region VI on April 30, 2020, but this was expected as the daily incidence ranged between 0 to 3 before the sudden spike of 37 cases on May 10, 2020.
The National Capital Region, despite having the highest daily incidence among all the regions tested, seems to have the most consistent decrease towards the critical threshold of 1.0 when policies are implemented. This can be attributed to the higher funding and prioritization allocated to NCR in comparison to other regions due to its dense population. Similar properties can be observed in the Luzon regions (i.e. Region IV-A and Region III), as measures implemented were often grouped by island groups, as observed on March 16, 2020.
Region VII and Region VI, on the other hand, had a lower daily incidence of cases but had more volatile Rt values in response to policy implementations. This could potentially be due to multiple reasons: less stringent measures, testing facilities to detect confirmed cases, etc. Nonetheless, policies implemented in these regions have also led to many cases of returning to the critical threshold of 1.0.
Nationally, the first notable increase in Rt began on February 14, 2020, when the Rt value increased from 0.68 to 4.99 by March 5, 2020. OxCGRT values were consistently at 25.00 during this period. This was then followed by another increase on March 6, 2020, where the Rt value increased from 4.99 to a peak of 17.12 on March 7, 2020. In response to this, the OxCGRT index rose from 25.00 on March 5, 2020, and abruptly increased to 100.00 by March 25, 2020. This consequently led to a drop in the Rt value from 16.91 in March 9, 2020 to 1.42 in March 20, 2020. From then on, Rt values have remained stable at approximately 1.0 (the critical threshold), with a few peaks ranging from 1.33 to 2.62 in the following months. With OxCGRT values ranging from 55.09 to 100.00, the country has experienced no significant deviation from the critical threshold of Rt since April 1, 2020.
Therefore, the level of stringency approximates a negative correlation with transmissibility, with lower OxCGRT values leading to higher Rt values and higher OxCGRT values leading to lower Rt values in subsequent days. The most evident time period that demonstrates this is between March 6, 2020 and April 6, 2020. Based on this relationship, although the government’s interventions can evidently be associated with decreases in transmissibility, their policies were considerably delayed as they were mostly implemented several days after Rt first deviated from the critical threshold of 1.0.
Conclusion
The findings of this paper suggest that the Philippine government’s COVID-19 policies have been directly associated with the reduced spread of the epidemic within the country. However, one shortcoming has been the timing of implementations, as many cases could have been averted if the same stringent measures were implemented a few days earlier. This not only could have lowered the number of confirmed cases, but also limited the need for measures to be implemented during the later phases of the pandemic.
It is also important to consider the consequences that have resulted from the pandemic as well, which would have motivated the government to adopt a less stringent approach towards the later phases of the pandemic. This can be attributed to the fluctuations in Rt in these phases, and although this paper did not fully assess the surge in cases beginning late March, this serves as evidence for the consequences of lenient measures implemented during a time of high transmission. The opposite (i.e. the consequences of stringent measures during lower transmission) is exemplified by the public demonstrations, unemployment, and the economic recession experienced by the country [12, 13, 14]
In addition, potential inaccuracies of the data provided by the Department of Health (DOH) also limit this paper’s findings. This is due to delays in reporting, which is addressed in the web page itself. If a significant portion of cases, both symptomatic and asymptomatic, were left untested for a prolonged period of time, this not only would have led to inappropriate policy implementations for the actual transmission rates, but it would have also led to inflated Rt values, as these cases would be detected as one large group in a later time (which would have falsely indicated a spike).
Overall, the Philippine government’s COVID-19 policies as a whole has been successful in reducing transmission to a degree where it has remained in the critical threshold of Rt ≈ 1.0 for a sustained period of time. However, many cases could have been further averted if the significance of untested cases were considered more when implementing policies. These untested cases have collectively led to the Rt values to spike for short periods of time, and although it was immediately followed by stringent measures, the days in which lenient measures were tolerated during exceptionally high transmission rates is a critical reason explaining why COVID-19 has spread uncontrollably throughout the country. These are factors that the Philippines and other countries must consider for epidemics that will potentially emerge in the future.
Bibliography
- See, “Inside One Of The World’s Longest COVID-19 Lockdowns”. Time, 2021.
- Biswas Rajiv (2021) “Philippines Economy Hit By Rising COVID-19 Wave”. IHS
- Anne Cori, Neil M Ferguson, Christophe Fraser, Simon Cauchemez (2013). “A new framework and software to estimate time-varying reproduction numbers during ” American journal of epidemiology 178:1505-1512.
- Hiroshi Nishiura, Tetsuro Kobayashi, Takeshi Miyama, Ayako Suzuki, Sung-Mok Jung, et al. (2020). “Estimation of the asymptomatic ratio of novel coronavirus infections (COVID-19).” International journal of infectious diseases 94:154-155.
- Maingat, “Know The Difference: ECQ, MECQ, GCQ, MGCQ In The Philippines”. Carpo Law & Associates, 2021.
- Arianne Merez, ABS-CBN “Luzon Under Enhanced Community Quarantine As COVID-19 Cases Rise”. ABS-CBN News, 2021.
- Luna, “Metro Manila Quarantined For 30 Days As Alarm Heightens Over COVID-19”. Philstar.Com, 2020.
- “Executive Order 112, S. 2020”. Officialgazette.Gov.Ph, 2021.
- “New Covid Variant: Philippine Travel Ban On India, Pakistan, UAE Flyers”. Khaleej Times, 2021.
- “IATF Allows Cinemas, Game Arcades To Operate In GCQ Areas”. Cnn.Com, 2021.
- Garcia, “Duterte Declares Areas Under MECQ, GCQ Due To COVID-19 Surge”. GMA News Online, 2021.
- “Philippines: Protests May Occur Nationwide, Especially Metro Manila, March 17 To Mark Anniversary Of First Enhanced Community Quarantine”. Gardaworld,
- “Deaths, Arrests And Protests As Philippines Re-Emerges From Lockdown”. Mongabay Environmental News,
- “PH records lowest unemployment rate since COVID-19 peak”. The National Economic And Development Authority,