Publication Information
ISSN 2691-8803
Frequency: Continuous
Format: PDF and HTML
Versions: Online (Open Access)
Year first Published: 2019
Language: English
| Journal Menu |
| Editorial Board |
| Reviewer Board |
| Articles |
| Open Access |
| Special Issue Proposals |
| Guidelines for Authors |
| Guidelines for Editors |
| Guidelines for Reviewers |
| Membership |
| Fee and Guidelines |
 |
An Assessment of Coastal Erosion and Impact of Surge Level at Sonadia Island
Farhana Khadiza1*, Navila Afsari1, Nabila Tabassum1, Md. Monzurul Hasan2
1Graduate Student, Institute of Water and Flood Management, Bangladesh University of Engineering and Technology, Junior Engineer, Institute of Water Modelling
2Graduate Student, Water Resources Engineering, Bangladesh University of Engineering and Technology
Received Date: February 27, 2023; Accepted Date: March 10, 2023; Published Date: March 16, 2023;
*Corresponding author: Farhana Khadiza. Graduate Student, Institute of Water and Flood Management, Bangladesh University of Engineering and Technology, Junior Engineer, Institute of Water Modelling. Email: fkl91.bd@gmail.com
Citation: Khadiza F, Afsari N, Tabassum N, Hasan M (2023) An Assessment of Coastal Erosion and Impact of Surge Level at Sonadia Island. Enviro Sci Poll Res and Mang: ESPRM-128.
DOI: 10.37722/ESPRAM.2023102
Abstract
Sonadia Island is a geologically important crescent-shaped island off the Cox’s Bazar coast which is on the east is the Moheskhali Channel estuary and on the west is the Kutubdia Channel estuary. The island is surrounded by East and West neighborhoods having 2000 habitats. Its pristine sandy beach, mudflats, near-shore sandbars, high dunes, and mangrove forest. The formation of the island is unique serving as an important habitat for endangered species. The study area lies in the inter-tidal coastal wetlands with a wide range of ecosystems which is protected as ECA comprising IBA. The island is interspersed with numerous tidal creeks and rivers. The study is an attempt to assess the morphological as well as the cyclonic condition of Sonadia Island. The morphological condition was assessed considering the net amount of deposition and erosion. The coastal morphology around the island has been analyzed by considering satellite images and also from Google Earth for the different periods of at least 50 years. Through the analysis, it was observed that the coastal morphology is dominated by the longshore sand transport or littoral drift, which is driven by the incoming waves. The northwest part of Sonadia coastline beach has been found eroded. The geological condition of the island is full of silvery sand with small sand mounds. Mike Storm Surge model was simulated to analyze the surge level in the different return periods. Sonadia Island is a biodiversity hotspot that is currently free from anthropogenic impacts such as development and tourism. As the Island is of geological importance and GoB has taken initiative to covert the place into an ecotourism spot. On that note, study on coastal erosion is priory important.
Keywords: Ecosystem; Erosion; Estuary; Morphological Condition
Introduction
Bangladesh is bounded on the south by the Bay of Bengal. The coastline of Bangladesh is about 710 km long. 30% of total population lives in Coastal areas of Bangladesh [1]. Coastal erosion now-a- days have become an emerging threat to the Coastal region. It occurs when the waves that lap at the coast slowly wear away the shoreline. As these waves wash over the shore, they carry sand and sediments with them and thus erode the floor of the beach [2]. In most cases erosion occurs due to natural causes like see level rise but there are cases of erosion due to interference of nature by men [3]. Erosion can be deteriorated by several factors like high winds, wave currents, tidal currents etc. As these conditions are common in Bangladesh finding ways to stop coastal erosion is much more important for the coastal inhabitants. In recent years coastal erosion has resulted in damage and loss of agricultural land, mangrove forests, houses and recreation beaches. Sonadia Island is a potential deep-water port lying on the Bay of Bengal that could serve the landlocked parts of India, Myanmar and China. Bangladesh Economic Zones Authority (BEZA) has recently unveiled its new plan to go ahead with constructing an ecotourism center at Sonadia Island [4]. But this economically important area is very prone to erosion. The Average erosion per year varies from 4m to 6m [5]. The study is an attempt to assess the erosion condition of Sonadia Island as a perspective of the erosion management plan of the coastal area of Bangladesh.
Materials and Methods
Study Area
Sonadia Island is a small island of about 9 square kilometers which is located on the south-east corner of Bangladesh. The length of the island is about 12 km and the width varies between 2 to 4 km. Most of the places of the study area is mangrove forest and salt farm.
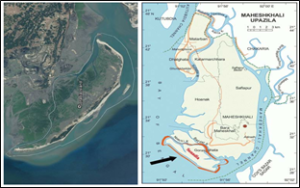 Figure 2.1: Location of Sonadia Island in Moheshkhali Upazila of Cox’s Bazar district, Bangladesh.
The morphology of the area is very dynamic. Continues erosion-deposition is going on and the land accretion process being the dominant process over the year. The soil of this area is the admixture of sand and clay in varying proportion. The soil of the North part is clay and is inundated by sea water. The entire soil condition of the South part is almost sandy [13]. Maximum average suspended sediment concentration varies from 0.06 g/l to 0.5 g/l during spring tide in the Badar Khal. During neap tide, the sediment concentration varies between 0.02 g/l to 0.095 g/l. The whole island has a mild temperature and high humidity. The maximum rainfall is 925 mm which occurs in the month of July and the average monthly rainfall of July the wind and atmospheric pressure variations are responsible for the generation of waves, surges and wind-generated currents [7]. The Maximum avg. wind speed varies from 10.6 m/s to 11.8m/s whereas, during dry season it varies from (7.7~8.8) m/s [7]. Offshore loss during extreme wave and storm surge conditions. The high waves cause the bars to move seawards and the high storm surge also cause offshore movement of sand due to non-equilibrium in the profile under the high surge.
The hydrology of the study area is influenced by semi-diurnal tides with two tidal cycles in a day. The maximum tidal range in the study area is about 3.6m [7]. The tidal fluctuation in the open sea near Sonadia Island is shown in Figure 2.2.
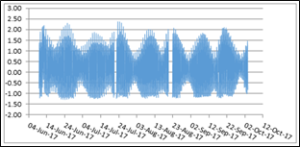
Figure. 2.2: Tidal fluctuation at Sonadia (IWM, 2018).
Noa-chirakhal and Badarkhal are two major canals of Sonadia Island, and have strong tidal characteristics. Towards the east they are connected to moheshkhali channel, however, on the westside they directly fall into the Bay of Bengal.
Methodology
Time series satellite image analysis was carried out to identify erosion and accretion prone area around the study area at Sonadia Island. To assess the bank shifting of Sonadia Island, Landsat Satellite images (30mx30m) were analyzed. To understand the actual scenario, images of low tide period were collected. The images were digitized to make boundary between land and water [6]. From these digitized geo-referenced Landsat satellite images, the bank line shifting i.e. the trends of erosion-accretion processes in the project area has been assessed.
Model Development
Hydrodynamic Model
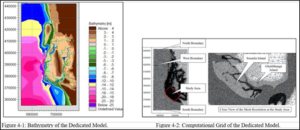
The existing calibrated and validated hydrodynamic model (Bay of Bengal model) of IWM has been used as a basis of development of the dedicated hydrodynamic model for the study area. The bathymetry of the dedicated hydrodynamic model has been updated and upgraded with latest available bathymetry and finer mesh resolution. The bathymetry and the mesh resolution are shown in Figure 4-1 and Figure 4-2.
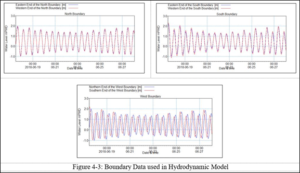
The north, south and west boundary of this model has been extracted from the Existing calibrated and validated Bay of Bengal model of IWM. Continuous water level data (varying in time and along boundary) has been used at the north, south and west boundary (Figure 4-3).
The main model parameter used for the calibration of the hydrodynamic model is shown in the Table 4-1
Model Parameter
Value
Numerical Scheme
Low
Eddy Viscosity
Smagorinsky formulation constant 0.28
Bed Resistance
Varying in Domain
Coriolis force
Varying in domain
To calibrate the model, it is necessary to adjust the bed resistance. In this study a map with different bed resistance has been used. The relation between Manning number (M) and bed roughness length, Ks can be estimated using the following formula: 𝑀 = 25.4 𝐾𝑠1/6 Initially the manning map was prepared based on the available water depth. Further correction has been made during the calibration process of the model. The applied Manning roughness (M) in the study area which is the reciprocal value of Manning’s n. The Manning number distribution which is used for calibration is shown in Figure 4-4. The manning roughness (M) for the mangrove area of Sonadia-Ghotibhanga island is used as 15 and for the land part of the model domain is used as 25.
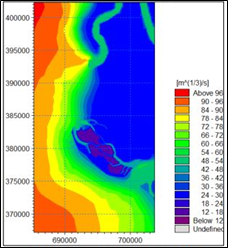
Figure 4-4: Bed Resistance Map Used for Model Calibration.
Storm Surge Model
Storm surge model is the combination of hydrodynamic and cyclone model. For simulating the storm surge and associated flooding, updated dedicated model based on MIKE21 hydrodynamic modelling system has been adopted. In the hydrodynamic model simulations, meteorological forcing due to the cyclone has been given by applying wind and pressure fields derived from the analytical cyclone model. The MIKE 21 modelling system includes dynamic simulation of flooding and drying processes, which are very important for a realistic simulation of flooding in the coastal area and inundation.
Cyclone Model
The description of a cyclone is based on few parameters related to the pressure field, which is imposed to the water surface and a wind field which is acting as a drag force on the water body through a wind shear stress description [8]. The pressure field creates a local level setup close to the eye up to one meter only [8]. Whereas the wind shear contributes more to the surge giving a level setup on the right side of the eye and a level set down on the left side. To generate the wind field, Holland Single Vortex theory has been applied [8]. The cyclone model needs following data/information for the description of wind field and pressure field:
- Radius of maximum winds, Rm,
- Maximum wind speed, Vm and
- Cyclone track forward speed Vf and direction.
- Central pressure, Pc
- Neutral pressure, Pn
- Holland Parameter, B= 2.0-(Pc-90)/160
The parameters used for the calibration of Cyclone model is given in table 4.2.
Model Parameters
Value
Parametric Model
Holland Single Vortex Theory
Geostrophic Correction Km
0.75
Forward Motion Asymmetry
Harper et al.
Delta_fm
0.5
Theta_max
115 deg
Inflow Angel
Sobey et al.
Results and Discussions
Erosion Accession Sonadia Island
Erosion-accretion pattern of Sonadia Island has been analyzed in detailed by satellite image analysis. Satellite image analysis has been performed from 1974 to 2010 almost 40 years. Figure 3.1 shows the erosion-accretion pattern from 1974 to 2010.
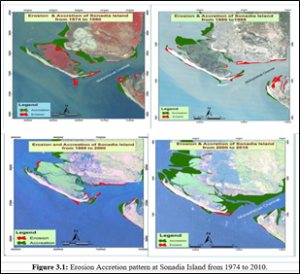
The analysis illustrate that Sonadia Island is developing gradually from 1974. Baddar khal was a massive channel then but the width of this channel gradually decreased due to accretion of Sonadia Island at the north-west portion and accretion of Gotibhanga Island along the Baddar Khal [9]. Coastline of Sonadia Island from 1974 to 1980 mainly accretion prone. The coastline of Sonadia Island experienced some erosion problem during the period from 1980 to 1989. Erosion is found at north-west tip of Sonadia Island and middle part of Sonadia Coastline. Accretion was found along the bank line of Baddar Khal and Badar Khal became narrower than earlier. Minimum erosion is found between the periods 1989 to 2000. In that period accretion is dominant along the Sonadia and Ghotibhanga Island [9]. Only slight middle portion of the coastline has some erosion and at the south part which was recently accreted is eroded away. Enormous accretion is found from 2000 to 2010. Huge accretion is observed at the south-east end of Sonadia Island adjacent to Moheshkhali Channel. Also, at the north-east portion accretion is substantial. Only some portion of Sonadia Island at south is eroded away which was recently accreted. From 2000 to 2010 along the coastline of Sonadia Island accretion is dominant. Afterward, from 2011 to 2019 erosion found along the coast of Sonadia Island. (Figure 3.2).
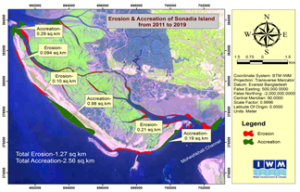
Figure 3.2: Erosion Accretion at Sonadia Island from 2011 to 2019.
Satellite image analysis illustrates that at some locations coastline erosion is going on previously that location didn’t experience erosion problem. Due to this, beach has been eroded away at this location. Some erosion took place within this period along the coastline of Sonadia Island at north-west and south of Sonadia Island. The average erosion per year varies from 4 m to 6 m.
Satellite image analysis indicates that the coast of Sonadia Island is in dynamic equilibrium condition. If some locations experience erosion for some period this location again experience accretion and some locations have erosion problem for some period these locations have accretion again for next some period. As a whole the coastline is stable. But recently at north-west part of Sonadia coastline has some erosion problem and the beach is eroded away [9].
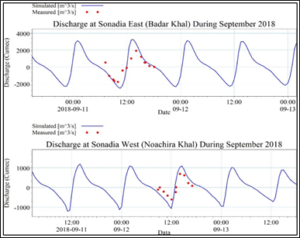
Hydrodynamic Model Calibration and Validation
The hydrodynamic model has been calibrated for the year 2018 and validated for the year 2017. The model has been calibrated for both water level and discharge and validated for water level only. The model calibration location is shown in Figure 4-5.
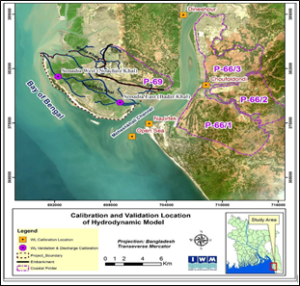
Figure 4-5: Calibration and Validation Location of the Hydrodynamic Model.
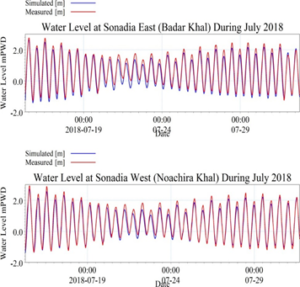
Figure 4-6: Water Level Calibration of at Sonadia East and West.
Storm Surge Model
The calibrated and validated hydrodynamic/tidal model with input from the cyclone model i.e., wind and pressure fields are used to generate and calibrate the surge level using the wind friction factor as the calibration parameter. A speed dependent linear wind friction factor is used from 0.0016-0.0026 for the wind speed of 0-24 m/s [10]. Storm Tide level has been calibrated & validated at Hironpoint for cyclone Sidr & Alia respectively. Measured tide data during cyclonic period has been collected from Mongla Port Authority (MPA) [10]. All the severe cyclone during the period of 1960-2009 has been simulated considering original and opposite tidal phase e.g., if a cyclone hit in high tide, then we simulate the cyclone in low tide also. Thus, total 38 (19*2) simulations have been carried out considering climate change impact (50 cm relative sea level rise and 8% wind speed increase as per IPCC 5th assessment report). Then the storm surge level from all simulations has been extracted near Sonadia- Ghotibhanga island (Figure 4-9). The storm surge level at Badar khal during 1991 cyclone is shown in Figure 4-10.
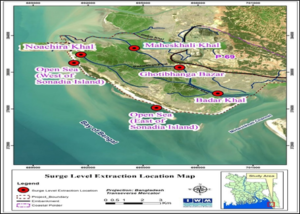
Figure 4-9: Surge Level Extraction Location Map.
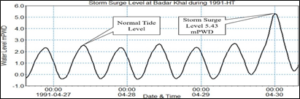
Figure 4-10: Storm surge level at Badar khal during 1991-HT.
Extracted storm surge level for all locations are given in Table 4-3.
Surge Extraction Location
Open Sea (East of Sonadia Island)
Open Sea (West of Sonadia Island)
Noachira Khal
Badar Khal
Ghotibhanga Bazar
Maheskhali Khal
Cyclonic Event
Storm Surge Level in mPWD (considering 50 cm sea level rise and 8% wind speed increase as per IPCC 5th assessment report)
1960-HT
4.42
4.45
4.49
4.50
4.68
4.68
1960-LT
4.17
4.08
4.13
4.26
4.36
4.35
1961-HT
2.81
2.66
2.68
2.62
2.68
2.70
1961-LT
2.48
2.57
2.58
2.50
2.60
2.57
1963-HT
3.83
3.01
3.06
4.34
4.32
3.39
1963-LT
4.17
3.21
3.27
4.71
4.69
3.59
1965-May-HT
2.82
2.94
2.98
2.83
2.95
3.03
1965-May-LT
2.72
2.57
2.59
2.54
2.62
2.66
1965-Dec-HT
4.25
3.49
3.59
4.82
4.57
3.93
1965-Dec-LT
3.41
2.55
2.64
3.75
3.54
3.36
1966-HT
3.20
3.22
3.24
3.23
3.31
3.30
1966-LT
2.42
2.39
2.37
2.43
2.51
2.50
1970-HT
3.68
3.83
3.86
3.70
3.85
3.87
1970-LT
3.64
3.77
3.78
3.64
3.80
3.79
1974-HT
2.77
2.84
2.84
2.78
2.89
2.94
1974-LT
2.48
2.51
2.52
2.56
2.65
2.49
1983-HT
2.89
2.57
2.65
3.06
2.99
2.92
1983-LT
2.24
2.21
2.25
2.23
2.26
2.34
1985-HT
3.66
3.45
3.42
3.72
3.87
3.59
1985-LT
2.42
2.39
2.36
2.59
2.68
2.22
1986-HT
2.02
2.02
2.03
2.03
2.09
2.12
1986-LT
1.70
1.69
1.72
1.71
1.73
1.78
1988-HT
1.93
1.98
2.00
1.99
2.03
1.99
1988-LT
2.16
2.16
2.16
2.18
2.24
2.19
1991-HT
5.07
4.90
4.90
5.30
5.43
5.07
1991-LT
4.35
4.22
4.18
4.47
4.63
4.44
1995-HT
2.77
2.76
2.82
2.82
2.85
2.85
1995-LT
2.75
2.75
2.80
2.79
2.82
2.83
1997-May-HT
4.24
3.87
3.92
4.47
4.47
4.23
1997-May-LT
3.90
3.35
3.41
4.34
4.27
3.56
1997-Sep-HT
3.17
3.20
3.14
3.23
3.39
3.19
1997-Sep-LT
3.38
3.35
3.35
3.41
3.54
3.56
1998-HT
2.74
2.53
2.47
2.94
3.03
2.52
1998-LT
3.07
2.78
2.71
3.36
3.49
2.51
Aila-HT
2.94
2.91
2.96
2.97
3.00
3.01
Aila-LT
2.90
2.86
2.92
2.92
2.95
2.96
Sidr-HT
3.18
3.31
3.33
3.21
3.34
3.32
Sidr-LT
2.85
2.98
2.98
2.96
3.07
2.91
Note: HT- High Tide; LT- Low Tide
Each of the location have 38 surge level data which has been used for frequency analysis. Frequency analysis has been carried out using Extreme Value Analysis (EVA) tool of MIKE model. Frequency analysis plot for Badra khal is shown in Figure 4-11.
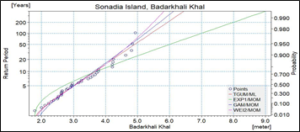
Figure 4-11: Frequency plot for storm surge level at Badar khal.
Storm surge level for different frequencies is given in Table 4-4.
Location
Storm Surge Level mPWD
25-Year
50-Year
100-Year
200-Year
Open Sea (East of Sonadia Island)
4.74
5.61
6.48
7.34
Open Sea (West of Sonadia Island)
4.37
5.11
5.84
6.58
Noachira Khal
4.39
5.13
5.87
6.61
Badar Khal
4.93
5.83
6.74
7.64
Ghotibhanga Bazar
5.01
5.92
6.84
7.75
Maheskhali Khal
4.64
5.46
6.28
7.09
Conclusion and Recommendations
Conclusion
The Sonadia Island is a biodiversity hotspot which is free from development and tourism impacts. Understanding the importance of the study area GoB has decided to covert Sonadia as an Eco-tourism spot. Bangladesh Economic Zone Authority (BEZA) has planned to establish an eco-tourism park at Sonadia-Ghatibhanga Islands at Maheshkhali Upazila. The area is prone to flooding and tidal surges during cyclonic storm. Coastal erosion is a worldwide occurrence principally along sea shores [11]. It encompasses considerable economic consequences, endangering valuable properties. The rise in water level is a major cause of this phenomenon along with anthropogenic action [11]. Traditionally, coastal erosion has been protected by civil engineering structures such as seawalls to groins. But this approach, while providing the local relief has generally transfer the problem from one geographic site to another. Beach nourishment and monitoring offers an alternative which confirms closer to natural process. While in some instances, a mixed hard and soft approaches appear adequate or even necessary. New technology and cost benefit analysis has lowered the relative cost involved. As the Island is an Ecological Critical Area (ECA), national biodiversity hotspot and Important Biodiversity Area (IBA) understanding the present biodiversity is important [12]. Also, the assessment of the potential impacts on environment and ecology is essential.
Recommendations
- Ecotourism development at Sonadia Island is technically feasible, environment friendly, socially acceptable and economically viable. Thus it is recommended to implement
- Feasibility study of hard measures to prevent coastal erosion
- Adaptation of mixed (hard & soft) intervention for erosion control
- Detailed design for proposed infrastructure before implementation
- Implementation of biodiversity conservation plan and continuous monitoring
- Provide beach facilities at the location for a specific period
- Limit the number of tourists in the area. It is recommended to allow maximum 500 tourists during day and 200 tourists during night
- Entrance of tourism should be restricted during breeding season of endangered marine turtles
- Involve local communities for conservation and management of biodiversity
- Providing a surveillance team to continuous monitoring
- Executing rules and regulation to preserve development
References
- Ahmad, “Coastal Zone Management Bangladesh Coastal Zone Management Status and Future Trends,” J Coast Zo. Manag, vol. 22, no. 1, p. 466, 2019.
- C. Van Rijn, “Coastal erosion and control,” Ocean Coast. Manag. 54:867-887, 2011.
- C. Brown and A. McLachlan, “Sandy shore ecosystems and the threats facing them: Some predictions for the year 2025,” Environ. Conserv. 29:62-77, 2002.
- K. Roy, M. A. Salam, S. N. Islam, and M. Al-Amin, “Potentiality of Islands Based Tourism in Bangladesh: A Qualitative View from Existing Literature,” Int. Bus. Res. 13:106, 2020.
- M. T. Hassan, M. A. Syed, and N. Mamnun, “Estimating erosion and accretion in the coast of Ganges-Brahmaputra-Meghna Delta in Bangladesh,” 6th Int. Conf. Water Flood Manag., no. March,115-124, 2017.
- “Study on coastal morphological changes under the influence of land surface deformation March 2022 NGUYEN HAO QUANG,” no. March, 2022.
- IWM (2018b), “Final Report (Part-B). Hydrological Observation and Thematic Study on Storm Tide Influence”, Dhaka, June 2018.
- IWM (2016), “Final Report. Hydraulic and Morphological Modelling Study to Aid Technical Feasibility Studies & detailed Design for Coastal Embankment Improvement Project (CEIP), Volume I”, Dhaka, May 2016.
- IWM (2018c), “Final Report. Hydrological and Morphological Study for Extension of Runway at Cox’s Bazar Airport (2nd Phase)”, Dhaka, April 2018.
- IWM (2017), “Final Report. Techno-Economical Feasibility Study for Development of the Land at Moheshkhali Island by Dredging Chars, Shoals for Land Based L.N.G. Terminal”. Dhaka, November 2017.
- IWM (2008), “Final Report, Coastal and Hydraulic Study for Deep Sea Port”, Dhaka, November 2008.
- IWM (2018a), “Final Report. Environmental Impact Assessment (EIA) for Development of the Land at Moheshkhali Island by Dredging Chars, Shoals for Land Based L.N.G. Terminal”, Dhaka, June 2018.
- Bangladesh State of Environment Report – 1999.