| Journal Menu |
| Editorial Board |
| Reviewer Board |
| Articles |
| Open Access |
| Special Issue Proposals |
| Guidelines for Authors |
| Guidelines for Editors |
| Guidelines for Reviewers |
| Membership |
| Fee and Guidelines |
 |
Affordable Adsorbent to Reduce Disinfection by-products in Drinking Water in Small Communities
Masood Ahmad1, Tahir Husain2*
1Geotechnical Reporting, Canadian Natural Resources Limited 8552 St. SW #2100, Calgary AB, Canada, T2P4J8
2Faculty of Engineering and Applied Science, Memorial University of Newfoundland, St. John’s, NL, Canada A1B3X5
Received Date: October 28, 2020; Accepted Date: November 06, 2020; Published Date: November 17, 2020;
*Corresponding Author: Tahir Husain, Faculty of Engineering and Applied Science, Memorial University of Newfoundland, St. John’s, NL, Canada A1B3X5. Email: thusain@mun.ca
Citation: Ahmad M, Husain T (2020) Affordable Adsorbent to Reduce Disinfection by-products in Drinking Water in Small Communities. Environ Sci Poll Res and Manag: ESPRM-106.
Abstract
A cost-effective filtration system to reduce natural organic matter (NOM) in the intake water, which will reduce the trihalomethanes (THMs) and haloacetic acids (HAAs), in the drinking-water systems of Torbay and Pouch Cove communities in Newfoundland, Canada, is tested. Clean carbon from oil fly ash was used to remove the total organic carbon (TOC) in the intake water source prior to chlorination. The results show a more than 92% removal of TOC from the Pouch Cove intake water and 65% from the Torbay water. The study also shows that once the water is filtered through the developed adsorbent, the formation of THMs and HAAs in it after chlorination is significantly reduced. This low-cost adsorbent is easy to install and has a great potential as an effective and economical adsorbent in supplying safe drinking water to rural communities.
Keywords: Adsorbent; Affordable; Chlorination; Disinfection by-products; Natural organic matter; Rural; Total organic carbon
Background Information
Pathogens in drinking water, causing water-borne diseases such as cholera, typhoid and dysentery, are a global issue and water distribution supply systems are unable to provide safe water supply to consumers unless these diseases-causing pathogens are inactivated in the system. Based on the World Health Organization (WHO) statistics, approximately 3,400,000 people and young children under the age of five, die every year in Asia, Africa and Latin America due to the water-borne diseases (WHO, 2002). Even developed countries with advanced water treatment technologies are facing problems to control the outbreaks of these water-borne diseases. More than 100 people died and 400,000 were affected in 1993 in Milwaukee city of Wisconsin state in USA as a result of the presence of cryptosporidium in the drinking water source (Mackenzie et al., 1994). Approximately 2,300 people suffered from E-coli contamination in drinking water and seven died in 2000 in Walkerton, Ontario, Canada (MOE, 2002). Although other disinfectants like chloramines, chlorine dioxide, ozone and ultraviolet (UV) radiation are also used to disinfect water but among these, chorine is the most effective and economical to inactivate the microorganisms.
Disinfection by-products (DBPs) are formed in drinking-water supply systems due to chlorination in the presence of precursors such as natural organic matter (NOM). Some of the DBPs are harmful to health and have been shown to be carcinogenic or to cause adverse reproductive or developmental effects in animal studies (Clifford et al., 1999; WHO, 2004; Nieuwenhuijsen, 2005; Richardson, 2005). As there are hundreds of different types of known DBPs associated with different forms of disinfection, it is difficult to monitor all of them. Recent focus, however, has been on two groups of DBPs, trihalomethanes (THMs) and haloacetic acids (HAAs), since these have been identified as the largest class of DBPs detected in chlorinated water. Chloroform, bromodichloromethane (BDCM), chlorodibromomethane (CDBM), and bromoform (CHBr3) are four compounds within the THM group. The sum of their concentrations should not exceed 100 µg/l, according to Canadian guidelines (Health Canada, 2012), and 80 µg/l, the US EPA standard (US EPA, 1998). The nine compounds within the HAA group include monochloroacetic acid (MCAA), dichloroacetic acid (DCAA), trichloroacetic acid (TCAA),
monobromoacetic acid (MBAA), dibromoacetic acid (DBAA), and tribromoacetic acid (TBAA and three mixed chloro- and bromo-acetic acids, bromodichloroacetic acid (BDCAA), dibromochloroacetic acid (DBCAA), and bromochloroacetic acid (BCAA). The total combined concentration of the five most prevalent HAAs (MCAA, DCAA, TCAA, MBAA, DBAA), known as HAA5, should not exceed 80 µg/1 (Canadian guidelines [Health Canada 2012]) and 60 µg/l (US EPA standard [US EPA, 1998]).
Most Canadian drinking-water systems use chlorine to ensure the destruction of potentially harmful pathogens in the water and to maintain a residual level between 0.4 mg/l and 2.0 mg/l in distribution systems to prevent bacterial regrowth (Health Canada, 2009). In Newfoundland and Labrador, out of 536 public water supply systems 459 use chlorine and about 25% of these systems have a THM level above 100 µg/l and one-third have levels of HAAs above the specified Canadian guidelines of 80 µg/l (Dept. Env. Cons., 2009).
Treatment options to reduce DBP levels in drinking water include membrane technology, enhanced coagulation, reverse osmosis, and carbon filtration, but, among these, carbon filtration effectively removes NOM (US EPA, 2003). For small communities, however, such technology is expensive due to the cost of the raw materials such as wood, coconut shells, bamboos, and bituminous coal used in developing carbon filtration technology. In order to find a cost-effective and affordable raw material, the carbon is extracted from heavy oily fly ash (HOFA) generated by the burning of heavy fuel oil. Millions of tons of HOFA are being generated yearly worldwide but a very small fraction of it is being reused, with most dumped into landfills or waste containment facilities, causing potential environmental hazards (Mohapatra and Rao, 2001). Since HOFA contains 70 to 90% unburned carbon by weight, it has a high potential as an adsorbent (Mofarrah and Husain 2013a, 2013b). Recent studies on HOFA show that it can remove phenols, methylene blue, lead (Mofarrah, 2014; Mofarrah et al., 2013), and chromium VI from wastewater streams by up to 92% (Mofarrah et al., 2013, 2014).
The objective of this research is to assess the performance of the carbon extracted from HOFA in order to provide cost-effective filtration media whereby small communities can remove NOM from their intake source before chlorination; the communities of Pouch Cove and Torbay near St. John’s, Newfoundland, Canada, were chosen for this research (Figure 1). Both of these communities have high concentrations of THMs and HAAs in their drinking water due to a high concentration of NOM, usually measured as TOC (Ahmad, 2013).
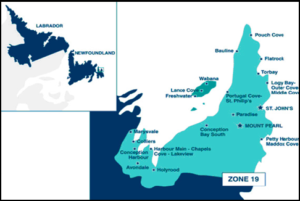
Figure 1: Location of Pouch Cove and Torbay communities.
Torbay, with about 7,000 people, is served by a municipal water supply system with a pond as the main source of raw water. Raw water from the pond is chlorinated with a gas hypo booster system and lime used to maintain the pH between 6.5 and 8.5 as specified by the Canadian guidelines. The Pouch Cove water system, with its intake source also from a pond, serves 1,800 people. Its raw water is chlorinated and the pH adjusted with soda ash to between 6.5 and 8.5. These communities do not have water treatment plants and rely solely on the chlorination of intake water and pH adjustments. This study focuses on removing the precursors that cause DBP formation in the drinking water once the intake water has been chlorinated. The removal of the DBP precursor measured as TOC was studied and a comparative evaluation made on the THM and HHA formation potential in both raw and filtered water.
Material and Methods
This section discusses the characterization of raw and clean carbon from HOFA, the characterization of raw water, the column test used to assess the removal of turbidity, TOC and other dissolved impurities, and the DBP formation potential in raw and filtered water.
Characterization and cleaning of adsorbent
HOFA is collected directly by the electrostatic precipitators of power plants which use heavy fuel oil or crude oil as a fuel source. Within Atlantic Canada, Newfoundland and Labrador uses 3.4%, Nova Scotia and Prince Edward Island 15.8%, and New Brunswick 36.1% of heavy fuel oil or a mixture of heavy fuel oil and petroleum coke for power generation (McPhie and Caouette, 2007). This indicates that a large amount of HOFA is being generated by provincial power industries. Major power generation and desalination facilities in oil-rich countries use heavy fuel oil. Saudi Arabia uses about 320 million barrels of heavy fuel oil and crude oil annually for its power generation (Break-bulk online news, 2010-07-20), and, as a result, more than 150 tons of HOFA per day is generated; this is collected from the flue gas using electrostatic precipitators installed in most of the major facilities, and disposed into landfills. The annual production of HOFA in Italy is about 27,600 tons, while in Taiwan it is 45,000 tons per year (Hsieh and Tsai, 2003). Many other countries use heavy fuel oil for their facilities and generate a significant amount of HOFA.
The physical and chemical characteristics of HOFA vary from plant to plant depending on the type of fuel, chemical additives that control corrosion in the boilers and turbines, the temperature in the burning chamber, and combustion efficiency. HOFA typically contains 50 to 90% carbon, oxides of metals, water-soluble sulfate, and ash residue (Kwon et al., 2005), as well as such heavy metals as nickel (Ni), vanadium (V), arsenic (As), and copper (Cu). Some of these metals naturally exist in the crude oil. Its density varies from 0.15 to 0.40 g/cm3, with particle size from a few microns (µm) to more than 150 µm. It has a high porosity with mainly mesopores and amorphous carbon suitable for the adsorption of high molecular weight compounds, especially hydrophobic NOM (Imai et al., 2001). These compounds are difficult to remove using conventional treatment methods. Mesoporous amorphous carbon is well suited to remove such heavy molecular weight compounds from intake sources.
For this study, HOFA from Shoaibah power plant located in the western part of Saudi Arabia was used (Mofarrah, 2014, Husain and Ahmad 2014). The impurities from HOFA obtained from Shoaibah power plant were removed by leaching with acid and washing with deionized water Hsieh and Tsai, 2003, Mofarrah, 2014) as follows:
- HOFA was washed with distilled water in the ratio of 1 g of fly ash to 10 ml of water and stirred at 10 rpm using a Birds & Philips stirrer model number 7790-400 for 12 hours with the magnetic bar dipped in the solution to capture the contamination at room temperature.
- After filtration, the washed raw HOFA was thoroughly mixed with an aqueous acid solution in the ratio of 1 g of fly ash to 5 ml distilled water with a 28% nitric acid solution at 60°C for 2 hours and then rinsed several times with distilled water to remove the nitrate ions.
- The washed HOFA was then treated with HCL in the ratio of 1 g of fly ash to 5 ml distilled water with 15% HCL at 60°C for 1 hour and rinsed several times with distilled water to remove the chloride ions.
- After filtration the wet clean carbon was oven-dried for 24 hours at 105°
A detailed analysis was conducted for raw fly ash and treated carbon for heavy metals as shown in Table 1 and the results were compared with the US EPA limit of metals in the drinking water. Most of the metals in the cleaned carbon were found within the permissible limit and the standard leaching test after activation of cleaned carbon did not show in any leaching of these metals in the water (Mofarrah 2014).
Metal
Raw HOFA (mg/kg)
Cleaned HOFA (mg/kg)
Arsenic(As)
<0.00076
<0.00076
Cadmium(Cd)
<0.00001
<0.00001
Cobalt (Co)
1.23
<0.00017
Copper(Cu)
3.6
<0.0019
Mercury(Hg)
.094
<0.00001
Nickel (Ni)
2176
332
Lead (Pb)
2.593
<0.00222
Selenium (Se)
<0.00704
<0.00704
Vanadium(V)
5251
221
Zinc(Zn)
47
15
Magnesium (Mg)
7359
989
Calcium (Ca)
<0.0413
<0.0413
Silica (Si)
85.791
13.025
Sulfur (S)
14130
3644
Carbon (% by weight)
86%
90%
Since this ash also contains high level of vanadium and nickel which have market value. Using acid to leach these metals will help in the recovery of vanadium and nickel thus converting waste into marketable product and at the same time getting cleaned carbon for filtration technology. This way the overall cost of cleaning the carbon will be offset by recovering vanadium and nickel.
The fly ash also contains high level of sulfur(S) and magnesium (Mg). The source of S is due to high sulfur content in the heavy fuel oil while Mg is due to the chemical additives to prevent corrosion in the power plant. As shown in the Table 1, these impurities were reduced by 75% in the clean carbon.
The carbon content in the HOFA was 86 to 90% by weight. The HOFA particle size was measured with the Horiba laser scattered particles size analyzer model LA-950. The mean diameter of the collected washed fly ash is 59 µm, with a standard deviation of 31.54 µm (Figure 2).
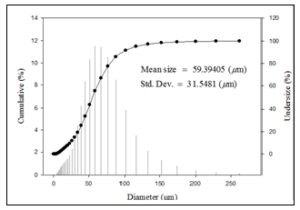 Figure 2: Particle size graph.
Column Test
The column test experiment was set up using a pyrex glass column 30 cm in length and 40 mm in internal diameter to which 6.4 g of clean carbon was added. To prevent the leaching of the fine particles into the filtered water, glass wool and a 1 µm filter at the outlet of the column were used. The test was conducted using raw water. A flow rate of 3.5 ml/min was maintained through the column by a peristaltic pump, and the filtered water collected at different time intervals. The advantage of using a peristaltic pump in this experiment was that there was no cross contamination; water flowing through the column did not touch any mechanical part of the pump but passed through the internal tubing system.
Pouch Cove Community
The raw water samples used in this study were collected from the pond which serves as the distribution source for Pouch Cove. The TOC was measured by a TOC analyzer, the pH by a pH meter, UV254 by a UV-Vis Spectrophotometer, as well as turbidity using 93703 Portable Microprocessor Turbidity Meter, and the results tabulated in Table 1. The results show a high level of TOC in the intake water and turbidity above 1 NTU. The column test was conducted to study the trend of TOC removal by as an adsorbent. The filtered samples were analyzed for TOC, pH, turbidity, and UV254. As shown in Table 2, raw water passes through the column and is filtered through clean carbon. The TOC of the raw and filtered water was analyzed to determine the TOC removal efficiency. The adsorbent was very effective in removing TOC from the Pouch Cove raw water.
As listed in Table 2, the TOC, UV254, and turbidity were high in the raw water and the pH values within the 6.5 to 8.5 range. The initial TOC reduction was 92% for 0.84 litres of filtration but, after this, the TOC removal efficiency starts decreasing, and after 26.50 litres, it reached 50%. The initial TOC concentration in the raw water was 13.64 mg/l. The turbidity had been reduced by 75%. UV254 is an indication of the level of dissolved organic carbon in the water. A high reduction in UV254 (more than 95%) was a clear indication that
the adsorbent was very effective in removing NOM from the water.
Water filtered in litres
pH
UV254 (nm)
Turbidity (NTU)
TOC (mg/l)
% TOC Red.
Co/Ci
Raw water quality
6.61
0.13
1.45
13.64
0
1
Filtered water 0.84 litres
6.14
0.007
0.35
1.16
92
0.08
1.89 litres
6.7
0.01
0.34
1.04
93
0.076
3.15 litres
6.63
0.03
0.34
2.10
85
0.15
5.67 litres
6.43
0.01
0.36
5.7
58
0.41
10.29 litres
6.4
0.005
0.4
6.73
53
0.49
13.02 litres
6.51
0.01
0.38
4.90
64
0.35
14.07 litres
6.71
0.05
0.34
5.49
60
0.40
15.54 litres
6.72
0.005
0.33
5.64
50
0.41
17.85 litres
6.65
0.001
0.36
5.45
52
0.40
21 litre
6.72
0.001
0.35
6.84
39
0.50
26.25 litre
6.74
0.001
0.37
5.56
50
0.40
Torbay Community
Raw water samples were collected from the pond, the Torbay distribution source, and the measured values of the parameters TOC, pH, UV254, and turbidity listed in Table 2. The raw water TOC was 5.41 mg/l, the turbidity 10.59 NTU, and the UV254 0.02. Comparing these results with the raw water quality in Pouch Cove, the Torbay intake water has a lower TOC, turbidity, and UV254.
As shown in Table 3, the initial TOC reduction was 76% after 0.84 litres of filtration, but after filtering more than 25 litres of water through the adsorbent, the TOC removal reached 41%. 0.84 litres
Filtered water in litres
pH
UV254 (nm)
Turbidity (NTU)
TOC (mg/l)
% TOC Reduction
C0/Ci
Raw water quality
6.23
0.02
0.59
5.41
0
1.00
After filtration
5.64
0.04
0.31
1.31
76
0.24
1.89 litres
5.79
0.002
0.35
1.86
66
0.34
3.15 litres
5.8
0.003
0.42
1.70
69
0.31
5.46 litres
5.76
0.04
0.43
1.83
66
0.18
10.08 litres
5.99
0.06
0.39
3.37
38
0.62
12.6 litres
6.01
0.042
0.33
2.37
56
0.43
13.86 litres
6.43
0.02
0.42
2.08
40
0.38
14.7 litres
6.51
0.009
0.35
2.57
55
0.47
16.59 litres
6.75
0.007
0.36
2.74
52
0.50
19.95 litres
6.74
0.13
0.37
2.87
49
0.53
25.2 litres
6.82
0.003
0.34
3.31
41
0.61
Although some of the commercially available activated carbon, made from petroleum coke, bituminous and lignite coal, wood products, and coconut shells, show a high potential for removing DBPs and its precursors, due to the high cost of the raw materials the activated carbon manufactured from these materials is not economical and affordable in small communities (Streat et al., 1995). This has led to the need to find a low-cost adsorbent by extracting unburned carbon from HOFA. This waste is abundant, with millions of tons being generated annually from the burning of heavy fuel oil (HFO). In this study, the main objective was to study the performance of removal of precursors. The future study will however focus on comparative economic assessment with other commercially available carbon.
DBP Formation Potential
Samples collected after 125 hours of filtration were chlorinated to study the DBP formation potential in the filtered water. Similarly, the raw water was also chlorinated. An attempt was made to maintain the same residual chlorine level in both the filtered and the raw water samples. Aqueous sodium hypochlorite was used for chlorination. THM formation in both filtered and raw water was studied with contact times of 4, 12, 18, and 24 hours after chlorination.
A gas chromatograph with an electron capture detector (GC/ECD) was used to analyze all nine HAA compounds. To measure the concentration of four THM compounds, EPA Method 501.3 with a purge and trap procedure in the gas chromatograph mass spectrometer (GC/MS) was used. The method of detection limit (MDL) of HAA and THM is a statistical estimate of the detection limit with seven and eight replicates, respectively. The estimate detection limit (EDL) is defined as either the MDL or a level of a compound in a sample yielding a peak in the final extract with a signal to noise (S / N) ratio of approximately five, whichever is greater. The MDL and EDL for nine HAA compounds and four THM compounds are listed in Tables 4 and 5 respectively. As listed in these Tables, most of the HAA compounds have detection limits falling in the range of 0.06 to 0.75 µg/L, while TBAA has the highest detection limit range (0.8 ~ 1.5 µg/L). On the contrary, the THM compounds have much lower detection limits which all appear in the range of 0.001 to 0.075 µg/L. Detection Detection
Method
Estimated
Limit
Limit
Analyte
µg/L
µg/L
MCAA
0.273
0.60
MBAA
0.204
0.20
DCAA
0.242
0.24
TCAA
0.079
0.20
BCAA
0.251
0.25
DBAA
0.066
0.20
BDCAA
0.091
0.40
CDBAA
0.468
0.75
TBAA
0.820
1.5
| Analyte | MDL
µg/L |
EDL
µg/L |
| Bromodichloromethane | 0.003 | 0.005 |
| Bromoform | 0.004 | 0.006 |
| Chloroform | 0.055 | 0.075 |
| Dibromochloromethane | 0.001 | 0.007 |
[/su_table]Table 5: Method Detection Limits of four THM compounds.
The THM and HAA values thus analyzed in the raw and filtered chlorinated water for different contact times are listed in Tables 6 and 7. Chloroform and BDCM levels were significantly low in the filtered water compared to the raw water for the same contact time; DBCM and bromoform had no significant changes. The individual concentration of THM compounds, i.e., chloroform, BDCM, DBCM, and bromoform, was very high and gradually decreased in the raw water as the contact times increased. The THM compounds in the filtered water was statistically reduced significantly. In the HAA group of compounds, only four – DCAA, TCAA, BCAA, and DBAA—were detected. Among these, BCAA was dominant. The total HAA level in the raw chlorinated water ranged from 192 to 231µg/l. The concentration of these compounds increased gradually with contact time after chlorination. In the filtered chlorinated water, the total HAA level was below 40µg/l, which is much lower than the Health Canada guideline of 100 µg/l.
In order to apply the filtration technology to Pouch Cove water utility, it is observed from Table 2 that using 6.4 g of clean carbon, the efficiency of removal of TOC is above 50% even after filtering 26.25 liters of water. The HAA level in the filtered water was found below Health Canada guidelines. The level of chloroform concentration was reduced from 165.22 µg/l to 52.88 µg/l for 24 hours contact time in the sample taken from the last filtered sample. The DCBM levels were reduced from 57.08 µg/l to 43.61 µg/l. However there was not much change in the DBCM and bromoform levels. Overall the TTHM level was found a little higher than the Health Canada guidelines which is 100 µg/l. These results show that by further research by adjusting flow rate and carbon amount, Health Canada guidelines of 100 µg/l for TTHM and 80 µg/l for total HAA can be achieved and a barrier of carbon before chlorination can be designed for the water utility.
Figure 4 shows a comparative evaluation of total THM in raw and filtered water with different contact times for the same dose of chlorination. The total THM level in the raw water is in the range of 250 to 300 µg/l; in the filtered water this level is reduced to 100 to 150 µg/l, which is still higher than the Canadian THM guideline of 100 µg/l. However, with a proper filter design, this level can be reduced to meet the guideline. The THM level in raw water is comparable to the typical THM level in the Pouch Cove water supply system (Ahmad, 2014). Figure 5 compares the total HAA levels in the raw and filtered chlorinated water for 4, 12, and 24 hours contact time. It is obvious from the plot that the adsorbent was very effective in removing HAA compounds. THMs (µg/l)
Pouch Cove
Chlorine Dose mg/l
Contact time (hrs)
Filtration time (hrs)
Chloroform (µg/l)
DCBM (µg/l)
DBCM (µg/l)
Bromoform (µg/l)
Total
Raw water
8
4
0
144.38
55.30
36.10
22.18
257.97
8
12
0
155.60.
55.85
36.48
22.25
270.20
8
18
0
179.39
60.09
36.28
22.17.
297.94
8
24
0
165.22
57.08
36.09
22.16
280.57
Filtered water
8
4
4
28.44
29.07
35.12
22.25
114.90
8
12
16
27.91
28.78
34.95
22.23
113.88
8
18
74
44.47
42.44
39.61
22.13
148.6677
8
24
125
52.88
43.61
39.32
22.23
158.06
|
|
Chlorine Dose mg/l | Contact time (hrs) | Filtration time (hrs) | MCAA (µg/l) | MBAA (µg/l) | DCAA (µg/l) | TCAA (µg/l) | BCAA (µg/l) | BDCAA (µg/l) | DBAA (µg/l) | CDBAA (µg/l) | TBAA (µg/l) | Total THAA (µg/l) | HAA5 | |
| Raw water
|
8 | 4 | 0 | N.D. | N.D. | 14.27. | 13.87 | 140.12 | N.D. | 23.79 | N.D. | N.D. | 192.07 | 51.93 | |
| 8 | 12 | 0 | N.D. | N.D. | 15.81 | 11.5 | 176.15 | N.D. | 22.34 | N.D. | N.D. | 225.83 | 49.65 | ||
| 8 | 24 | 0 | N.D. | N.D. | 8.61 | 10.86 | 189.94 | N.D. | 22.36 | N.D. | N.D. | 231.80 | 39.63 | ||
| Filtered water | 8 | 4 | 4 | N.D. | N.D. | N.D. | N.D. | 11.33 | N.D. | N.D. | N.D. | N.D. | 11.33 | N.D. | |
| 8 | 12 | 16 | N.D. | N.D. | 0.75 | N.D. | 13.78 | N.D. | 19.77 | N.D. | N.D. | 34.31 | 20.52 | ||
| 8 | 24 | 154 | N.D. | N.D. | 1.38 | 12.36 | 17.04 | N.D. | 21.09 | N.D. | N.D. | 39.52 | 34.83 | ||
| N.D. = Not detected | |||||||||||||||
[/su_table]Table 7: Individual HAAs in raw and filtered water-Pouch Cove intake source.
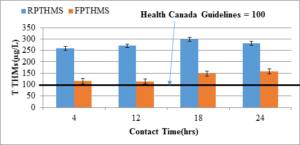
Figure 3: Total THM in raw water (RPTHMs, n=4) and filtered water (FPTHMs, n=4) in Pouch Cove intake source.
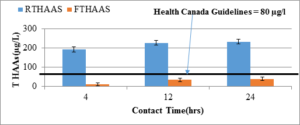
Figure 4: Total HAAs in raw water (RTHAAs, n=3) and filtered water (FTHAAs, n=3) in Pouch Cove intake source.
As shown in Table 7, in the chlorinated raw water all four THM compounds were higher than in the treated water which had a low TOC value. This pattern is almost the same as that in Pouch Cove water system. The chloroform and BDCM concentrations are significantly decreased in the treated water. The other two compounds in the THM group, DBCM and bromoform, do not change significantly in treated and raw water.
Chlorine Dose (mg/L)
Contact time (hrs)
Filtered water timing (hrs)
Chloroform (µg/l)
BDCM (µg/l)
DBCM (µg/l)
Bromoform (µg/l)
TTHMs (µg/l)
Raw water
8
4
0
56.97.
72.95
35.31
22.91
188.15
8
12
0
625.5
67.008
34.73
22.54
749.79
8
18
0
468.05
76.73
34.97
22.26
602.03
8
24
0
624.56
62.78
34.43
22.21
743.99
Filtered water
8
4
4
27.02
27.6
36.08
22.18
112.9
8
12
16
34.65
34.26
36.8
22.12
127.84
8
18
74
257.93
67.84
35.52
22.05
383.37
8
24
120
304.14
72.79
35.45
22.08
434.48
The The formation of THM and HAA in the Torbay water are shown in Tables 8 and 9. Similar to that in Pouch Cove, the chloroform level dominated, compared to the other three THM compounds in the Torbay filtered and raw water. Individual compounds in the treated water gradually increased with contact time after chlorination. As shown in Table 7, the concentration of DCAA, TCAA, BCAA, and DBAA was high in raw water. A high level of BCAA was found in the filtered water, but the levels of other compounds were very low. The total concentration of HAAs in the raw water is much higher than that of the treated water.
As shown in Figure 5, the total THM increases with contact time. THM reduction in the Torbay water intake is not as high as that found in Pouch Cove. This may be due to different NOM characteristics, and needs further investigation. With a 24-hour contact time, the THM level was above 700µg/l in the raw water and more than 400 µg/l in the filtered water. Comparing Figure 6 with Figure 4, the total HAA level in the Torbay water was much lower than in the Pouch Cove water. The total HAA level with a 24-hour contact time reached 140 µg/l; in the filtered water, it was about 100 µg/l.
Although TOC level in the Torbay intake water (5.71 µg/l as listed in Table 3) is lower than in the Pouch intake water (13.64 µg/l listed in Table 2) but the performance of clean carbon to remove TOC from Torbay water intake was not very effective which due to different charactersitics of natural organic matter (NOM) and a simple barrier of clean carbon to remove NOM from Torbay intake to acceptable level may not work and will require combination of coagulation with the adsorption barrier. (hrs) (hrs) (µg/l)
Chlorine Dose mg/L
Contact time
Filtered water
MCAA (µg/l)
MBAA (µg/l)
DCAA (µg/l)
TCAA (µg/l)
BCAA (µg/l)
BDCAA (µg/l)
DBAA (µg/l)
CDBAA (µg/l)
TBAA (µg/l)
TTHAA (µg/l)
HAA5
Raw water
8
4
0
N.D.
N.D.
7.08
13.58
82.08
N.D.
24.73
N.D.
N.D.
127.47
45.39
8
24
0
N.D.
N.D.
5.81
12.61
65.98
N.D.
22.40
N.D.
N.D.
106.81
40.82
Filtered water
8
4
4
N.D.
N.D.
N.D.
N.D.
11.56
N.D.
N.D.
N.D.
N.D.
11.56
N.D.
8
24
120
N.D.
N.D.
16.21
17.46
83.05
N.D.
23.46
N.D.
N.D.
140.20
57.13
N.D. = Not detected
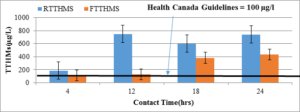
Figure 5: THM potential in raw water(RTTHMs, n=4) and filtered water (FTTHMs, n=4) with different contact times in Torbay intake source.
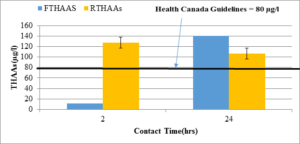
Figure 6: HAA potential in raw water(RTHAAs, n=2) and filtered water (FTHAAs, n=2) with different contact times in Torbay intake source.
Conclusion
The high cost of the raw materials used in the commercial activated carbon manufactured from coconut shell, anthracite coal, and wood fibers makes the filtration technology unaffordable for small communities which has led to find a low-cost adsorbent by extracting unburned carbon from HOFA. This waste is in abundance, with millions of tons being generated annually from the burning of heavy fuel oil (HFO). The cost of adsorbent from such source will be about 1/3rd to 1/4th of the cost of the commercial carbon. HOFA contains 75-85% unburned carbon and it is also rich with vanadium and nickel. Therefore, processing such waste will not only recover 75 to 85% carbon but the vanadium and nickel once extracted from this waste will be valuable products which will easily offset the cost of the processing. The preliminary study shows that in order to treat 26.25 liter of water from Pouch Cove intake source, 6.4 g carbon was needed which translates to approximately 250 mg of carbon per liter of water. This carbon be regenerated and reused several time and thus will make the technology very economical. A simple barrier of carbon for intake water before chlorination will make its operation simple and will not require highly skilled operators unlike in the current treatment methods including membrane filtration, coagulation, reverse osmosis, and other adsorption processes.
In this research, the extracted adsorbent was tested with a series of experiments using intake water from Pouch Cove and Torbay, two communities near St. John’s. The results show a significant removal of DBPs (above 70%) and their precursors such as TOC above 50%. This study also shows that the developed product can be used as an effective and inexpensive filtration media for removing THMs and HAAs in the water-supply system. This adsorbent, due to its low cost, also has a great potential in providing safe drinking water to rural communities at an affordable cost.
- For Pouch Cove tap water, more than 50% of the THMs were removed with a continuous run for 48 hours; the removal efficiency was less than 50% for the Torbay water. For 50% removal efficiency 250 mg of carbon per liter of was used in Pouch Cove while 330 mg/l of carbon was used in case of Torbay intake source
- The extracted clean carbon removed more than 95% of the HAAs from the Pouch Cove tap water for a continuous filtration for 7 hours. A similar trend was observed with the Torbay tap water.
- The clean carbon adsorbent was also used to assess its TOC removal. TOC is a DBP precursor in the intake sources of Pouch Cove and Torbay. The TOC concentration in the Pouch Cove raw water was 13.64 mg/l. After 26.25 liters of filtration, it was reduced by 41%. After up to 3.15liter of filtration, the reduction was more than 85%. In Pouch Cove water intake This shows that the breakthrough started after 26.25 liters of filtration. Such information will help in future in designing the filtration column bed for small communities.
- The TOC in the Torbay raw water was 5.41 mg/l. After 25.2 liter of filtration, the TOC was reduced by 39%.
- There was also a considerable reduction in UV absorbance (above 95% reduction in both communities), which indicates an overall improvement in the quality of water in both communities.
- The removal of turbidity from Pouch Cove water was above 75% while the removal of turbidity from Torbay water was only 40% which may be due to much lower turbidity in the Torbay raw water compared to Pouch Cove raw water intake source.
- With the increase in the contact time, the level of THMs and HAAs increased. In order to maintain these levels within the Health Canada guidelines, the design of filtration barrier should take into account the longest contact time which will be decided based on the distance between the chlorination tank and the farthest consumer in the system.
Acknowledgement
Authors highly appreciate for the financial support provided by the Harris Centre of Memorial University through the Royal Bank of Canada (RBC) Water Research and Outreach Fund and Natural Sciences and Engineering Research Council of Canada (NSERC) in conducting this study.
References
- Ahmad M (2013) Affordable Filtration Technology of Safe Drinking Water for Rural Newfoundland, M. Eng. Thesis, Memorial University of Newfoundland, St. John’s, Canada.
- Break-bulk online news (2010-07-20).
- Clifford PW, Hekap K, Patricia H, Judith BK (1999) Exposure Estimates to Disinfection By-products of Chlorinated Drinking Water, Health Perspectives 107:103-110.
- Env. Cons. 2009. Technical Report, Government of Newfoundland and Labrador, Department of Environment and Conservation 294.
- Health Canada. 2009. Canadian Drinking Water Quality: Guideline Technical Document, Chlorine, Health Canada, Ottawa, ON, Canada.
- Health Canada. 2012. Guidelines for Canadian Drinking Water Quality-Summary Table. Health Canada, Ottawa, ON, Canada.
- Hsieh YM, Tsai MS (2003) Physical and chemical analyses of unburned carbon from oil-fired fly ash, Carbon, 41: 2317-2324.
- Husain T, Ahmad M (2014) Low cost adsorbent to reduce disinfection by-products from drinking water in small communities, Proceedings of the 2014 International Conference on Environmental Engineering and Computer Application (ICEEC 2014), Hong Kong, 25–26 December 2014, CRC Press 99-104.
- Imai A, Fukushima T, Matshusige K, Kim YH (2001) Fractionation and Characterization of Dissolved Organic Matter in a Shallow Eutrophic Lake, Its Inflowing Rivers, and Other Organic Matter Sources, Water Research, 35:4019-4028.
- Kwon WT, Kim DH, Kim YP (2005) Characterization of Heavy Oil Fly Ash Generated from a Power Plant, Journal of Materials Online 1:1-8.
- Mackenzie WR, Hoxie NJ, Proctor ME, Grandus MS, Blair KA et al. (1994) A massive outbreak in Milwaukee of cryptosporidium infection transmitted through the public water supply. The new England Journal of Medicine, 331:161-171.
- McPhie P, Caouette A (2007) Heavy Fuel Oil Consumption in Canada – Analysis in Brief, Analytical Paper, Statistics Canada.
- MOE (2002) The Ontario Ministry of the Environment, A summary: Report of the Walkerton inquiry: The events of May 2000 and related issues. Part One: Ontario Ministry of the Attorney General.
- Mofarrah A (2014) Environmental Management and Potential Use of Heavy Oil Fly ash, PhD Thesis, Memorial University of Newfoundland, St. John’s, NL, Canada.
- Mofarrah A, Husain T, Chen B, (2013) Optimizing Cr (VI) Adsorption on Activated Carbon Produced from Heavy Oil Fly Ash, Journal of Material Cycles and Waste Management, 3:482-490.
- Mofarrah A, Husain T, Danish EY (2012) Investigation of the Potential Use of Heavy Oil Fly Ash as Stabilized Fill Material for Construction, Journal of Materials in Civil Engineering, ASCE, 24:684-690.
- Mofarrah A, Husain T, Bottaro C (2014) Characterization of Activated Carbon Obtained from Saudi Arabian Fly Ash, International Journal of Environmental Science and Technology (IJEST), 11:159-168.
- Mofarrah A, Husain T (2013a) Evaluation of Environmental Pollution and Possible Management Options of Heavy Oil Fly Ash, Journal of Material Cycles and Waste Management, 15:73-81.
- Mofarrah A, Husain T (2013b) Use of Fly Ash as a Color Ingredient in Ornamental Concrete, International Journal of Concrete Structures and Materials, 7:111-117.
- Mohapatra R., Rao JR (2001) Some aspects of characterisation, utilisation and environmental effects of fly ash, Chemical Technology and Biotechnology, 76:9-26.
- Nieuwenhuijsen MJ (2005) Adverse reproductive health effects of exposure to chlorination disinfection by products, Global NEST J., 7:128-144.
- Richardson SD, (2005) New disinfection by-product issues: emerging DBPs and alternative routes of exposure, Global NEST J., 7:43-60.
- Streat M, Patrick JW, Pe´rez MJ, (1995) Sorption pf phenol and par-chlorophenol from water using conventional and novel-activated carbon, Water Res., 29:467-472.
- US EPA (1998) National primary drinking water regulations: Disinfectant and disinfection byproducts, Federal register, 63:69390-69476.
- US EPA (2003) National primary drinking water regulations: Stage 2 Disinfectant and disinfection byproducts rule: Proposed rule, Federal register, 49547-49681.
- EPA (1995) “Method 552.2: Determination of haloacetic acids and dalapon in drinking water by liquid-liquid extraction, derivatization and gas chromatography with electron capture detection,” Revision 1.0. Cincinnati, OH.
- S. EPA (1995) “Method 551.1: Determination of Chlorination Disinfection Byproducts, Chlorinated Solvents, and Halogenated Pesticides/Herbicides in Drinking Water by Liquid-Liquid Extraction and Gas Chromatography with Electron-Capture Detection,” Revision 1.0. Cincinnati, OH.
- WHO (2004) Guidelines for drinking water quality, World Health Organization. 3rd edition 1:316-354.
- WHO (2002) The World Health report: Reducing Risk, promoting healthy life, 1211 Geneva 27, Switzerland.