ISSN: 2641-6816
Frequency: Continuous
Format: PDF and HTML
Versions: Online (Open Access)
Year first Published: 2018
Language: English
| Journal Menu |
| Editorial Board |
| Reviewer Board |
| Articles |
| Open Access |
| Special Issue Proposals |
| Guidelines for Authors |
| Guidelines for Editors |
| Guidelines for Reviewers |
| Membership |
| Fee and Guidelines |
 |
A Novel Approach for Rapid Detection of Adulteration in Saudi Wild Honey with Various Types of Syrups Using FTIR-ATR and Chemometrics
Taghreed A Alsaleem1, Amani A Albalawi1, Turki S Alsaleem1, Abdullah M Alowaifeer1, Somaiah k Almubayedh1*
1Reference Laboratory for Food Chemistry, Saudi Food & Drug Authority (SFDA), Riyadh 11561, Saudi Arabia
Received Date: October 06, 2022; Accepted Date: October 26, 2022; Published Date: November 02, 2022;
*Corresponding author: Somaiah k Almubayedh, Reference Laboratory for Food Chemistry, Saudi Food & Drug Authority (SFDA), Riyadh 11561, Saudi Arabia. Email: skmubayedh@sfda.gov.sa
Citation: Alsaleem T A, Albalawi A A, Alsaleem T S, Alowaifeer A M, Almubayedh S K (2022) A Novel Approach for Rapid Detection of Adulteration in Saudi Wild Honey with Various Types of Syrups Using FTIR-ATR and Chemometrics. Adv in Nutri and Food Sci: ANAFS-245.
DOI: 10.37722/ANAFS.2022404
Abstract
Honey is a well-known natural product, not only for its deliciousness and nutritional value but also for its therapeutic properties. It is classified as a luxury product because of its pleasant flavor and taste, which makes it a high-quality and valued commodity. The consumption of honey in Saudi Arabia has significantly flourished and increased; due to strong social, cultural, and religious associations. Consequently, honey has become the main focus for adulteration. The addition of sugar syrups to honey during or after production is a common method of adulteration. In this study, the Fourier transform infrared and attenuated total reflectance (FTIR-ATR) spectroscopy combined with chemometrics have been used as a simple and accurate approach for rapid detection and quantification of five types of local wild honey (Athil, Barsim, Eshir, Kina and Samar) adulterated with four adulterants (sugar cane, brown rice, maple, and pancake syrup) in different percentages (2%, 5%, 10%, and 20%). The FTIR spectral region of 1180-750 cm -1 was considered the data matrix for chemometric models. Therefore, (AHC) provided information on the extent of the similarities between raw honey types and their dissimilarities with syrups. While the optimal PCA analysis achieved a vital distinction between pure and adulterated honey, with recorded data in the range of 88.52–99.99 %, indicating an excellent predictive capability. The designed method successfully detected and classified the adulteration of honey with selected types of syrups at concentrations as low as 2% (w/w).
Keywords: Adulteration; AHC; Chemometrics; FTIR-ATR; Honey; PCA; Syrup
Introduction
Honey is a valuable food and, in most cases, has enchanted its consumers with its taste and related health benefits. Honey is a supersaturated solution of sugars, mainly composed of fructose (38%) and glucose (31%). In addition to its high sugar content, it has extraordinary measures of acids, nitrogenous compounds, phenolic contents, minerals, and water. However, the composition of honey can vary depending on the floral source and other external factors, including seasonal and environmental conditions, processing, and storage time (Alvarez-Suarez et al., 2013). It is normal for these changes to occur due to different chemical reactions, including fermentation, oxidation, and thermal processing, which result in changes to the honey component (Moreira et al., 2007).
Historically, honey has been used as both a sweetener and medicine for a variety of infectious diseases and for treating burns, cataracts, ulcers, and wounds. (Alotibi et al., 2018). Most of the beneficial characteristics of honey are due to its antibacterial activity. It has been reported that honey inhibits bacterial growth, specifically methicillin-resistant staphylococcus aureus (MRSA) (Wadi, 2019) and vancomycin-resistant enterococci (Al-Hindi & Shehata, 2014); due to its high sugar content (lowering water activity). The therapeutic effect of honey is due to various antioxidant molecules, including phenolic compounds, such as flavonoids and phenolic acids (Al-Waili et al., 2014).
In Saudi Arabia, honey is regarded as one of the most popular folk medicine. The increased health consciousness of the population coupled with its improved healing properties has increased its economic value, making it an attractive target for fraud., Consequently, honey is likely to be adulterated, mislabeled, and mixed with lower-quality sweet items (Alqarni, 2011). According to the Saudi Food and Drug Authority’s (SFDA) standards (SFDA.FD/GSO 147: 2021), “no food ingredient or additive can be added to honey, nor can any substance in its composition be removed. No process or heat treatment that could alter the composition or quality of the honey is allowed” (SFDA.FD/GSO 147:2021).
Fake honey is mainly classified into adulterated (adulteration) honey and imitation honey. Honey that has been adulterated includes honey whose compositional features have been changed through processes such as feeding bees sugar syrups during the production process, adding syrups to honey after it is produced, and mixing honey with various additives (Tosun and Keles, 2021). Artificial honey involves the complete production of honey with sugar syrups directly without the participation of bees (Tosun, 2004). As reported in the literature, sugars such as high fructose corn syrup, glucose syrup, corn syrup, inverted sugar syrup, and sugar cane syrup are commonly used as adulterants in honey (Wu et al., 2017). Corn syrups, sucrose, and inverted sugar syrups are the main types utilized for adulterating honey after the production stage at different rates. The detection of adulterated honey with syrups is tricky due to the similar quantities and concentrations of the main components: sucrose, glucose, and fructose to honey (Guellis et al. 2020).
To evaluate the authenticity of honey, several techniques have been used, including high-performance liquid chromatography (HPLC) (Yilmaz et al., 2014; Wang et al., 2015), nuclear magnetic resonance (NMR) spectroscopy (Bertelli et al., 2010; Ribeiro et al., 2014), gas chromatography (GC) (Ruiz-Matute et al., 2007; Ruiz-Matute et al., 2010), and stable carbon (13C/12C) isotope ratio (Simsek et al., 2012; Tosun, 2013). Despite the extensive studies and the more modest techniques, developing a simple, fast, cost-effective, highly sensitive, and very accurate new approach is desired. Such an easy-to-use method will help rapidly monitor the purity of honey sold in markets. The Fourier transform infrared attenuated total reflectance (FTIR-ATR) (Smith, 2011; Se et al., 2018) was widely used for molecular fingerprinting; due to its low-cost and easy analysis without requiring any sample preparation. It is realized that the performance of FTIR-ATR spectroscopy can further be enhanced by combining it with chemometrics data compression techniques such as principal component analysis (PCA) and agglomerative hierarchical clustering analysis (AHC).
To the best of the researcher’s knowledge, Se et al. (2018) is the only published study that demonstrates FTIR-ATR’s ability to detect altered honey that contains fructose, glucose, sucrose, corn syrup, and cane sugar. Therefore, this project aims to design a new methodology to detect various adulterants in local Saudi honey using FTIR-ATR spectroscopy combined with chemometrics.
Materials and methods
Materials
Honey samples
Five different types of local wild, raw, and crystallized honey (e.g., Athil, Barsim, Eshir, Kina, and Samar) were obtained from trusted sources through the Saudi Ministry of Environment, Water and Agriculture (MEWA). The samples were stored in glass jars in the dark at room temperature before the adulteration and subsequent analytical measurements. Four types of syrups, including sugar cane syrup, organic brown rice syrup, maple syrup, and sugar-free pancake syrup, were chosen as possible adulterants due to their availability and based on previous reports.
Adulterant
Each type of honey was adulterated with sugar cane syrup, organic brown rice syrup, maple syrup, and sugar-free pancake syrup in the following proportions: 2%, 5%, 10%, and 20%, and with a total volume of 4 g. After the adulteration process, all samples were heated in a water bath at 50°C for 30 min, then shaken at 10,000 rpm for 2 min using (SPEXSamplePrep 2010) Geno/Grinder; ensuring excellent homogeneity of the mixture (shown in Figure. 1). All adulterated samples were stored in darkness at room temperature before the analyses.
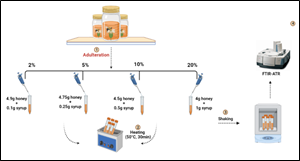
Figure 1: Analytical method for the detection of adulteration of wild honey using FTIR-ATR with various types of syrups.
Methods
FTIR-ATR measurement
The mid-infrared (MIR) spectra in the wavenumber ranging from 4000 to 350 cm-1 were collected using FTIR, applying the attenuated total reflectance (ATR) technique with a diamond crystal. The measurements were performed using the Thermo Scientific Nicolet iS50 spectrometer equipped with a deuterated doped triglycine sulfate (DTGS) detector. For each spectrum, 20 scans with a spectral resolution of 4 cm-1 were obtained. Furthermore, each measurement was carried out in triplicate. OMNIC software version 9.7.46 was used to analyze the collected spectral data.
Chemometrics data analysis
The use of hierarchical clustering analysis (AHC) with the Euclidean distance allows for separating homogeneous pure honey groups. Ward algorithm was then used to find the distance between the reference honey samples and syrups. Principal component analysis (PCA) was used to perform quantitative analysis (discrimination and classification) of pure and adulterated honey. PCA can extract precise information from minor differences hidden in the FTIR spectral data as it is an exploratory data examination scheme. Three spectra of each pure and adulterated honey sample were used to create the chemometrics model. A total of three spectra were used as training datasets for each pure sample. In contrast, 48 spectra were chosen as the training dataset for each adulterated sample. To ensure the adequacy of the developed chemometric models, all pure and adulterated honey samples were subjected to the exact measurements. The IR spectral data is decomposed in the method into the structure (principal components) and noise parts in the matrix form with rows for samples and variables for wavenumber. All calculations and graphic representations were done using the XLSTAT version 2022.1 software.
Results and discussion
FTIR-ATR spectra of syrups, pure and adulterated honey
The FTIR-ATR spectra for five samples of pure wild honey are shown in Figure. 2, with all samples visually representing similar absorption bands in the MIR region (4000-490 cm-1). A dominant band was observed in all honey samples at 3320 cm-1 due to water content (O-H stretching-hydrogen bonding). As presented in (Figure. 2), the prominent peak of pure honey was determined at 3028 cm-1 (C-H stretching) and 1710 cm-1 (C-O stretching) as a representative of carboxylic acids and carbohydrates respectively. A variety of absorption bands ranging from 1800-750 cm-1 were observed in honey spectra which were assigned to monosaccharides and disaccharides (Wang et al., 2010). It was reported that Turkish honey sample spectra were examined in five regions (3000-2800, 1700-1600, 1540-1175, 1175-940, and 940-700 cm-1), which represent carboxylic acids, amino acids, proteins, and carbohydrates, respectively, with the best differentiation achieved only in the carbohydrate’s region (1800-750 cm-1) (Gok et al. 2015).
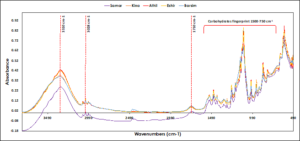
Figure 2: FTIR-ATR spectra of Samar, Kina, Athil, Eshir, and Barsim honey in the region of 4000-490 cm-1.
The major bands for each sugar cane syrup, brown rice syrup, and maple syrup were determined to be 1142, 1003, 1072, 910, 850, and 770 cm-1, as shown in (Figure 3A). These bands correspond to the chemical groups in these types of syrups which refer to the prominent monosaccharides (fructose and glucose) as well as disaccharides such as sucrose. There was a clear absence of these bands in pancake syrup spectrum; since it is labeled as sugar-free. Based on Se et al. (2018) spectra of five adulterants (fructose, glucose, sucrose, corn syrup, and cane sugar) in stingless bees (Heterotrigona itama) honey, carbohydrates bands at 1054, 867, 822, and 779 cm-1 for fructose,1022, 992, and 898 cm-1 for glucose, and 991, and 921 cm-1 confirming the presence of sucrose. Based on the particular spectral differences revealed in our data between pure and adulterated honey samples that are consistent with the latest study by (Se. et al., 2018), it was determined that the mid-infrared region is suitable for fingerprinting the major monosaccharide and disaccharide components.
The FTIR-ATR spectra in the region of 1180–750 cm-1 for the Samar, Eshir, Barsim, Kina, and Athil honey samples, respectively, were adulterated with sugar cane, brown rice, maple, and pan-cake syrup at four different percentages (2%, 5%, 10%, and 20%) (w/w) are shown in (Figure 3). The peak absorbance at 1054 and 867 cm-1 was assigned to the presence of fructose in honey (Se et al., 2018; Kacurakova & Mathlouthi, 1996). Furthermore, the observed peak at 910 cm-1 was determined to be sucrose (Wu et al., 2018).
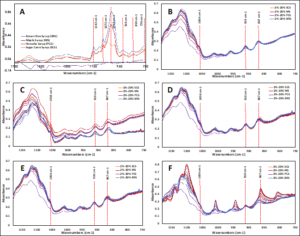
Figure 3: FTIR-ATR spectra of (A) sugar cane, brown rice, maple, and pancake syrup in the region of 1750-750 cm-1.; (B) adulterated Samar honey samples; (C) adulterated Eshir honey samples; (D) adulterated Barsim honey samples; (E) adulterated Kina honey samples; and (F) adulterated Athil honey samples, in the region of 1180-750 cm-1.
Chemometrics data analysis
The chemometrics approach allows researchers to observe the differences between the spectra of adulterated honey and original honey. Following the recommendations of (Se et al., 2018; Pataca et al., 2007; Tul’chinsky et al., 1976), and the spectral observation of the current study, the FTIR spectral region of 1180 to 750 cm-1, which represents mono- and disaccharides, was considered as the data matrix for the chemometrics models.
Agglomerative Hierarchical Clustering Analysis (AHC)
The results show that the AHC model provided detailed information on the extent of the similarities between raw honey types and their dissimilarities with syrups (Figure. 4). Two homogeneous groups were discriminated by Euclidean distance equals two, as shown in (Figure. 4A). The first one shows the closeness of the sugar content of Barsim and Kina honey to the other three types. On the other hand, (Figure. 4B) shows the semi-similarity in mono and disaccharides between honey types and all syrups except for PCS; due to the absence of sugars. The AHC technique was also used to examine the results of (Latorre et al., 2000); they have verified (Mel de Galicia) honey with a Euclidean distance of 0.75. Gok et al. (2015) have also used FTIR-ATR spectroscopy and the AHC technique to successfully identify several types of honey. They both achieved a good honey type separation in the FTIR spectrum from 1180 to 750 cm-1, which confirms the effectiveness of this model and its ability to disperse and verify the authenticity of honey.

Figure 4: Dendrogram clustering (A) pure honey samples and (B) pure honey samples with syrups, in wavenumber ranging from 1180-750 cm-1.
Principal Component Analysis (PCA)
PCA is one of the most commonly used chemometric tools, allowing data to be projected from a higher dimensional space to a lower-dimensional space. As presented in Figure. 5A, there were observations of grouping between different types of honey (Athil, Barsim, Eshir, Kina, and Samar). Samar, Kina, and Barsim honey were clustering in the same area while each of the other two types was in a different quarter; it is probably due to the dissimilarity in sugar content of each type. The PCA scores based on the first derivative spectra are represented in (Figure. 5B), indicating a strong distinction (F 1 and F 2) between pure and adulterated Samar honey samples, with recorded data variance of up to 97.86% showing higher spectral variability. The results show a variation of 96.50% between pure and adulterated Eshir honey (Figure. 5C), and a variance of 93.67% between pure and adulterated Barsim honey (Figure. 5D). The lowest data variance appeared for pure and adulterated Kina honey at 88.52%, as shown in (Figure. 5E), while (Figure. 5F) recorded the best variance data of up to 99.99% between pure and adulterated Athil honey. The PCA model’s score plots demonstrate a strong separation between pure and admixture samples down to the 2% level. Furthermore, all PCA score plots show dissimilarity between different adulteration percentages of all syrups and 20% pancake syrup, confirming that it is free of sugars.

Figure 5: PCA scores plot of (A) pure wild honey types (B) pure and adulterated Samar honey (C) pure and adulterated Eshir honey (D) pure and adulterated Barsim honey (E) pure and adulterated Kina honey (F) pure and adulterated Athil honey, in wavenumber ranging from 1180-750 cm-1. Adulteration was simulated in the following concentrations: 2%, 5%, 10%, 20, and was found to cluster together.
Conclusion
Herein the potential of the FTIR-ATR as a rapid and handy technique for the screening of major sugars present in honey and possible adulterants was examined. It was confirmed that the mid-infrared region is suitable for identifying the major mono- and disaccharides. Further, FTIR-ATR was applied to identify the dissimilarity between pure and adulterated honey. In this research, two chemometric methods based on FTIR-ATR spectra and factors were presented for accurate detection and quantification of various types of adulterants in raw and wild honey. PCA enabled the identification of honey adulteration with the most common syrups (sugar cane, brown rice, maple, and pancake syrup) at concentrations as low as 2% (w/w). The effectiveness of the identification of adulterated honey using PCA model may increase with the use of more advanced chemometrics techniques.
Acknowledgments: This research was financially supported by the Saudi Food and Drug Authority (SFDA). The authors are grateful to the Research and Laboratories Sector in SFDA for their keen interest in the study and instrumental support.
Declaration of Competing Interest: The authors declare that no competing interests exist in this manuscript.
Conflict of Interest Statement: The authors declare that they have no conflict of interest.
Disclaimer: Conclusions reached in this article are based on the personal scientific interpretations of the authors and do not necessarily represent the opinion of SFDA.
References
- Al-Hindi R R, Shehata A (2014). Evaluation of antioxidant and antibacterial activities and essential elements content of locally produced honey in Saudi Arabia. Life Sci. J, 11:175-185.
- Al M L, Daniel D, Moise A, Bobis O, Laslo L, et al. (2009). Physicochemical and bioactive properties of different floral origin honey from Romania. Food chemistry, 112:863-867.
- Alotibi I A, Harakeh S M, Al-Mamary M, Mariod A A, Al-Jaouni S K, et al. (2018). Floral markers and biological activity of Saudi honey. Saudi journal of biological sciences, 25:1369-1374.
- Alqarni A S (2011). Beekeeping in Saudi Arabia: current and future. Saudi Society for Agricultural Sciences Riyadh King Saud Univ.,21, 40.
- Alvarez-Suarez J M, Giampieri F, Battino M (2013). Honey as a source of dietary antioxidants: structures, bioavailability and evidence of protective effects against human chronic diseases. Current medicinal chemistry, 20:621-638.
- Al-Waili N S, Al-Waili F S, Akmal M, Ali A, Salom K Y, et al. (2014). Effects of natural honey on polymicrobial culture of various human pathogens. Archives of medical science: AMS, 10(2), 246.
- Bertelli D, Lolli M, Papotti G, Bortolotti L, Serra G, et al. (2010). Detection of honey adulteration by sugar syrups using one-dimensional and two-dimensional high-resolution nuclear magnetic resonance. Journal of agricultural and food chemistry, 58:8495-8501.
- Bogdanov S (2011). Honey Composition. In: Bogdanov, S (Ed). The Honey Book. pp. 27-36. Retrieved March 19, 2018.
- Bogdanov S, Martin P (2002). Honey authenticity: a review. Mitteilungen aus Lebensmitteluntersuchung und Hygiene, 93:232-254.
- Bogdanov S, Ruoff K, Persano-Oddo L (2004). Physico-chemical methods for the characterisation of unifloral honeys: a review. Apidologie, 35(Suppl. 1), S4-S17.
- Cabanero A I, Recio J L, Ruperez M (2006). Liquid chromatography coupled to isotope ratio mass spectrometry: a new perspective on honey adulteration detection. Journal of agricultural and food chemistry, 54:9719-9727.
- Ciulu M, Solinas S, Floris I, Panzanelli A, Pilo M I, et al. (2011). RP-HPLC determination of water-soluble vitamins in honey. Talanta, 83:924-929.
- da Silva P M, Gauche C, Gonzaga L V, Costa A C O, Fett R (2016). Honey: Chemical composition, stability and authenticity. Food chemistry, 196:309-323.
- Gheldof N, Engeseth N J (2002). Antioxidant capacity of honeys from various floral sources based on the determination of oxygen radical absorbance capacity and inhibition of in vitro lipoprotein oxidation in human serum samples. Journal of agricultural and food chemistry, 50:3050-3055.
- Gok S, Severcan M, Goormaghtigh E, Kandemir I, Severcan F (2015). Differentiation of Anatolian honey samples from different botanical origins by ATR-FTIR spectroscopy using multivariate analysis. Food chemistry, 170:234-240.
- Guellis C, Valério D C, Bessegato G G, Boroski M, Dragunski J C, et al. (2020). Non-targeted method to detect honey adulteration: Combination of electrochemical and spectrophotometric responses with principal component analysis. Journal of Food Composition and Analysis, 89:103466.
- Hatjina F, Costa C, Büchler R, Uzunov A, Drazic M, et al. (2014). Population dynamics of European honeybee genotypes under different environmental conditions. Journal of Apicultural Research, 53:233-247.
- Kačuráková M, Mathlouthi M (1996). FTIR and laser-Raman spectra of oligosaccharides in water: characterization of the glycosidic bond. Carbohydrate research, 284:145-157.
- Latorre M J, Pena R, García S, Herrero C (2000). Authentication of Galician (NW Spain) honeys by multivariate techniques based on metal content data. Analyst, 125:307-312.
- Lichtenthaler F W (2002). Unsaturated O-and N-heterocycles from carbohydrate feedstocks. Accounts of chemical research, 35:728-737.
- Maughan R (2002). The athlete’s diet: nutritional goals and dietary strategies. Proceedings of the nutrition Society, 61:87-96.
- Moreira R F, De Maria C A, Pietroluongo M, Trugo L C (2007). Chemical changes in the non-volatile fraction of Brazilian honeys during storage under tropical conditions. Food chemistry, 104:1236-1241.
- Ramsa E I, Rao S, Madathil L, Hegde S K, Baliga-Rao M P, et al. (2019). Honey in oral health and care: A mini review. Journal of oral biosciences, 61:32-36.
- Ribeiro R D O R, Mársico E T, da Silva Carneiro C, Monteiro M L G, Júnior C C, et al. (2014). Detection of honey adulteration of high fructose corn syrup by Low Field Nuclear Magnetic Resonance (LF 1H NMR). Journal of Food Engineering, 135:39-43.
- Ruiz-Matute A I, Soria A C, Martínez-Castro I, Sanz M L (2007). A new methodology based on GC− MS to detect honey adulteration with commercial syrups. Journal of agricultural and food chemistry, 55:7264-7269.
- Ruiz-Matute A I, Rodríguez-Sánchez S, Sanz M L, Martínez-Castro I (2010). Detection of adulterations of honey with high fructose syrups from inulin by GC analysis. Journal of Food Composition and Analysis, 23:273-276.
- Se K W, Ghoshal S K, Wahab R A, Ibrahim R K R, Lani M N (2018). A simple approach for rapid detection and quantification of adulterants in stingless bees (Heterotrigona itama) honey. Food Research International, 105:453-460.
- SFDA, 2021. Saudi Food and Drug Authority Honey Regulation FD/GSO 147:2021.
- Simsek A, Bilsel M, Goren A C (2012). 13C/12C pattern of honey from Turkey and determination of adulteration in commercially available honey samples using EA-IRMS. Food Chemistry, 130:1115-1121.
- Smith B C (2011). Fundamentals of Fourier transform infrared spectroscopy. CRC press.
- Tosun M (2013). Detection of adulteration in honey samples added various sugar syrups with 13C/12C isotope ratio analysis method. Food chemistry, 138:1629-1632.
- Tosun M (2004). Investigation Into the Suitability of the Testing Methods Used in Adulterated Honeys. Ataturk University, Science Institute. Ph. D. Thesis, 108 page, (in Turkish).
- Wadi M A (2019). Antibacterial activity of different global honey samples against standard organisms. Asian J. Microbiol. Biotechnol. Environ. Sci., 21:924-930.
- Wang S, Guo Q, Wang L, Lin L, Shi H, et al. (2015). Detection of honey adulteration with starch syrup by high performance liquid chromatography. Food chemistry, 172:669-674.
- Wu X, Chen W, Li L, Xu B, Guo Y (2018). Qualitative Identification and Semi-Quantitative Comparison of Sucrose in Maca (Lepidium meyenii) by Infrared Spectrum Analysis. American Journal of Analytical Chemistry, 9:322-329.
- Wu L, Du B, Vander Heyden Y, Chen L, Zhao L, et al. (2017). Recent advancements in detecting sugar-based adulterants in honey–A challenge. TrAC Trends in Analytical Chemistry, 86:25-38.
- Yilmaz M T, Tatlisu N B, Toker O S, Karaman S, Dertli E, et al. (2014). Steady, dynamic and creep rheological analysis as a novel approach to detect honey adulteration by fructose and saccharose syrups: Correlations with HPLC-RID results. Food Research International, 64:634-646.
