Publication Information
ISSN 2692-1529
Frequency: Continuous
Format: PDF and HTML
Versions: Online (Open Access)
Year first Published: 2019
Language: English
| Journal Menu |
| Editorial Board |
| Reviewer Board |
| Articles |
| Open Access |
| Special Issue Proposals |
| Guidelines for Authors |
| Guidelines for Editors |
| Guidelines for Reviewers |
| Membership |
| Fee and Guidelines |
 |
A Commercial Blend of Prebiotic Fiber, Oregano, Thyme, Cinnamon Essential Oils and Yucca Schidigera (One Current™) Supplemented Feed Increased Channel Catfish Fingerling Growth and Enhanced Disease Resistance
Beth Peterman1, Jessica Koppien-Fox2, Lora Petrie-Hanson1*
1Department of Basic Sciences, College of Veterinary Medicine, Mississippi State University, USA
2Director of Veterinary Services and Biosecurity, Ralco Nutrition, Inc., MN, USA
Received Date: June 23, 2020; Accepted Date: June 30, 2020; Published Date: July 09, 2020
*Corresponding author: Lora Petrie-Hanson, Department of Basic Sciences, College of Veterinary Medicine, Mississippi State University, PO Box 6100, Mississippi State, MS 39762, USA. Tel: +16623251291; Email: lora@cvm.msstate.edu
Citation: Peterman B, Koppien-Fox J, Petrie-Hanson L (2020) A Commercial Blend of Prebiotic Fiber, Oregano, Thyme, Cinnamon Essential Oils and Yucca Schidigera (One Current™) Supplemented Feed Increased Channel Catfish Fingerling Growth and Enhanced Disease Resistance. Jr Aqua Mar Bio Eco: JAMBE-106.
Abstract
After a three-month pond study, Channel catfish (Ictalurus punctatus) fed a blend of prebiotic fiber, oregano, thyme, cinnamon essential oils and Yucca schidigera (ONE Current™, OC) demonstrated greater weight gain (p=0.008) than catfish fed control diet (CON). Fish fed OC demonstrated higher survival (p=0.005) than CON fed fish after immersion exposure to Edwardsiella ictaluri. When incubated with bacteria, macrophages and cytotoxic cells from the anterior kidney and gut of OC fed fish phagocytosed or bound higher numbers of bacteria than cells from the anterior kidney and gut of CON fed fish. Higher reactive nitrogen species (RNS) production and higher lactate dehydrogenase activity (LDH) were demonstrated by adherent leukocytes from OC fed fish. Histological examination of the gastrointestinal tract demonstrated greater muscularis, submucosa and lamina propria height after month 2, and greater villi height and width after months 2 and 3 in OC fed fish. Higher RNS and LDH production, and higher bacterial phagocytosis by macrophages and binding by cytotoxic cells from OC fed fish contributed to higher survival. These findings suggest that OC supplemented feed in catfish production can increase growth, increase bacterial killing and minimize infectious disease losses.
Keywords: Channel Catfish; Disease Resistance; Essential Oils; Growth; Intestinal (Gut) Morphology; Phytogenic; Prebiotic
Introduction
Catfish production is an important industry in the United States, with total sales of 362 million dollars in 2019 (NASS, 2020) [1]. Disease loss and disease treatments can impact this production, and substantially increase costs. The most common disease treatment is antibiotic administration. The potential development of antimicrobial resistance has led to increased interest in using non-antibiotic based management strategies to reduce disease losses.
Phytogenic feed additives (PFAs) are a group of natural, non-antibiotic growth promoters that are derived from herbs, spices and other plants [2]. The use of PFAs such as prebiotics, Yucca schidigera and essential oils (EO) have individually demonstrated enhanced growth and health status in several types of terrestrial and aquatic animal production systems [3-7]. The phytogenic category of feed additives is diverse and multiple effects have been attributed to them, including stimulation of appetite, reduction of gastrointestinal bacteria and enhancement of the immune system [7-9], increased antioxidant properties in rainbow trout [10], and antimicrobial properties in red hybrid tilapia [11]. The use of these compounds in animal production systems is increasing worldwide [3, 12, 13].
ONE CurrentTM(OC) contains Actifibe prebiotic fiber blend (Ralco®), a microfused blend of oregano (Origanum vulgare), thyme (Thymus vulgaris) and cinnamon (Cinnamomum sp.) essential oils (Ralco®), and Yucca schidigera. Prebiotics can promote changes in the gastrointestinal tract (gut) flora and immune system and contribute to intestinal homeostasis [14]. Prebiotic fiber compounds are non-digestible food ingredients that promote the growth or activity of beneficial microorganisms, particularly in the gut [15]. These beneficial bacteria line and protect the gut wall minimizing pathogen invasion, and also release volatile fatty acids to reduce the pH and help inhibit pathogen survival [16].
The essential oils oregano, thyme and cinnamon have been investigated for use in terrestrial animal agriculture and more recently, in aquaculture. These naturally occurring compounds have fewer side effects than synthetic drugs, are easily biodegradable, and promote health and growth through various mechanisms [17]. Essential oils can enhance immune cell functions, and can also promote growth [17, 18]. Oregano essential oil increased intestinal villi height in Yellow Tail Tetra [19]. Cinnemaldehyde and thymol essential oils enhanced IgG, IgM and lysozyme functions in Nile tilapia (Oreochromis niloticus) fingerlings [20]. Combinations of PFAs can have synergistic effects. Studies previously performed have tested the growth performance or effectiveness against bacterial pathogens in tanks [21] or they have performed growth studies in ponds [22]. Limolene, thymol, carvacrol and anethol attributed to greater weight gain in channel catfish in tanks [22].
There are limited studies investigating how PFAs effect immune functions in fish. These studies have looked at serum lysozyme and catalase [21] or muscle tissue malondialdehyde and glutathione reductase [20]. The effects of PFAs on specific cell functions in fish have not been determined. Macrophages phagocytose bacteria and cytotoxic cells kill bacteria. Macrophages are fundamental to fish immune responses and play critical roles in bacterial phagocytosis and killing [23]. Cytotoxic cells play critical roles in vertebrate immunity. Cytotoxic cells in fish include NCCs and Natural Killer (NK) cells [24]. NCCs are a cell unique to fish and are not found in mammals. Evolutionarily, these cells may represent the first vertebrate cytotoxic cells. Direct bacterial killing by cytotoxic cells has been demonstrated in mammalian cell models [25, 26, 27], but not in any fish model.
Yucca schidigera (yucca) is a medicinal plant that reduced ammonia buildup in Nile tilapia (Oreochromis niloticus) production systems [28] and channel catfish (Ictalurus punctatus) production systems [6, 29]. Yucca also increased growth performance in juvenile striped catfish, Pangasianodon hypophthalmus [30].
A unique combination of these compounds provided in feed could increase growth and enhance health in fish. The purpose of this study was to evaluate the effect of OC supplemented test diet on channel catfish fingerling growth and disease resistance in channel catfish fingerlings when challenged with the enteric pathogen, Edwardsiella ictaluri. Comparisons of gut morphology and immune functions of gut and anterior kidney associated innate immune cells in OC fed channel catfish and control fed channel catfish were also performed. Yucca was added to the ONE Current TM (OC) diet to determine if it affected pond water ammonia levels.
Methods
Tank Growth Study
Channel catfish, Ictalurus punctatus, used in this study were obtained from a commercial supplier. Experimental protocols were conducted under the MSU Institutional Animal Care and Use Committee approval number 18-382.
A tank growth study was performed to determine which one of four test diets to use for the pond growth study. Diets 1 and 2 consisted of two concentrations of a microfused blend of oregano, thyme and cinnamon essential oils (EO blend, Ralco®) without prebiotic or yucca. Diet 1 (LEO) included 1.8 g microfused EO blend and diet 2 (HEO) included 3.6 g microfused EO blend. Diets 3 and 4 were low (LOC) and high concentrations (HOC), respectively, of ONE Current™, which contains Actifibe prebiotic fiber (Ralco®), a microfused blend of oregano, thyme and cinnamon essential oils (Ralco®), and Yucca schidigera at the same rates as described for the LEO and HEO. Diet 5 was the control diet (CON). Diets for the tank study were prepared by diluting the specified treatment in reverse osmosis (RO) water, top coating 8 pounds of feed (Zeigler Finfish Starter 55-15 #2 Crumble) per treatment and blending in a twin shaft mixer (Hobart) on low speed for 2 minutes. The control diet was top coated with 10 ml RO water only. Three tank replicates were used for each treatment, and ten fingerlings (10-15 cm in length, with an average weight of 11 g) were placed in each 15L tank supplied with flow through dechlorinated municipal water at an initial stocking density of 2.4 g/cm3. Tank temperatures were maintained at 27 ± 0.2°C. The fish were fed 3% of the total tank weight per day. The total weight of fish in each tank was determined at the start, and after 1week fish were weighed and amount fed adjusted for each tank. The fish in each tank were weighed again at the 2 week study termination. Weight gain (W2 (g) – W1 (g)) [31] was calculated for each tank and averaged for each treatment. When time was taken into account, the specific growth rate (SGR) was calculated as 100 (ln W2- ln W1)/Time [31]. The feed conversion ratio (FCR) was determined by feed intake (g)/weight gain (g).
Pond Growth Study
The diet that showed the best growth in the tank growth study was the low concentration of ONE Current™ (LOC), so that is the diet that was used in the pond growth study and will be referred to as ONE Current™ supplemented test diet (OC) for the pond growth study. OC test diet was prepared by diluting 300 g of OC in 3.8 L of RO water and adding this to 544 kg of 32% protein, 6% fat commercial catfish feed (Skretting, USA) in a twin shaft mixer on low speed for 2 minutes. CON diet was prepared the same but with the addition of RO water only.
Seven hundred and forty-five channel catfish fingerlings (10-15 cm in length, with an average weight of 28 g, weighing a total of 20,860 g) were stocked into each of eight 0.05 hectare ponds at the Mississippi State University Agriculture and Forestry Experiment Station (MAFES) South Farm Aquaculture Facility at a stocking density of 0.04 kg/m3. Four ponds were fed a control diet (CON) and four ponds were fed OC.
During the first month of the study (July 15 to August 14), fingerlings were fed 4.35% body weight (bw)/day, or 907g/pond/day. Four percent body weight was fed to each pond during month 2 and 3% during month 3. After 1 and 2 months, amount fed to each pond was adjusted based on the total weight of fingerlings in each pond. To determine monthly weight gains, at 1, 2 and 3 months sampling, all ponds were seined and three sets of 100 fish were weighed from each pond. To calculate the overall total weight, ponds were drained at termination of the study and all fish in each pond were counted and weighed. Mean values of individual ponds were calculated before calculating the mean fish weight, SGR, or FCR for each treatment. Each of these parameters were calculated after 1, 2 and 3 months and total weight gain of the study using the formulas described in section 2.1. At each monthly sampling, ten fish CON and ten fish OC were randomly sampled from the ponds for gut anatomy and gut morphometrics.
Water Quality Analyses
Dissolved oxygen and temperature were checked daily with a YSI Pro 20. pH (Hach, 239332), nitrite-N (Hach, 1407899), and total ammonia nitrogen (Hach, 172533, 219432) (TAN) were checked two times per week using a colorimetric comparator and un-ionized (toxic) ammonia was calculated for each sample using the temperature, pH and TAN [32]. Chloride (Hach, 104399) and total alkalinity (Hach, 94399) were tested at the beginning of the study using titration methods. Chloride concentrations in each pond were adjusted to 140 ppm by adding salt.
Tank Bacterial Challenges
After the three month pond growth study was completed, a sub-sample of fingerlings randomly chosen and taken equally from each of the ponds was moved to MSU CVM for infectious disease trials. 10 fish per tank with 6 replicates for CON and 6 replicates for OC were stocked into 15 L tanks supplied with flow through dechlorinated municipal water at a stocking density of 50.2 g/cm3 for CON fish and 56.8 g/cm3 for OC fish. The stocking density was managed with intense aeration and high water flows [33]. Water temperature was maintained at 27 ± 0.2°C. The fish were immersion exposed to 1×10⁵ colony forming units (CFU) Edwardsiella ictaluri/mL water. 3 tanks CON and 3 tanks OC were used as sham controls and were exposed to 50 mL brain heart infusion (BHI) broth only. Fish continued to be fed CON or OC and moribund fish were counted and removed 3 times a day. Brain and kidney of these fish were cultured on Edwardsiella ictaluri media (EIM) [34] to confirm the presence of E. ictaluri. Deaths were recorded for 15 days at which time there had not been any deaths for 48 hours.
Cell Isolations
At the termination of the pond growth study, the anterior kidney (AK) and intestine (gut) from five fish fed CON and five fish fed OC were removed. Four technical replicates per biological replicate were used in each procedure. Leukocytes were isolated following routine laboratory procedures [35]. Isolated leukocytes were used for flow cytometry and plate assays. Briefly, ak or gut tissues were removed and dissociated with a teflon homogenizer on a 40 µm cell strainer in cold FACS buffer, Hanks Balanced Salt Solution (HBSS) without calcium or magnesium (Sigma, H4891) and 0.02% Bovine Serum Albumin (BSA). Protease inhibitor cocktail was added to gut tissues during homogenization. Filtered cells were layered on a Histopaque 1119 gradient (Sigma-Aldrich, 11191). The suspension was centrifuged at 700xg for 20 minutes. The buffy layer at the interface between the cell suspension and the gradient was collected and washed with Hanks Balanced Salt Solution (HBSS).
Flow Cytometry
Leukocytes were isolated as described in section 2.5. After washing collected ak and gut cells in FACS buffer, 1×10⁵ cells/ml were transferred to individual 3 mL flow cytometry tubes for labeling with leukocyte specific antibodies (Table 1).
Antibody
Fluor
Cell type labeled
Reference
MPEG-1
FITC
Macrophages
Andrianopoulos et al. 2011[36]
L/CD207
PE
Dendritic cells
Kordon et al. 2016 [37]
51a
FITC
Neutrophils
Xue et al. 1999 [38]
5C6
FITC
cytotoxic cells
Evans et al. 2005 [39]
To perform cell labeling, 50 ul of cells were mixed with 50 ul of a monoclonal antibody and incubated for 30 minutes on ice. The cells were washed 3 times with 500 ul FACS buffer at 500 x g for 5 minutes each wash and then mixed with 50 ul of a Fluor labeled secondary antibody and incubated for 30 minutes on ice. The cells were washed with 500 ul FACS buffer 3 times at 500 x g for 5 minutes each wash, resuspended in 200 ul FACS buffer and kept on ice until analyzed with a NovoCyte Acea novosampler. Background auto fluorescence was eliminated by accounting for the mean fluorescent intensity (MFI) emitted by control cells. Twenty thousand cells were collected per sample. The percent positive cells were calculated using the percent positive cells minus the number positive for the isotype control, divided by the total number of cells collected. Results were presented as mean number of cells positive for a specific antibody. Novo express software was used for analysis. Mean values of individual fish were calculated before calculating the mean for each treatment. The mean value of the ak and the mean value of the gut were calculated separately for each individual fish and then the mean value of the two tissues were aggregated, or combined, so one value for each individual fish was used for statistical analysis.
Bacterial phagocytosis or binding was performed by flow cytometry and was measured by the uptake of mCherry: E. ictaluri by leukocytes labeled with antibodies. mCherry expressing E. ictaluri (mCherry:E. ictaluri) was prepared in house by calcium chloride transformation following the protocol of Russo [40] and was grown overnight to log phase and added at 1×10⁶ cells/ml to wells of CON or OC fish cells for overnight incubation. Bacterial binding was measured by co-labeling of cytotoxic cells and mCherry:E. ictaluri. Briefly, isolated cells were incubated overnight with mCherry:E. ictaluri as described, aliquoted to 5 ml flow cytometry tubes and labeled with antibodies as listed in Table 1 following the cell labeling procedure as described previously for flow cytometry. Bacteria phagocytosed or bound by each phenotype was determined by co-labeling of mCherry: E. ictaluri and each specific antibody fluor displayed as a two-color distribution plot analyses using PE-Texas Red for the bacterial fluorescence display and FITC or PE for the antibody display. The percentage of fluorescent cells for each sample was determined as cells displayed in the dual quadrant of the scatter plot. Twenty thousand cells were collected per sample. Background fluorescence was eliminated by accounting for auto fluorescence emitted by control cells. The percent positive cells were calculated using the percent positive cells in the quadrant minus the number positive for the isotype control divided by the total number of cells collected. Results were presented as mean number of cells phagocytosed or bound for a specific antibody. Novoexpress software was used for analysis. For each fish, ak and gut cells were analyzed separately and results were aggregated for statistical analysis.
Plate Assays
Lactate Dehydrogenase (LDH) activity is the amount of enzyme that catalyzes the conversion of lactate into pyruvate to generate 1.0 µmole of NADH per minute at 37°C. One unit of LDH activity is reported as nmole/min/ml = milliunit/ml.
In the reactive oxygen species (ROS) assay, H2O2 substrate reacts directly with H2O2 to generate a luciferin precursor. When the ROS-Glo detection reagent is added, the precursor is converted to luciferin by D-cysteine, and the produced luciferin reacts with ultra glo recombinant luciferase to produce a luminescent signal that is proportional to the H2O2 concentration. RLU is the relative luminescence units.
Reactive nitrogen species (RNS) are antimicrobial molecules derived from nitric oxide. Nitric Oxide (NO) and nitrite (NO2) RNS act together with ROS to damage cells. RNS is measured as NO2 by a diazotization reaction [41]. NO2is reported as nitrite concentration in µM.
Leukocytes were isolated as described in section 2.5. To quantify reactive oxygen species (ROS), reactive nitrogen species (RNS) and lactate dehydrogenase activity (LDH), 1×10⁶ cells/ml were aliquoted into sterile 6 well tissue culture plates in channel catfish macrophage media (CCMM) [42] with modifications. Briefly, CCMM contained RPMI (GIBCO, 11875-093) diluted 9:1 with sterile distilled water to adjust for osmolarity, 15 mM Hepes buffer (GIBCO, 15630-080), 0.18% sodium bicarbonate (Sigma, S-5761), and 5% channel catfish serum. E. ictaluri was grown overnight to log phase and added at 1×10⁶ cells/ml to wells of CON or OC fish cells for overnight incubation. Cells from each fish were then aliquoted into assay plates with four technical replicates per fish to measure ROS with the ROS-Glo H2O2 assay (Promega, G8820), LDH with the Lactate Dehydrogenase Activity Kit (Sigma, MAK066-1KT) and nitrite quantification using the Griess Reagent Kit for Nitrite determination (Invitrogen, G7921) following the manufacturer’s protocol for each kit. For each fish, ak and gut cells were analyzed separately and the results were aggregated for statistical analysis.
Gut Anatomy and Gut Morphometrics
At the monthly samplings described in section 2.2, the total length of each fish sampled and the total length of the gut were measured. The length of the gut was determined by removing the gastrointestinal tract and measuring the distance from the pylorus to the anus. The gut was divided into thirds and the upper, middle and lower portions were designated sections 1, 2 and 3, respectively. Section 1 included the pyloric intestine and section 3 included the rectal intestine. The gut sections were separated and fixed in phosphate buffered 10% formalin. Fixed tissues were paraffin embedded, sectioned at 5 µm, and stained with hematoxylin and eosin (H&E). Sections 1, 2 and 3 from 1 month, 2 month and 3 month samples of CON and OC were viewed on an Olympus BX43 microscope. The villi lipid accumulation was graded: mild <10%, moderate 10 to 50%, marked 50 to 75% and severe >75% of the surface area. Muscularis, submucosa, and lamina propria thickness were measured in micrometers (µm) using a 10 x 22 mm reticle with 100 standard divisions (Olympus GSWH10X-H/22). Villi height and width were also measured in µm. The number of goblet cells per villi were counted and standardized to 100 µm. Ten measurements were taken of each section for ten fish, for each feed type and month. Mean values of each fish were calculated before calculation of the treatment and statistical analysis.
Immunohistochemistry
Sequential serial gut sections were deparaffinized, rehydrated and held in PBS. Immunohistochemistry was performed using Shandon Sequenza immunostaining chambers and cover plates following procedures routinely performed in our lab [43]. All blocks and incubations were performed at 24°C. Slides were incubated in protein block for 1 hour then primary unlabeled antibodies (Table 1) were individually applied to separate sequential slides at a concentration of 1:500 for overnight incubation. After primary incubation, slides were rinsed, and biotinylated anti-mouse & anti-rabbit was applied for 1 hour. Finally, slides were incubated with Streptavidin-AP for 1 hour (APlink AP broad detection kit for mouse and rabbit antibodies (GBI Labs). Slides were rinsed 3 times for 2 minutes each at each incubation step following the primary with 1X TBS-T (50mM TrisHCl, 150mM NaCl, 0.05% Tween-20 pH 7.6). Isotype controls were used for primary antibody controls and the absence of primary controls was used for secondary controls to visualize background staining.
Statistical Analyses
For growth performance, flow cytometry, and plate assays, One-way analysis of variance (ANOVA) was used for data analysis. Statistical analyses were conducted using SPSS statistical package version 25.0 (SPSS Inc., Chicago, IL, USA). For flow cytometry, ak and gut were collected separately, but the results were combined, or aggregated so there was one value per fish instead of two. This better represents the over-all immune response of the fish to interpret how immunity correlates to survival. For survival analyses, time of death was used to perform Kaplan Meier survival analysis using Graph Pad Prism version 8.00 for Windows, Graph Pad Software, La Jolla California USA, www.graphpad.com. The non-parametric statistic tests Gehan-Breslow-Wilcoxon and Log ranked (Mantel-Cox) were used to estimate the statistical significance between the survival curves. Gut measurements were used to obtain mean values and SPSS was used to analyze by ANOVA and Duncan T3 for pair wise comparison. In all statistical tests, values were considered significantly different at p<0.05.
Results
Tank Growth Study
In the tank growth study, catfish fingerlings that were fed diets HEO, LOC, and HOC gained significantly greater weight compared to CON. Diet LOC resulted in a significantly greater specific growth rate, and an average fingerling gain of 6.44 g per fish over two weeks (Table 2). For this reason, the LOC (or low concentration OC diet) was chosen to be used in the pond study. There were no mortalities in the tank growth study. Weight gain (g) SGR1 FCR2 Values are reported as mean ± standard error, with statistical significance (p<0.05) designated by *.
Diet
Mean ± se
p value
LEO
4.7 ± 2.4
0.06
HEO
5.3 ± 1.2
0.002*
LOC
6.4 ± 1.7
0.001*
HOC
5.9 ± 1.3
0.001*
CON
3.2 ± 1.3
LEO
2.5 ± 0.11
0.3
HEO
2.7 ±0.19
0.2
LOC
3.3 ±0.19
0.04*
HOC
3.0 ± 0.06
0.07
CON
1.7 ± 0.19
LEO
1.1 ± 0.05
0.07
HEO
1.0 ± 0.06
0.03*
LOC
0.8 ± 0.06
0.01*
HOC
0.9 ± 0.03
0.04*
CON
1.6 ± 0.08
1SGR: specific growth rate; 2FCR: feed conversion ratio
Pond Growth Study
During month 1, there were no significant differences in weight gain, specific growth rate, or feed conversion ratio between fish fed OC and fish fed CON. (Table 3). During Month 2, the OC fish gained significantly more weight (p=0.01) than the CON fish (Table 3). During month 3, feeding rates were decreased because of cooler water temperatures starting September 15. Fish activity and feeding decreased during this time in all ponds. During month 3, the aerator in one of the test ponds repeatedly malfunctioned and the fish in that pond experienced repeated low oxygen episodes. That pond was removed from the study, and none of those fish were used in the tank bacterial challenges. All other ponds had water quality parameters acceptable for channel catfish production throughout the duration of the study (Table 4). Over 3 months, the OC fish demonstrated significantly greater weight gain (p=0.008), had a significantly higher SGR (p=0.001) and a significantly lower FCR (p=0.02), than CON fish (Table 3). Weight gain (g) SGR1 FCR2 2FCR: feed conversion ratio Values are reported as mean ± standard error, with statistical significance (p<0.05) designated by *.
Time
Diet/mean ± se
p value
CON
OC
1 month
40 ± 2.7
43 ± 3
0.5
2 month
57 ± 2.9
81 ± 6
0.01*
3 month
100 ± 6.2
110 ± 5
0.4
Overall
200 ± 5.7
230 ± 5
0.008*
1 month
2.9 ± 0.13
3.1 ± 0.2
0.6
2 month
2.1 ± 0.15
2.6 ± 0.1
0.03*
3 month
1.8 ± 0.16
1.9 ± 0.1
0.6
Overall
2.1 ± 0.03
2.5 ± 0.02
0.001*
1 month
0.9 ± 0.06
0.9 ± 0.1
0.6
2 month
1.4 ± 0.13
1.1 ± 0.1
0.03*
3 month
1.3 ± 0.2
1.1 ± 0.1
0.5
Overall
1.2 ± 0.03
1.1 ± 0.01
0.02*
1SGR: specific growth rate
Water Quality Parameter
Feed Type/Mean± se
p value
CON
OC
pH
7.8 ± 0.06
7.6 ± 0.05
0.04*
TAN (mg/L)
0.1 ± 0.01
0.2 ± 0.03
0.003*
Unionized ammonia (mg/L)
0.001 ± 0.0001
0.003 ± 0.0001
0.05
Nitrite-N (mg/L)
0.01 ± 0.003
0.01 ± 0.002
0.4
Sampled twice weekly for the duration of the pond study and are reported as mean value ± standard error of ONE Current™ supplemented feed (OC), with statistical significance (p<0.05) designated by *.
Water Quality
Water quality parameters remained optimum for channel catfish production throughout the study (Table 4). Ponds in which fish were fed the OC diet had significantly lower water pH and significantly higher water total ammonia than ponds in which the fish were fed CON.
Tank Bacterial Challenges
Channel catfish fed the OC test feed for three months demonstrated significantly higher survival than fish fed CON feed (Figure 1). E. ictaluri was isolated from all moribund fish as shown by growth on EIM agar, confirming the cause of death. Sham-exposed control fish had a survival rate of 100 percent.
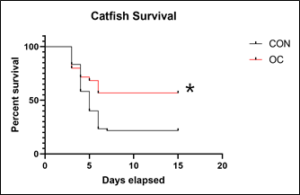
Figure 1: Survival (%) of fish fed control (CON) and test diet supplemented (OC) feed. Channel catfish fingerlings fed OC had significantly higher (p<0.005) survival than fish fed CON for 3 months. The figure shows a 15-day period following immersion exposure to Edwardsiellaictaluri (1×10⁵ CFU/ml). Statistical analysis was by Kaplan-Meier survival analysis with sixty fish from each group used.
Flow Cytometry
Flow cytometry results are presented as the mean number of positive fluorescent cells (out of 20,000) for five fish for each of the mAbs specified in Table 1. Cells from the ak and gut of the OC fed fish were in a more defined group as shown on the scatter plot (Figure 2a). The OC gut scatter plot had a population of cells that was not observed on the scatter plot of the CON gut. There were no significant differences the number of macrophages, dendritic cells, neutrophils, or cytotoxic cells isolated from OC fish and CON fish (Table 5). However, macrophages from OC fish phagocytosed significantly more mCherry: E. ictaluri than macrophages from CON fish, and cytotoxic cells from OC fish bound significantly more mCherry: E. ictaluri than cytotoxic cells from CON fish (Figure 3). The upper right quadrant (Figure 2b, c, d) shows the phagocytosis of mCherry: E. ictaluri by macrophages, dendritic cell and neutrophils, respectively and the binding of mCherry: E. ictaluri by cytotoxic cells (Figure 2e) in OC and CON.
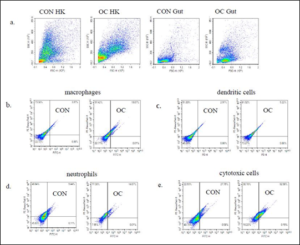
Figure 2: Flow cytometry phagocytosis or binding of anterior kidney (ak) and gut leukocytes. Cells were incubated with mCherry: E. ictaluri (1×10⁶ cells/ml) from fish fed control (CON) and test diet (OC) for 3 months and stained with antibody specific markers (Table 1). Numbers indicate the percentage of cells in the respective quadrants. Upper right quadrant shows cells that were phagocytosed or bound. Isotype-matched controls were included in the experiment. One representative is shown. Statistical analysis was by one-way ANOVA.
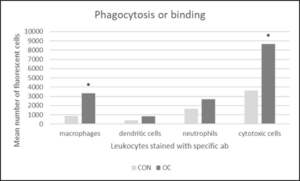
Figure 3: Flow cytometry phagocytosis or binding of anterior kidney (ak) and gut leukocytes incubated with mCherry: E. ictaluri (1×10⁶ cells/ml) from fish fed control (CON) and test diet (OC) for 3 months. Cells were stained with antibody specific markers (Table 1). Numbers represent the mean number of fluorescent cells out of 20,000 per sample for 5 fish and 4 technical replicates per fish for each group. Statistical analysis was by one-way ANOVA.
Cell type
Treatment/ mean number of cells ± se
p value
CON
OC
macrophages
3360 ± 1160
4830 ± 1390
0.4
dendritic cells
270 ± 90
1610 ± 740
0.1
neutrophils
3400 ±1360
5070 ± 1650
0.5
cytotoxic cells
4000 ± 1230
11000 ± 3380
0.08
Plate Assays
Lactate dehydrogenase production was significantly higher in adherent leukocytes isolated from OC fish. There was no significant difference in ROS production by adherent leukocytes from fish fed the two diets. RNS production was significantly higher in adherent leukocytes isolated from OC fish (Table 6).
Assay
Treatment/mean ± std error
p value
CON
OC
ROS (RLU’s)
3039.0 ± 196.70
2789.0 ± 61.74
0.254
RNS (µM nitrite)
38.9 ± 2.29
72.3 ± 6.31
0.001*
LDH (milliunits/ml)
54.9 ± 1.36
110.1 ± 6.86
<0.001*
Gut Anatomy and Gut Morphometrics
The channel catfish gut demonstrated mucosal, submucosal, muscularis, and serosal layers. The mucosa included the lamina propria, blood vessels, nerves, collagenous matrices, and gut-associated lymphoid tissue (GALT). Goblet cells were found between the epithelial cells and occasional leukocytes and macrophages could be seen in the mucosa. The mucosal epithelium can form deep folds called villi. Fewer folds were present in section 1. More goblet cells were present in section 3.
After 1 and 2 months, the gut lengths of the OC fish were significantly longer than that of the CON fish (Table 7). There were no significant differences in villi lipid accumulation in any of the gut sections between OC and CON fed fish throughout the study. Section 1 muscularis heights were the same in both diets after 1, 2 and 3months (Figure 4). Section 1 submucosa heights were the same in both diets after month 1 and month 3, but were significantly greater after month 2 (Figure 5). Section 1 lamina propria heights were the same in both diets after 1 month, but were significantly greater in OC fed fish after 2 and 3 months (Figure 6). There was no significant difference in section 1 villi from OC or CON fed fish.
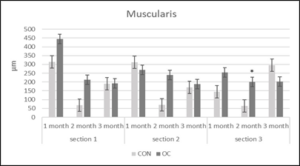
Figure 4: Muscularis height (µm) in gut sections 1, 2 and 3 from channel catfish fed control (CON) or test diet (OC) for 3 months. Ten measurements taken in each section for ten fish from each treatment. Statistical analysis was by one-way ANOVA (p<0.05 is designated by *).
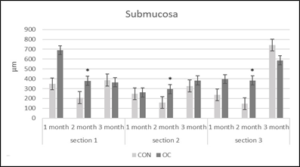
Figure 5: Submucosa height (µm) in gut sections 1, 2 and 3 from channel catfish fed control diet (CON) or test diet (OC) for 3 months. Ten measurements taken in each section for 10 fish from each treatment. Statistical analysis was by one-way ANOVA (p<0.05 is designated by *).
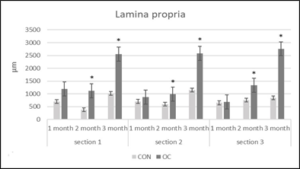
Figure 6: Lamina propria height (µm) in gut sections 1, 2 and 3 from channel catfish fed control diet (CON) or test diet (OC) for 3 months. Ten measurements taken in each section from 10 fish each treatment. Statistical analysis was by one-way ANOVA (p<0.05 is designated by *).
Study month
Mean ratio gut length: fish length
p value
CON
OC
1 month
0.87 ± 0.19
1.16 ± 0.046
<0.001*
2 month
1.04 ± 0.25
1.91 ± 0.12
0.014*
3 month
0.84 ± 0.79
0.85 ± 0.066
0.854
Gut tissue
Month
Goblet cells/100µm
p value
CON
OC
Section 1
1
0.8 ± 0.15
1.2 ± 0.32
0.213
Section 1
2
0.8 ± 0.094
1.6 ± 0.17
0.001*
Section 1
3
0.9 ± 0.18
1.2± 0.102
0.163
Section 2
1
1.1± 0.16
3.8 ± 2.17
0.249
Section 2
2
0.9 ± 0.13
1.2 ± 0.089
0.07
Section 2
3
1.2± 0.16
1.3± 0.076
0.625
Section 3
1
1.3 ± 0.15
4.4 ± 0.35
0.000*
Section 3
2
0.8± 0.12
1.5± 0.18
0.008*
Section 3
3
0.4± 0.062
0.7±0.053
0.014*
Section 2 muscularis heights were the same between both diets after months 1, 2 and 3 (Figure 4). Section 2 submucosa heights were the same after months 1 and 3, but after month 2 were significantly greater in OC fed fish (Figure 5). Section 2 lamina propria heights were the same after 1 month. After 2 and 3 months, section 2 lamina propria heights were significantly greater in OC fed fish (Figure 6). Section 2 villi heights and widths were the same after months 1 and 2, but were both significantly greater after 3 months (Figure 7 & 8a & 8b). The villi were more branched in section 2 of the OC fed fish.
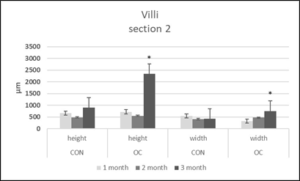
Figure 7: Villi height and width (µm) in gut sections 2 from channel catfish fed control diet (CON) or test diet (OC) for 3 months. Ten measurements taken in each section from 10 fish each treatment. Statistical analysis was by one-way ANOVA (p<0.05 is designated by *).
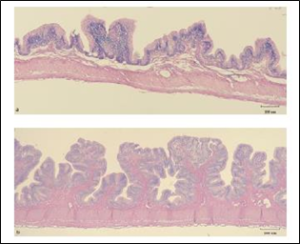
Figure 8: a.) Villi height and width in gut section 2 after 3 months feeding control (CON) diet. b.) villi height and width in gut section 2 after 3 months feeding test diet (OC). Formalin fixed, paraffin embedded tissues, H&E stained (photograph taken at 40x). Size bar indicates 100 µm.
Section 3 muscularis heights were the same after months 1 and 3, but were significantly greater after month 2 in OC fed fish (Figure 4). Section 3 submucosa heights were the same after months 1 and 3, but were significantly greater after month 2 in OC fed fish (Figure 5). Section 3 lamina propria heights were the same in both diets after 1 month, but were significantly greater in OC fed fish after 2 and 3 months (Figure 6). Section 3 villi heights were the same after month 1, but after months 2 and 3, were significantly higher in OC fed fish compared to CON fed fish (Figure 9). The villi were more branched in section 3 of the OC fed fish.
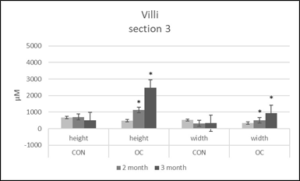
Figure 9: Villi height and width (µm) in gut section 3 from channel catfish fed control diet (CON) or test diet (OC) for 3 months. Ten measurements taken in each section from 10 fish each treatment. Statistical analysis was by one-way ANOVA (p<0.05 is designated by *).
Immunohistochemistry
After 1 month, Mpeg positive foci (macrophages) were observed in the muscularis and lamina propria of section 1 in the CON fish and in the lamina propria only of the OC fish. Macrophages were observed in the OC fish in month 2 and 3 in the muscularis and lamina propria but were not observed in the CON fish at those time points in those locations. L/CD207 positive cells (dendritic cells) were observed after 1 month in section 1 in the epithelium of the CON and OC fish. 51a positive cells (neutrophils) were observed in the muscularis of section 1 in the OC fish but were not observed in the same section of the CON fish. Neutrophils were not observed in the sub mucosa or lamina propria. 5C6 positive cells (cytotoxic cells) were not observed in section 1.
In section 2, macrophages were observed in the muscularis and lamina propria in month 1 in the CON and OC fish. Macrophages were observed in the OC fed fish in the muscularis, submucosa and lamina propria in month 2 and 3 but were only observed in the submucosa of the CON fish in month 3. Macrophages were not observed in the muscularis or the lamina propria of the CON fish in month 2 or 3. Dendritic cells were observed in the epidermis of the CON fish in month 1, 2 and 3 but were only observed in the epithelium of the OC fish in month 2 and 3. Neutrophils were observed in the muscularis of section 2 in the OC fish but were not observed in the same section of the CON fish. Cytotoxic cells were observed in the epithelia of OC fish in month 2 and 3 while none were seen in the corresponding location of CON fish in section 2.
In section 3, macrophages were observed in the muscularis in month 1, 2 and 3 in OC fish. Macrophages were not observed in the muscularis of CON fish in section 3. Macrophages were also observed in the submucosa and lamina propria of OC fish but were only observed in the lamina propria of CON fish in month 1 and in the submucosa of CON fish in month 3. Dendritic cells were observed in the epithelium of the OC fish after 1 month but were not observed until month 3 in the CON fish. Neutrophils were observed in the muscularis and submucosa of CON and OC fish in section 3. Cytotoxic cells were present in the muscularis of section 3 after 2 and 3 months and in the epithelia after 3 months in the OC fish while very few cytotoxic cells were seen in corresponding locations of CON fish. Very few positive staining cells are demonstrated in the lamina propria in (Figure 10a) while (Figure 10b) demonstrates how many more cytotoxic cells there were in the OC fish compared to the CON fish. There are multiple positive cells scattered throughout the image. Not all positive cells are marked with an arrow on Fig. 10b but all areas staining pink were considered positive as the isotype control slides did not demonstrate any positive staining areas that would be considered background stain.
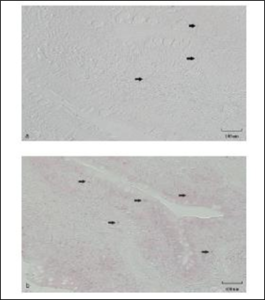
Figure 10: a.) Immunohistochemistry of gut section 2 of catfish fed control diet (CON) for 3 months. b.) immunohistochemistry of gut section 2 of catfish fed test diet (OC) for 3 months. Cells were labeled with 5C6 primary antibody (Table 1), biotinylated anti-mouse & anti-rabbit secondary and streptavidin-AP color developer (APlink AP broad detection kit, GBI Labs), designating cytotoxic cells. Positive cells (→) have a red focus or pink cytoplasmic blushing. Not all positive areas are marked (→) in b.) but all pink foci and blushing areas are considered positive as determined by comparison to the isotype control slide (figure not shown). Size bar indicates 100 µm.
Discussion
This is the first study investigating the growth and health benefits of a blend of Actifibe® Prebiotic, oregano, thyme, cinnamon essential oils and Yucca schidigera. In our tank study, channel catfish (Ictalurus punctatus) fingerlings fed a blend of oregano, thyme, cinnamon essential oils, Actifibe® Prebiotic and yucca (LOC and HOC) gained significantly more weight and had significantly lower FCRs than control fed fish. The standard FCR for fingerling catfish is 1.0 to 1.2 [44]. Fingerlings used for the tank growth study were obtained in January from ponds that were not being fed. It is likely that the fingerlings demonstrated rapid compensatory growth that contributed to a lower FCR. This phenomenon was demonstrated in feed restricted channel catfish fingerlings, and FCRs were as low as 0.5 to 1 [45]. In our study, OC fed fish also demonstrated significantly higher SGRs. The fingerlings used were varied in size, and SGR is a calculation to account for the size variation that naturally occurs in animal populations [31]. A tank study using the two main components of oregano oil (carvacrol and thymol) separately, and oregano EO, demonstrated that fish fed oregano EO had significantly greater growth [21]. When a PFA containing carvacrol, thymol, anethol and limolene, the main ingredients in oregano oil was fed to channel catfish in tanks, they ate 30% more feed and gained 44% more weight, but this weight gain was not demonstrated in corresponding pond studies [22]. Our tank findings were upheld after the LOC diet was selected and used in corresponding pond trials.
In our pond study, catfish that were fed OC gained significantly more weight, had a significantly higher SGR and a significantly lower FCR over three months. During month one, the weight gain, SGR and FCR were the same for both diets. Interestingly, the FCR’s were also below 1 for both diets. Natural food present in the ponds when the fish were stocked contributed to this low FCR. After month two, OC fish weighed more than the CON fish. Overall, the OC fish had a significantly higher SGR and significantly lower FCR than CON fish. These FCRs are low compared to terrestrial animal agriculture, but are within the range of channel catfish fingerling FCRs [44]. In commercial production, catfish are fed to satiation and greater weight gain may have been observed if fish would have been fed to satiation in this study. When the main ingredients of oregano oil were fed in ponds, the test diet fed fish did not gain significantly more weight, but did have lower body fat and higher protein yield [22].
The weight gain and health benefits of different prebiotics and multiple types of essential oils have been investigated separately, and in multiple species of fish, with widely varying and sometimes contradictory results [2, 17, 18, 46]. Actifibe® Prebiotic is an arabinogalactan, a densely branched polysaccharide, with varying galactose and arabinose sugar units. Its unique structure allows it to remain in the gut longer and distribute throughout the gut while providing a substrate for beneficial bacteria. The active compounds in PFAs can vary widely depending on the plant species, portion of the plant used, the season the plant is harvested, as well as the geographical region where it is grown and harvested. In addition, the method of processing may affect the active compounds in the final product [3]. Consistency of source, quality control measures and appropriate manufacturing techniques are needed to ensure consistent performance and results. This may explain the contradictory results when different sources of EOs and other PFAs are used across various studies.
The channel catfish fed OC demonstrated significantly higher survival following immersion exposure to E. ictaluri. Similar findings were demonstrated in several studies using different prebiotic compounds and essential oil extracts [18,20, 21]. We observed increased cellular activities of isolated leukocytes. These findings indicate the cellular mechanisms that resulted in increased survival. Macrophages demonstrated significantly higher bacterial phagocytosis and cytotoxic cells demonstrated significantly higher direct bacterial binding. Additionally, significantly higher RNS and LDH values demonstrate the increased ability of phagocytic cells to kill phagocytosed bacteria in the OC fed catfish. A tank study using the two main components of oregano oil (carvacrol and thymol) separately, and oregano EO demonstrated that fish fed oregano EO had significantly higher plasma lysozyme and catalase levels, and significantly lower mortality after intra-peritoneal injection of Aeromonas hydrophila [21]. A different pond study reported no differences in survival between the test or control diets, but no natural disease outbreaks occurred [22]. Amer et al. (2018) [20] demonstrated that dietary supplementation of cinnemaldehyde or thymol improved the antioxidant status of Nile tilapia fingerlings (Oreochromis niloticus) suggesting improved health and immunity. The immunomodulatory effects and innate immunity enhancement of prebiotics for use in aquaculture was reviewed by Akhter et al. (2015) [18] and the authors proposed that prebiotics can be used to control diseases.
In our study, gut tissues of OC fed fish had significantly more goblet cells. Increased numbers of goblet cells were not seen in Nile tilapia fed peppermint and melaleuca essential oils [47]. However, greater villus size did occur in the Nile tilapia. The authors concluded that this represented a larger intestinal surface and resulted in increased nutrient absorption. Increased surface area also occurred when OC fed catfish gut tissue demonstrated significantly greater muscularis, submucosa and lamina propria height after month 2, and greater villi height and width after months 2 and 3. This increased surface area resulted in greater nutrient absorption leading to significantly greater weight gain and SGR, and significantly lower FCR after 2 months in our pond study.
Immunohistochemistry demonstrated the presence of cytotoxic cells in the villi epithelium of gut section 2 after two and three months in OC fed catfish, while none of these cells were seen in the sections viewed from CON fed catfish. In gut section 3, cytotoxic cells were seen in the muscularis after two and three months, and after month 3 in the villi epithelium of OC fed catfish while no cytotoxic cells were seen in these locations in CON fed catfish. Overall, higher numbers of gut cytotoxic cells were seen in the OC fed catfish than CON fed catfish. More of these cells present in these tissues means more cells can rapidly respond to pathogen invasion.
Studies investigating the effects of feeding Yucca to catfish have determined growth parameters, fecal nitrogen and ammonia excretion in aquaria [6]. Significantly greater weight gain in fry fed Yucca was observed, and fingerlings demonstrated lower fecal nitrogen and lower excreted ammonia. These results are not directly comparable to pond studies. All ponds had water quality parameters within normal limits throughout the duration of this study. To determine if ONE Current™ (containing yucca) may affect water quality, further experiments using production stocking and feeding rates need to be performed.
In summary, our study is the first study to combine a prebiotic fiber with oregano, thyme, cinnamon and yucca to determine its’ effect on growth and immune function. Our results showed that ONE Current™ fed channel catfish fingerlings had greater gut surface area and greater weight gain and FCR, suggesting the greater surface area resulted in greater nutrient absorption. When extrapolated to commercial production, the increased gut surface area and resulting increased weight gains could be substantial. Another benefit includes enhanced immune cells functions. ONE Current™ fed catfish demonstrated increased overall health and ability to withstand an enteric pathogen because of greater macrophage phagocytosis and cytotoxic cell killing.
The use of the phytogenic feed additives in ONE Current™, or similar PFAs may be especially useful in hatcheries during catfish production by enhancing the innate immune system of fry and young fingerlings. Medicated feed is not readily available in the very small pellets sizes needed for these small fish and until fingerlings are old enough to be vaccinated, producers have few management options. High losses can occur at this stage. ONE Current™ may enhance disease resistance for fry during this vulnerable stage.
Funding sources: Mississippi State University funded Dr. Petrie-Hanson’s salary, part of Beth Peterman’s salary, laboratory space and equipment use. Ralco Nutrition, Inc. funded reagent costs, tank per diems, pond rental costs, control and test diets, Dr. Koppien-Fox’s salary and a portion of Beth Peterman’s salary.
References
- (2020). Catfish Production. Statistics, 2(202), 1–10.
- Sutili FJ, Gatlin DM, Heinzmann BM, Baldisserotto B (2018) Plant essential oils as fish diet additives: benefits on fish health and stability in feed. Reviews in Aquaculture. 10: 716-726.
- Windisch W, Schedle K, Plitzner C, Kroismayr A (2008) Use of phytogenic products as feed additives for swine and poultry. Journal of Animal Science 86: E140-E148.
- Ringo E, Olsen RE, Gifstad TO, Dalmo RA, Amlund H, et al. (2010) Prebiotics in aquaculture: a review. Aquaculture Nutrition 16: 117-136.
- Sahoo SP, Kaur D, Sethi APS, Sharma A, Chandra M (2015) Evaluation of Yucca schidigera extract as feed additive on performance of broiler chicks in winter season. Veterinary World 8: 556-560.
- Kelly AM, Kohler CC (2003) Effects of Yucca shidigera extract on growth, nitrogen retention, ammonia excretion, and toxicity in channel catfish Ictalurus punctatus and hybrid tilapia Oreochromis mossambicus x O. niloticus. Journal of the World Aquaculture Society 34: 156-161.
- Goncalves RA, Santos GA (2015) Phytogenic feed additive stimulate performance,health gains in fish, shrimp. Exp. Find. 59-62.
- Suphoronski SA, Chideroli RT, Facimoto CT, Mainardi RM, Souza FP, et al. (2019) Effects of a phytogenic, alone and associated with potassium diformate, on tilapia growth, immunity, gut microbiome and resistance against francisellosis. Scientific Reports 9: 1-14.
- Alemayehu TA, Geremew A, Getahun A (2018) The Role of Functional Feed Additives in Tilapia Nutrition. Fisheries and Aquaculture Journal, 09(02).
- Giannenas I, Triantafillou E, Stavrakakis S, Margaroni M, Mavridis S, et al. (2012) Assessment of dietary supplementation with carvacrol or thymol containing feed additives on performance, intestinal microbiota and antioxidant status of rainbow trout (Oncorhynchus mykiss). Aquaculture 350–353: 26–32.
- Koh C, Romano N, Zahrah AS, Ng W (2016) Effects of a dietary organic acids blend and oxytetracycline on the growth, nutrient utilization and total cultivable gut microbiota of the red hybrid tilapia, Oreochromis sp., and resistance to Streptococcus agalactiae. Aquaculture Research 47: 357-369.
- Karásková K, Suchy P, Strakova E (2015) Current use of phytogenic feed additives in animal nutrition: a review. Czech J Anim Sci 60: 521-530.
- Bharathi S, Antony C, Rajagopalasamy CBT, Uma A, Ahilan B, et al. (2019) Functional feed additives used in fish feeds. International Journal of Fisheries and Aquatic Studies 7: 44-52.
- Gibson GR, Probert HM, Loo JV, Rastall RA, Roberfroid MB (2004) “Dietary modulation of the human colonic microbiota: updating the concept of prebiotics,” Nutrition Research Reviews Vol. 17: 259-275.
- Dimitroglou A, Merrifield DL, Carnevali O, Picchietti S, Avella M, et al. (2011) Microbial manipulations to improve fish health and production – A Mediterranean perspective. Fish and Shellfish Immunology 30: 1-16.
- Gibson GR, Rastall RA, Fuller A (2003) “The health benefits of probiotics and prebiotics,” Oxford, UK: Blackwell Publishing Ltd.
- Awad E, Awaad A (2017) Role of medicinal plants on growth performance and immune status in fish. Fish and Shellfish Immunology 67: 40-54.
- Akhter N, Wu B, Memon AM, Mohsin M (2015) Probiotics and prebiotics associated with aquaculture: A review. Fish and Shellfish Immunology 45: 733-741.
- Ferreira PdMF, Nascimento LdS, Dias DC, Moreira DMV, Salaro AL, et al. (2014) Essential Oregano Oil as a Growth Promoter for the Yellowtail Tetra , Astyanax altiparanae. Journal of the World Aquaculture Society 45: 28-34.
- Amer SA, Metwally AE, Ahmed SAA (2018) The influence of dietary supplementation of cinnamaldehyde and thymol on the growth performance, immunity and antioxidant status of monosex Nile tilapia fingerlings (Oreochromis niloticus). Egyptian Journal of Aquatic Research 44: 251-256.
- Zheng ZL, Tan JYW, Liu HY, Zhou XH, Xiang X, et al. (2009) Evaluation of oregano essential oil (Origanum heracleoticum) on growth, antioxidant effect and resistance against Aeromonashydrophila in channel catfish (Ictalurus punctatus). Aquaculture 292: 214-218.
- Peterson BC, Bosworth BG, Li MH, Beltran R, Santos GA (2014) Assessment of a Phytogenic Feed Additive (Digestarom P.E.P. MGE) on Growth Performance, Processing Yield, Fillet Composition, and Survival of Channel Catfish. Journal of the World Aquaculture Society 45: 206-212.
- Grayfer, L., Kerimoglu, B., Yaparla, A., Hodgkinson, J. W., Xie, J., & Belosevic, M. (2018). Mechanisms of fish macrophage antimicrobial immunity. Frontiers in Immunology,9(MAY). https://doi.org/10.3389/fimmu.2018.01105
- Fischer, U., Utke, K., Somamoto, T., Köllner, B., Ototake, M., & Nakanishi, T. (2006). Cytotoxic activities of fish leucocytes. Fish and Shellfish Immunology, 20(2), 209–226. https://doi.org/10.1016/j.fsi.2005.03.013
- Sim, M. J. W., Rajagopalan, S., Altmann, D. M., Boyton, R. J., Sun, P. D., & Long, E. O. (2019). Human NK cell receptor KIR2DS4 detects a conserved bacterial epitope presented by HLA-C. Proceedings of the National Academy of Sciences of the United States of America, 116(26), 12964–12973. https://doi.org/10.1073/pnas.1903781116
- Esin, S., & Batoni, G. (2015). Natural killer cells: A coherent model for their functional role in Mycobacterium tuberculosis infection. Journal of Innate Immunity, 7(1), 11–24. https://doi.org/10.1159/000363321
- Esin, S., Batoni, G., Counoupas, C., Stringaro, A., Brancatisano, F. L., Colone, M., … Campa, M. (2008). Direct binding of human NK cell natural cytotoxicity receptor NKp44 to the surfaces of mycobacteria and other bacteria. Infection and Immunity, 76(4), 1719–1727. https://doi.org/10.1128/IAI.00870-07
- Gaber MM (2006) The effects of plant-protein-based diets supplemented with Yucca on growth,digestibility, and chemical composition of Nile tilapia (Oreochromis niloticus, L) fingerlings. Journal of the World Aquaculture Society 37: 74-81.
- Tidwell JH, Webster CD, Clark JA, Yancey DH (2004) Effects of Yucca shidigera Extract on Water Quality and Fish Growth in Recirculating-Water Aquaculture Systems . The Progressive Fish-Culturist.
- Güroy B, Mantoǧlu S, Kayali S, Şahin I (2014) Effect of dietary Yucca schidigera extract on growth, total ammonia-nitrogen excretion and haematological parameters of juvenile striped catfish Pangasianodon hypophthalmus. Aquaculture Research 45: 647-654.
- Hoseinifar SH, Sharifian M., Vesaghi MJ, Khalili M, Esteban MÁ (2014) The effects of dietary xylooligosaccharide on mucosal parameters, intestinal microbiota and morphology and growth performance of Caspian white fish (Rutilus frisii kutum) fry. Fish and Shellfish Immunology 39: 231-236.
- Boyd CE, Tucker CS (1998) Pond Aquaculture Water Quality Management.
- Ellis T, North B, Scott AP, Bromage NR, Porter M, e al. (2002) The relationships between stocking density and welfare in farmed rainbow trout. Journal of Fish Biology 61: 493-531.
- Collins LA, Thune RL (1996) Development of a defined minimal medium for the growth of Edwardsiella ictaluri. Applied and Environmental Microbiology 62: 848-852.
- Hébert P, Ainsworth AJ, Boyd B (2002) Histological enzyme and flow cytometric analysis of channel catfish intestinal tract immune cells. Developmental and Comparative Immunology26: 53-62.
- Andrianopoulos A, Lieschke GJ, Ellett F, Pase L, Hayman JW (2011) Mpeg1 Promoter Transgenes Direct Macrophage-Lineage Expression in Zebrafish. Blood 117: e49-56.
- Kordon AO, Scott MA, Ibrahim I., Abdelhamed H, Ahmed H, et al. (2016) Identification of Langerhans-like cells in the immunocompetent tissues of channel catfish, Ictalurus punctatus. Fish and Shellfish Immunology 58: 253-258.
- Xue L, Jerald Ainsworth A, Hanson L, Ye Q, Noya M (1999) Identification of a channel catfish, Ictalurus punctatus (Rafinesque), leukocyte-specific leucine zipper protein. Developmental and Comparative Immunology. 23: 149-163.
- Evans DL, Kaur H, Leary J, Praveen K, Jaso-Friedmann L (2005) Molecular characterization of a novel pattern recognition protein from nonspecific cytotoxic cells: Sequence analysis, phylogenetic comparisons and anti-microbial activity of a recombinant homologue. Developmental and Comparative Immunology 29: 1049-1064.
- Russo R, Shoemaker CA, Panangala VS, Klesius PH (2009) In vitro and in vivo interaction of macrophages from vaccinated and non-vaccinated channel catfish (Ictalurus punctatus) to Edwardsiella ictaluri. Fish and Shellfish Immunology 26: 543-552.
- Griess P (1879) Bemerkungen zu der abhandlung der H.H. Weselsky und Benedikt “Ueber einige azoverbindungen.” Chem. Ber12: 426-428.
- Booth NJ, Elkamel A, Thune RL (2006) Intracellular replication of Edwardsiella ictaluri in channel catfish macrophages. Journal of Aquatic Animal Health 18: 101-108.
- Petrie-Hanson L, Ainsworth AJ (2000) Differential cytochemical staining characteristics of channel catfish leukocytes identify cell populations in lymphoid organs. Veterinary Immunology and Immunopathology 73: 129-144.
- Robinson EH, Li HL (2015) Feed Conversion Ratio for Pond Raised Catfish, Mississippi Agriculture & Forestry Experiment Station Information Sheet No. 1364: 1-4.
- Kim MK, Lovell RT (1995) Effect of restricted feeding regimens on compensatory weight gain and body tissue changes in channel catfish Ictalurus punctatus in ponds. Aquaculture 135: 285-293.
- Song SK, Beck BR, Kim D, Park J, Kim J, et al. (2014) Prebiotics as immunostimulants in aquaculture: A review. Fish and Shellfish Immunology 40: 40-48.
- Valladão GMR, Gallani SU, Pala G, Jesus RB, Kotzent S, et al. (2017) Practical diets with essential oils of plants activate the complement system and alter the intestinal morphology of Nile tilapia. Aquaculture Research 48: 5640-5649.