Publication Information
ISSN 2691-8803
Frequency: Continuous
Format: PDF and HTML
Versions: Online (Open Access)
Year first Published: 2019
Language: English
| Journal Menu |
| Editorial Board |
| Reviewer Board |
| Articles |
| Open Access |
| Special Issue Proposals |
| Guidelines for Authors |
| Guidelines for Editors |
| Guidelines for Reviewers |
| Membership |
| Fee and Guidelines |
 |
Correlation of USA Population Density and SARS-CoV-2 Pandemic Mortality at Six Months
Bowerman RJ*
Yukon-Kuskokwim Delta Regional Hospital, Bethel, Alaska USA
Received Date: January 12, 2022; Accepted Date: January 24, 2022; Published Date: January 31, 2022;
*Corresponding author: Bowerman RJ. Yukon-Kuskokwim Delta Regional Hospital, +1 907 545 3939 / PO Box 847, Bethel, AK 99559 USA. Email: rbowermanmd@yahoo.com
Citation: Bowerman RJ (2022) Correlation of USA Population Density and SARS-CoV-2 Pandemic Mortality at Six Months. Adv Pub Health Com Trop Med: APCTM-142.
DOI: 10.37722/APHCTM.2022101
Abstract
Background
The aim of this study was to examine what effect population density might have on SARS-CoV-2 (COVID-19)-related deaths and cases for the first six months of the COVID-19 pandemic in the United States of America (US) in light of evidence that the highest population density regions were reporting high COVID-related death rates-not unlike the 1918 influenza pandemic. If deaths (and cases) are increased, is it simply a matter of increased population density for certain states or are there other contributing factors or clues that would allow a more effective response?
Methods
This correlational study used publicly accessible records of COVID-19-related death and case rates associated with population densities of the 50 US state regions. Pearson’s Correlation Analysis was applied to the linear regression of scatter graphs for the above variables using Epi Info, Version 7.2.4.0. Additionally, population density decile average COVID-19-related death rate comparisons were analyzed using the Epi Info 2 x 2 table calculator for Chi Square (Mantel Haenzel) with Taylor Series odds ratios.
Results
A strong positive correlation [Pearson’s (r) = 0.7556, p<0.0001] to population density was noted for deaths but not cases. Using population density deciles, the average pandemic-related mortality of the five most densely populated states (New Jersey, Rhode Island, Massachusetts, Connecticut, Maryland) was significantly higher (p<0.0000001) than the least densely populated states (South Dakota, North Dakota, Montana, Wyoming, Alaska) (Odds Ratio = 7.88, [95% Confidence Interval = 6.67-9.32]) with a general dose-response trend observed for all deciles.
Conclusion
In the setting of the COVID-19 pandemic in the US, population density on a state level appears to reliably correlate with COVID-19 deaths independent of other factors. Any correlation of population density to COVID-19 case rates was much less profound. In the end, a state’s population density is an imperfect measure but still may be the best predictor for pandemic deaths and cases, as it was a hundred years ago, to determine which regions should be first to receive prevention and mitigation resources early in a pandemic. Also, lower population density, by itself, may act as an inherent social distance proxy-always present but not needing enforcement vigilance. Given this knowledge, prevention strategies might even consider moving vulnerable populations to a less densely populated area or evacuation. Also, focusing more resources on prevention and treatment therapeutics development in higher risk densely populated areas early-on might allow for a more tangible early benefit from resources invested.
Keywords: COVID-19; KMK (Kermack-McKendrick) statistical model; pandemic; SARS-CoV-2; United States of America
Background
By the end of the first six months that the novel coronavirus, SARS-CoV-2 (COVID-19), was declared a pandemic in 2020 by the World Health Organization, the United States of America (US) alone had reported 7 million cases, including 200,000 deaths. Pandemics are common to human history [1], especially influenza pandemics over the past two centuries, as are the many strategies, mostly related to social-distancing, used early-on by nations attempting to decrease death rates until a medical cure or preferably an effective vaccine, can by developed. Although not recommended as a mitigation strategy [2], economic lockdowns, severely limiting human movement, were commonly used throughout the world in the first months of the COVID-19 pandemic and even continue, or are re-established, in many places today in response to case spikes. Thus far in this pandemic, little has been mentioned publicly how population density could be a “catalyst factor,” or accelerant [3], making this pandemic much worse in one location over another-all other factors being equal. This was, however, a key finding from post-1918 influenza pandemic studies [4].
In the US, each of the 50 state regions, with some federal oversight, was allowed to pursue their own prevention and mitigation strategy for the novel coronavirus with varied outcomes following an initial two-week (extended to 6 weeks) period to allow the medical infrastructure time to prepare for a surge of cases. Population density has been studied for how it may have affected the magnitude of past pandemics with results generally supportive of a correlation [4, 5]. This relationship (especially with the observation that the most and least densely populated states [New Jersey and Alaska respectively] were consistently reporting the highest and lowest COVID-19 mortality rates respectively) for the current US pandemic was the focus of this study. How aggressive each state might have been in social distancing measures, severity of economic lockdown or their overall pandemic response effectiveness by whatever agreed upon standard and resultant mortality outcome is beyond this study’s scope. Also, during the study period, no general vaccine or preventive or treatment programs for COVID-19 were in effect in any state that might have affected that state’s study outcome.
Materials and Methods
COVID-19 case and death rates (accessed 2020.09.20) were plotted against each state’s known population density https://state.1keydata.com/state-population-density.php (using the estimated 2015 population based on U.S. Census data, accessed 2020.09.21). Using Epi Info, Version 7.2.4.0 https://www.cdc.gov/epiinfo/pc.html scatter graphs, data was analyzed in Epi Info for correlation (Pearson’s Correlation Analysis) by linear regression. Also, US state population density decile comparisons of average COVID-19-related death rates were analyzed using Mantel Haenzel Chi Square with Taylor Series odds ratio by the 2 x 2 table calculator also from the above online Epi Info reference.
Results
As population density increased there was a strong positive correlation [Pearson’s (r) = 0.7556, p<0.0001] with increase in the COVID-19 death rate (Figure 1) in more dense regions. A weaker but still small positive correlation [Pearson’s (r) = 0.1369, p=0.34] was noted for COVID-19 case rates. However, when only the highest and lowest population density extremes (n=21) were considered (which essentially excluded states in the 10 to 170 persons per square mile middle density range), this correlation was strengthened to a moderate correlation [Pearson’s (r) = 0.4162, p=0.06]. The excluded middle population density group (a majority of 29 states), included a wide range of COVID-19 case rates ranging from 2,748 (Vermont) to 34,6800 (Louisiana) cases per million without obvious correlation to density.
Decile
States
Average
Pop DensityAverage
Death RateOdds
Ratio95% CI
p-value
1
SD ND MT WY AK
7
155
–
–
2
KS NV NE ID NM
25
317
2.05
1.69-2.48
<0.0000001
3
IA CO ME OR UT
46
223
1.44
1.17-1.76
0.000235
4
UT MS AZ AR OK
61
484
3.12
2.61-3.74
<0.0000001
5
TX AL MO WVMN
87
374
2.41
2.00-2.91
<0.0000001
6
NH KY WA LA WI
116
441
2.85
2.37-3.42
<0.0000001
7
IN GA MI SC TN
172
557
3.60
3.01-4.30
<0.0000001
8
CA IL HI VA NC
225
362
2.34
1.94-2.83
<0.0000001
9
DE NY FL PA OH
370
798
5.15
4.35-6.14
<0.0000001
10
NJ RI MA CT MD
888
1221
7.89
6.67-9.32
<0.0000001
- Population density (persons per square mile) is based on the estimated 2015 population from the U.S. Census.
- Death rate (COVID-19-related deaths per 1 million population) is from Worldometer
https://www.worldometers.info/coronavirus/country.us/ accessed 20.09.20.
From the population density decile comparison (Figure 2), the average pandemic-related mortality in the five states (New Jersey, Rhode Island, Massachusetts, Connecticut, Maryland) with the highest average population density (Decile 10) was found to be significantly higher (p<0.0000001) than (Decile 1) states with the least average population density (South Dakota, North Dakota, Montana, Wyoming, Alaska) (Odds Ratio = 7.88, [95% Confidence Interval = 6.67-9.32]). A generally consistent dose-response trend for average death rates was observed for population density deciles and in addition every decile above Decile 1 had a greater average death rate (p<0.000235) than that found in Decile 1.
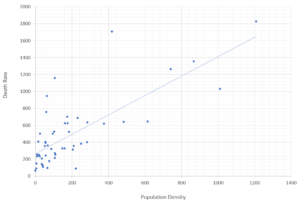
Figure 2: Average COVID-19-related death rate for each average state population density decile.
Comparisons over the first six months of the COVID-19 pandemic using Odds Ratios from Mantel Haenzel Chi Square with 95% Taylor Series confidence series calculated in Epi Info.
- States grouped in deciles listed by US Postal Service two-letter codes https://about.usps.com/who-we-are/postal-history/state-abbreviations.htm
- Population density (persons per square mile) of 5-state average per decile is based on the estimated 2015 population from the U.S. Census and rounded to the nearest square mile.
- Death rate (COVID-19-related deaths per 1 million population) of 5-state average per decile is based on Worldometer https://www.worldometers.info/coronavirus/country.us/ accessed 20.09.20.
Discussion
So, how is it that a higher population density of a large region can lead to more COVID-19 deaths assuming overall healthcare is equable, the proportion of medically vulnerable are the same and are similarly protected? A reasonable explanation might be that COVID-19 is a very contagious virus that will spread more in crowded or population dense situations and perhaps even more importantly be transmitted by larger inoculum, thus resulting in a more severe infection that might more easily overwhelm an immune system. A less crowded community would provide less opportunity for this to happen, acting as an inherent social distance proxy-always present but not needing enforcement vigilance. In today’s rapid air travel world, unlike in previous centuries, a novel infection can get somewhere remote sooner rather than later. Once there, population density, functioning as a “catalyst factor,” can accelerate transmission of a deadly pathogen with death and destruction through an unfortunate community.
The traditional Kermack-McKendrick (KMK) statistical model from 1927, which assumes more epidemic deaths as population density increases, fits the above situation [5]. When the 1918 influenza pandemic in British India was studied, the KMK model represented what was observed [4]. There, a population density threshold level of 175 persons per square mile for districts was found to have a higher death rate than districts less dense. Population density correlated to pandemic death was also noted in the US [6] in 1918 and a century later in Nigeria [7] in 2020 during the current COVID-19 pandemic. A recent version of the KMK model, a novel terrain-based threat surface model, attempts to explain the role of accelerated disease transmission in dense populations in limited areas, as in India, but not necessarily on a larger scale [8].
This current US study is supportive of the above dynamics concerning COVID-19 deaths. By simply using the general population density for each state, which ranges a thousand-fold from 1.3 (Alaska) to 1,207.8 (New Jersey) persons per square mile (coincidentally these are the states with the lowest and highest death rates respectively), all states fall in between the two above extremes, following the regression line faithfully (Figure 1). Three states, Mississippi, Louisiana, and New York vary most (and in excess) from this significant regression line. Reasons for these three remarkably higher (if not outlier) death rates might include, but are not limited to, higher nursing home infection rates, strained or poorly prepared healthcare and public health systems, poor population health demographics, a higher proportion of an elderly or extreme elderly population and perhaps worst of all, poor decision-making by elected officials and government entities with emergency powers. Knowing which areas of the US might predictably have increased deaths, with established thresholds, would be a good place to initially concentrate prevention and mitigation resources. This was also a recommendation from the British India study [4].
There are also reports of a correlation of population density with COVID-19 case rates in the first three months of the COVID-19 pandemic in Algeria (death rates not studied) where cases strongly correlated with city population density [9]. Such a correlation was also found in Taiwan during the 2009-2010 H1N1 influenza pandemic [10].
Cases precede deaths but do not always correlate in a coordinated fashion and is evidenced in the current study with a mixed outcome picture for COVID-19 cases. Here, a majority of states are in a moderate 10-170 density range with a large difference in case rates without correlation to density. But outside this density range, correlation per the KMK model exists. So why in this current study are COVID-19 cases not correlating with increase in population density as the deaths are? Is it possible that there is disparate or invalid identification of COVID-19 cases from state to state including false positive or negative values causing these discrepancies? Perhaps, the reason is more basic that death is a more reliable endpoint and not dependent on testing shortcomings listed above.
In the setting of the SARS-CoV-2 pandemic, it appears that population density might be an accelerant for COVID-19 death rates regardless of what each state’s different mitigation or prevention strategy might be. This is best exemplified by this study’s result that the chance of COVID-related death in one of the most densely population US states, with all other factors equal, may be as high as 7.88 times (CI = 6.67-9.32) that of living in a much less dense state.
COVID-19 case rates do correlate with a state’s population density when extremely high or low but for the majority of states (in the middle 10-170 persons per square mile density range), other factors appear to be in play. In the end, a state’s population density is an imperfect variable but still may be the best predictor we have for pandemic deaths and cases and determine which states should be the first to receive prevention and mitigation resources early in a pandemic. This would allow focusing more resources on prevention and treatment therapeutics development in higher risk densely populated areas early-on, providing a more tangible early benefit than an expensive vaccine effort designed for long term benefit. It would also allow for consideration of prevention strategies that might even include moving vulnerable populations to less dense population settings such as in evacuation, the most severe form of social-distancing which occurred in Haiti in both 2009 and 2010 to counter cholera outbreaks [11]. Lower population density may also act as an inherent social distance proxy-always present but not needing enforcement vigilance.
References
- Saunders-Hastings PR, Krewski D (2016) Reviewing the history of pandemic influenza: understanding patterns of emergence and transmission. Pathogens, 5:66.
- Inglesby TV, Nuzzo JB, O’Toole T, Henderson DA (2006) Disease mitigation measures in the control of pandemic influenza. Biosecur Bioterror, 4:366-375.
- Hamidi S, Sabouri S, Ewing R (2020) Does density aggravate COVID-19 pandemic? Journal of the American Planning Association, 86:495-509.
- Siddarth C, Kassens-Noor E, Kuljanin G, Vertalka J (2013) International Journal of Health Geographics 2013. A geographic analysis of population density in the influenza pandemic of 1918-19; 12:9.
- Li R, Richmond P, Roehner B (2018) Effect of population density on epidemics. Physica A: Statistical mechanics and its applications, 510:713-24.
- Garrett TA. Working paper CA0721. 2010: Federal Reserve Bank of St Louis Web site; 2007. Economic effects of the 1918 influenza pandemic.
- Ohadike DC (1991) Diffusion and physiological responses to the influenza pandemic of 1918-1919 in Nigeria. Social Science and Medicine, 32:1393-1399.
- Ted G Lewis, Waleed I Al Mannai (2021) Modeling the Spread of COVID-19 Using a Novel Threat Surface, 9:41-50.
- Kadi N, Khelfaoui M (2020) Population density, a factor in the spread of COVID-19 in Algeria: statistic study. Bull Natl Res Cent, 44:138.
- Kao CL, Chan TC, Tsai CH, Chu KY, Chuang LY, et al. (2012) Emerged HA and NA mutants of the pandemic influenza H1N1 viruses with increasing epidemiological significance in Taipei and Kaohsiung, Taiwan, 2009-2010. PloS One, 7: e31162.
- Margesson R, Taft-Morales M (2010) Haiti earthquake: crisis and response. Library of Congress, Washington, DC Congressional Research Service.
