Publication Information
Frequency: Continuous
Format: PDF and HTML
Versions: Online (Open Access)
Year first Published: 2019
Language: English
| Journal Menu |
| Editorial Board |
| Reviewer Board |
| Articles |
| Open Access |
| Special Issue Proposals |
| Guidelines for Authors |
| Guidelines for Editors |
| Guidelines for Reviewers |
| Membership |
| Fee and Guidelines |
 |
Genetic Variation in Flowering Time of Soybean Based On DNA Markers
Truong Trong Ngon1*, Tran Thi Thanh Thuy2, Suk-Ha Lee3
1Biotechnology R & D Insititute, Can Tho University, Can Tho, Vietnam
2College of Agriculture, Can Tho University, Can Tho, Vietnam
3Department of Crop Science and Biotechnology, Seoul National University, Seoul, Korea
Received Date: April 09, 2021; Accepted Date: April 12, 2021; Published Date: April 19, 2021;
*Corresponding author: Truong Trong Ngon, Biotechnology R & D Insititute, Can Tho University, Can Tho, Vietnam, 84988076677. Email: ttngon@ctu.edu.vn
Citation: Ngon TT, Thuy TTT, Lee SH, (2021) Genetic Variation in Flowering Time of Soybean Based On DNA Markers. Adv Agri Horti and Ento: AAHE-151.
DOI: 10.37722/AAHAE.2021402
Abstract
Flowering time is one of the important target traits in a soybean breeding program. Photoperiod and temperature influence the vegetative and reproductive development from emergence to maturity in soybean. The objective of this study was to analyze genetic variation in flowering time based on agronomic performance and SSR marker. One hundred and eight soybean cultivars evaluated in this study were collected from different geographic regions such as China, Japan, Korea, and Vietnam. Days to flowering and maturity were recorded in the two different field in Suwon, Korea (127o02’ E longitude, 37o26’ N latitude), and Can Tho, Vietnam (105O54’E longitude and 10O9’N latitude). Genotype data were also collected at one-hundred and twenty six SSR loci. Genotypic variation was observed in flowering time. Vietnamese cultivars were more sensitive to day length. There was a large variation of maturity among cultivars. Chinese cultivar group was more diverse than the other groups. Through 126 observed loci, the number of amplified bands was common from four to six bands. R2 value used to estimate linkage disequilibrium (LD), varied according to LGs. It depended on the distance and number of observed loci. 18 loci were associated closely with flowering time as well as maturity at p < 10-4. Cluster analyis, based on Nei’s distance and Bayesian method, revealed that Vietnamese and Korean cultivar groups were quite different from the other groups; meanwhile Chinese and Japanese cultivar groups were close. These results will be useful for soybean variety improvement program in future.
Keywords: Linkage group; R1 and R8 stage; Simple Sequence Repeats (SSRs)
Introduction
Soybean cultivars have been originated from different regions and production areas based on their responsiveness to environment during the growing season. Soybeans are classified as short-day plants [9] and are assigned to maturity groups according to the time required to maturity at specified latitudes. Days to flowering in soybean not only depend on cultivars but also on environmental conditions [13]. Photoperiod influences the development of soybeans from time of emergence to anthesis [3], [10]. Day length and temperature are considered two important factors regulating flowering time in soybean cultivars.
In order to evaluate soybean genetic resources at the DNA level, utilization of soybean simple sequence repeats (SSRs) marker to classify cultivars and investigation of genetic diversity is necessitated. Simple sequence repeat (SSR) marker belong to the family of repetitive non-coding DNA sequence. Microsatellite marker has been applied to many studies, such as variety identification, genetic patterns, phylogenesis, and so on. High rates of polymorphism ensure that SSR markers are efficient for germplasm evaluation and in marker-assisted breeding programmes.
The aim of this study is to evaluate the genetic variation in flowering time among soybean cultivar groups based on flowering character and simple sequence repeats marker, analyze linkage disequilibrium, and identify marker-trait association.
Materials and Methods
General Environmental Conditions
All cultivar groups were grown under field conditions. The first experiment was conducted in Suwon, Korea at 127o02’ E longitude and 37o26’ N latitude. The second experiment was planted in Can Tho city, Vietnam at 105O54’E longitude and 10O9’N latitude.
The mean temperature in Vietnam was higher and less fluctuant than the mean temperature in Korea. The lowest temperature about 26oC falled in January, it then gradually increased and reached the highest in April about 29oC in Can Tho, Vietnam. The temperature influenced the growth and development of soybean crop. Seeds germinated rapidly, and soybean plant developed well under high temperature.
In Korea, the mean temperature varied from 14oC (in October) to 27oC (in August). The germination of seed was a little slow due to low temperature at the end of May. Then, the mean temperature gradually increased to 27oC in August. All soybean cultivars grew and developed well. However, the mean temperature declined rapidly about 14oC to 10oC at the end of season, this caused some soybean cultivars incompletely matured.
The photoperiod at Can Tho, Vietnam including the civil twilight ranged from 11:50 hours to 12:05 hours during soybean production season from January to April. This condition made soybean cultivars flower early about one month after sowing. Meanwhile, the photoperiod at Suwon, Korea was from 11 hours to 14:50 hours. The longest photoperiod was about 14:50 hours in June. Soybean plants responded to long-day condition, so the flowering-time of soybean cultivars was delayed more than one month as compared with Vietnamese condition. In general, temperature and photoperiod affect during soybean growth and development. All stages of soybean plant are almost influenced by temperature, but the soybean plant does not appear to be sensitive to photoperiod at all time during its development [1].
Soybean Plant Material
A total of 108 soybean cultivars collected from different geographic regions were used in this study. They were classified into two groups, one from low latitude region (Vietnamese cultivars) and the other from high latitude regions (Chinese, Japanese, and Korean cultivars).
DNA Extraction
Genomic DNAs were isolated from frozen fresh leaf tissue of ten seedlings (10-12 days old) for each cultivar. Sampled leaf tissues were ground in liquid nitrogen and stored at –70oC. DNA was extracted according to the protocol described by Shure et al. (1983) with some modifications. The precipitated DNA was dissolved in 10mM TE buffer and stored at –20oC until use. The final DNA concentration was adjusted to 20ng/ml for PCR reaction.
PCR Amplification of SSR loci
PCR amplification was performed on each of the 108 soybean genotypes, using primers for each SSR locus. Reaction mixtures contained 20ng of soybean genomic DNA, 5mM 3’ and 5’ end primers, 2.5M dNTPs, 10X PCR buffer containing 2mM MgCl2, and 2 unit of Taq DNA polymerase, in a total volume of 8mL. All PCR reactions consisted of 1 cycle of 12 sec with incubation at 94oC, 32 cycles of 25 sec of denaturation at 94oC, 25 sec of annealing at 46oC and 25 sec of extension at 68oC, and final step for ever at 4oC, on MJ Research model PTC 225 Peltier thermocycler (MJ Research, Watertown, Mass.).
Microsatellite Allele Sizing
One-hundred and twenty six SSR loci with tri-nucleotide repeats (att) and di-nucleotide repeats (ct_) or (at_) motifs described by Tasma and Shoemaker (2003) [27] were tested for genotyping assays. The sequences of the Forward and Reverse primers are available at the soybean website USDA-ARS Soybean Genome Database (http://129.186.26.94/SSR.html).
PCR-amplified fragments from differentially labeled SSR primers, and with non-overlaping fragment sizes were simultaneously analyzed in the same gel lane and separate on an ABI Prism 377 DNA sequencer in National Instrumentation Center for Environmental Management (NICEM), Seoul National University. Gene Scanâ software and Genotyperâ software (Applied Biosystems, Perkin Elmer) were used for automated data collection and to determine the allele sizes in base pairs (bp), based on the internal standard.
Data Analysis
To understand the genetic variation of flowering time, days to flowering (R1 stage), and maturity (R8 stage) were evaluated. In addition, the length from R1 to R8 stage was calculated at two differental experimental sites. Genetic diversity was measured by evaluating the differences in allele number per locus, allele frequency, allele sizes, polymorphic information content, and genetic diversity (GD). To measure the informativeness of each SSR locus, the PIC’s values, was calculated using the following formula [25]:
![]() Where pij is the frequency of the jth allele for ith locus summed across all alleles in the locus.
Where pij is the frequency of the jth allele for ith locus summed across all alleles in the locus.
To evaluate molecular variance within and among populations, GenAlEx software [20] was used. In addition, TASSEL software [5] was applied to analyze linkage disequilibrium. Strucutre version 2.0 software [21] was used for analyzing population structure.
Results
Agronomic Performances
Evaluation of quantitative characteristics revealed that considerable variation was found among soybean cultivars within and among groups. Days to flowering (R1 stage) varied from cultivar to another (Table 1).
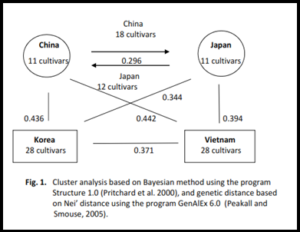
Four groups had flowering-time from twenty-eight to thirty-five days, when they were grown in low latitude region. Days to flowering varied from 28 days for Japanese and Korean cultivar groups to 35 days for Vietnamese cultivar group. This period varied from fifty to ninety days after sowing when they were grown in high latitude region (Table 1). The critical daylength (the duration above which flowering is delayed or prevented) differs widely between cultivars; it varies from about 13hr for geneotypes adapted to the tropics to 18 to 24hr for cultivars grown at more extreme latitudes [15], [24]. The cultivars flowered early because they responded to short-day condition (about 11:59 hours in February) at Can Tho, Vietnam. Meanwhile, the photoperiod reached to 14:55 hours in June at Suwon, Korea, then it gradually shortened. This might be due to the fact that flowering time of these cultivars was delayed more than one month in long-day condition. Vietnamese group had wide variation in days to flowering about three-fold time when it was grown in high latitude. Meanwhile, the flowering-time of Chinese, Japanese, and Korean cultivar groups was two-fold time when they grew in high latitude, indicating that Vietnamese cultivar group was more sensitive to photoperiod than other groups. There was a large variation of maturity (R8 stage) among cultivar groups. Maturity was not so different among four cultivar groups; it prolonged from eighty to eighty-four day under short-day condition; meanwhile this period varied so much more than four months when they were grown in high latitude (Table 1). The maturity differences of cultivars varied from 45 days to 75 days (Table 1). The differences showed that R1 (days to flower) stage influenced on maturity and period from R1 to R8 stage of cultivars. Cultivars early flowered, normally their maturity was shorter than late flowering ones. Analysis of Molecular Variance Two components contributed to population variance, one was due to within population, and the other was due to among populations. An AMOVA analysis showed that 90% of the variance in allele frequencies was due to within population variation, and 10% to variance between (or among) population (Table 2). Number of Amplified Alleles Number of amplified bands varied from 2 to 12 bands (Table 3). Loci gave 4-6 amplified bands were common. Chinese cultivar group gave highest amplified bands (about 761 amplified bands), meanwhile Korean cultivar group gave lowest (about 669 amplified bands) (Table 3). The higher number of amplified bands, the higher PIC values. The higher number of amplified bands demonstrated that observed genotypes were diverse. Linkage Disequilibrium Analysis Linkage disequilibrium (LD), simply defined, is the non-random association of alleles at different loci. Although concepts of LD date to the early part of the twentieth century [12], the first commonly used LD measure, D’, was developed by Richard Lewontin [14]. D’ is a standard disequilibrium coefficient. It is equal to one when LD is complete. Another parameter, r2 , was also used to measure LD. It can be defined as a square root of allele frequency coefficient [11], [28]. When r is equal to one, it is said that LD is complete. Of 20 observed linkage groups, four linkage groups were chosen to analyze LD with 7-10 loci for each linkage group. The higher r2 values, the more linkage disequilibrium (Table 4). r2 value depends on locus distance, linkage group, and number of observed loci. The low r2 value between two loci indicates weak linkage between these loci or between locus and interested gene. This is very important when using marker to detect interested gene for improving certain trait. Cluster Analysis Two types of clustering methods were used. One was distance-based method, and the other was model-based method [21]. The model-based method with Baysesian approach provides a coherent framework for incorporating the inherent uncertainty of parameter estimates into the inference procedure and for evaluating the strength of evidence for the inferred clustering. This approach used model of Markov chain Monte Carlo (MCMC) to compute exactly the distribution of parameter estimates. Nei’s genetic distance of soybean cultivar groups was presented in Figure 1. Vietnamese and Chinese goups were far in distance, meanwhile Japanese and Chinese groups were near in distance. Model-based method by Bayesian clustering approach gave the same result of distance-based method. Figure 1 illustrated for these results. The genetic relation of four cultivar groups explained that Vietnamese and Chinese genotype groups showed far distance, as well as Korean and Chinese genotype groups. 18 Chinese genotypes were similar to Japanese genotypes. Chinese and Japanese cultivar group could be mixed. Meanwhile, Korean and Vietnamese cultivar groups were separated. In breeding, the genetic advance only gained when two parents used for crossing were far genetic distance. Discussion Flowering times of field-grown soybean are complicated process including the interaction between genotype and environmental factor (i.e temperature, photoperiod), and the impact of internal clues to physiological process [1]. Significant differences among soybean cultivar groups indicating that there is genetic variation of this trait in soybean. Days to flowering is not only influenced by environmental factors (photoperiod and temperature) but also by genetic factor. Our results showed that cultivar group originated from low latitude was more photo-sensitive than the others from high latitude. The country or latitude of origin of an accession has limited use in predicting adaptation to a specific environment as might be expected if photoperiod responses were all important [6], and the effects of temperature on photoperiod insensitive genotypes can be so pronounced that their supposedly broad-adaptation to a wide range of latitudes is open to question [26]. In our study, Vietnamese soybean cultivars belonged to photoperiod-sensitive groups as they prolonged flowering time in temperate condition. Meanwhile, cultivar groups of Korean, Japanese, and Chinese were less photoperiod-sensitive. SSRs marker are advantageous to applied plant breeding because they are co-dominant, easily assayed and detected high level of polymorphism [17]. SSRs marker detected genetic variation of flowering time, primers related to candidate genes controlling flowering time generated high polymorphism loci. These polymorphism of SSR loci detected in this study was consistent with previous studies by Akkaya (1992) [2], Morgante and Olivieri (1994) [18], Maughan et al. (1995) [16], Doldi et al. (1997) [8], Diwan and Cregan (1997) [7], and Narvel et al. (2000) [19]. The obtained genetic diversity (GD) was in a good agreement with the data of Rongwen et al. (1995) [23], who found a mean value of 0.74 in a group of 96 soybean genotypes. It is in line with the results of Diwan and Cregan (1997) [7], who found mean GD values close to 0.69 in a group of 36 commercial soybean lines, and in agreement with the data of Narvel et al. (2000) [19], who detected a mean value of 0.50 ± 0.02 in a group of 39 elite cultivars. Distance-based methods are usually easy to apply and are often visually appealing. In the genetics literature, it has been common to adapt distance-based phylogenetic algorithms, such as neighbor-joining to clustering multilocus genotype data (Bowcock et al. 1994) [4]. Model-based method with Bayesian clustering approach can be applied to various types of markers like RFLPs, SSRs, SNPs…. But it assumes that the markers are unlinked and at linkage equilibrium with one another within populations. It also assumes Hardy-Weinberg equilibrium within populations (Pritchard et al., 2000) [21]. In our study, two methods gave the same result. In addition, model-based method provided information to explain the population genetic structure, this can help us well understand evolution and origin of cultivars as well as species. In conclusion, understanding the geographical distribution and genetic variation of cultivars will provide useful information and abundant source genes for soybean breeding program to make new cultivars adapting to a wide range of ecological regions Literature Cited
Agronomic
Parameter
Chinese group
Japanese group
Korean group
Vietnamese group
Performance
Latitude
10°N*
37°2N**
Differ***
10°N*
37°2N**
Differ***
10°N*
37°2N**
Differ***
10°N*
37°2N**
Differ***
Days to Flowering
Mean
29±4.32
50±3.92
21±4.40
28±0.82
51±5.95
23±6.87
28±1.4
57±10.24
29±10.8
35±4.9
91±11.89
56±12.3
(R1 Stage)
CV%
14.81
7.82
16.56
2.97
11.72
13.75
4.88
17.91
8.69
13.97
13.14
14.83
Maturity
Mean
84±2.69
129±5.3
45±6.88
80±5.39
137±9.61
57±10.5
81±4.9
138±12.6
57±12.6
84±7.5
159±12.l
75±12.2
(R8 Stage)
CV%
3.22
3.94
8.14
6.72
7.03
12.71
5.99
9.08
10.72
8.88
7.61
7.65
Length of
Mean
55±5.08
79±6.1
24±6.96
53±5.1
86±8.9
33±10.6
53±4.8
81±9.27
28±8.36
49±5.1
68±10.45
19±13.6
R1- R8
CV%
9.32
7.67
10.8
9.67
10.36
13.41
9.12
11.43
11.3
10.24
15.35
18.61
Remarks:
10°N*: cultivars grown in Vietnam.
37°2N**: cultivars grown in Korea.
Differ***: Difference days to flower between Korea and Vietnam.
Source of variance
df
SS
MS
Est. Var.
%
Value
p < 0.01
Among pop.
3
323813.8
107937.9
1727.6
10
7.253***
3.88
Within pop.
212
3154873.0
14881.5
14881.5
90
Cultivar groups
Amplified band number through 126 loci
2
3
4
5
6
7
8
9
10
11
12
No. of alleles/locus
Total
China
0
2
21
31
34
14
11
9
1
1
2
6.04
761
Japan
1
15
26
28
20
13
10
5
4
3
1
5.65
712
Korea
0
13
38
27
23
12
4
4
3
1
1
5.30
669
Vietnam
0
4
31
39
18
14
6
5
4
3
2
5.77
727
Mean
0.3
8
29
31
23
13
7
6
3
2
1
5.69
717
SD
0.5
5.8
7.4
5.2
7.8
1.9
3.3
2.5
1.4
1.2
0.5
0.31
38.1
Linkage groups
Loci
Distance (cM)
r2
A2
Satt177
36.770
0.256
Satt315
45.291
0.321
Satt187
54.917
0.244
Satt341
77.695
0.175
Satt327
109.828
0.307
Satt470
116.731
0.263
Satt409
145.565
0.088
Satt429
162.033
C1
Satt190
73.324
0.360
Satt399
76.228
0.201
Satt294
78.645
0.156
Sat_042
82.506
0.111
Satt524
120.115
0.156
Satt180
127.774
D2
Satt135
26.049
0.231
Satt014
29.562
0.251
Satt498
32.144
0.187
Satt372
39.345
0.245
Satt154
57.070
0.107
Satt208
67.910
0.226
Satt397
69.296
0.217
Satt389
79.231
0.231
Satt226
85.148
0.136
Satt386
124.998
L
Satt495
0.000
0.236
Satt388
23.547
0.207
Satt143
30.187
0.234
Satt398
30.581
0.184
Satt006
92.001
0.245
Satt513
106.366
0.201
Satt373
107.240