Publication Information
ISSN 2691-8803
Frequency: Continuous
Format: PDF and HTML
Versions: Online (Open Access)
Year first Published: 2019
Language: English
| Journal Menu |
| Editorial Board |
| Reviewer Board |
| Articles |
| Open Access |
| Special Issue Proposals |
| Guidelines for Authors |
| Guidelines for Editors |
| Guidelines for Reviewers |
| Membership |
| Fee and Guidelines |
 |
Tracer Dilution Profiles: Variation of External Stress to Determine Fault Interconnections
Michael Verreault *
Hydro-Ressources Inc., Indio, California, USA.
Received Date: January 07, 2025; Accepted Date: January 15, 2025; Published Date: February 10, 2025;
*Corresponding author: Michael Verreault, Hydro-Ressources Inc., Indio, California, USA; Email: mv@hydroressources.com
Citation: Verreault M (2025) Tracer Dilution Profiles: Variation of External Stress to Determine Fault Interconnections. Enviro Sci Poll Res Manag : ESPEM-163.
DOI: 10.37722/ESPRAM.2025102
Abstract
In the context of mine dewatering in fractured rock formations, the accurate identification of laterally extensive, water-bearing discontinuities is often critical for optimizing mining operations. This process can enable the reduction of water inflows and improve the strategic placement of pumping wells as well as the determination of efficient extraction rates. While conventional field characterization techniques—such as packer tests, slug tests, and injection or air lift tests—provide some insights into the hydrogeological properties of fractured rock aquifers, these methods frequently suffer from inherent uncertainties and scale-dependent limitations.
To overcome these challenges, a novel adaptation of the traditional tracer point dilution method (PDM) has been developed and presented in a previous paper for application in fractured rock environments. This enhanced methodology is specifically designed to better identify and characterize water-bearing discontinuities by leveraging transient tracer concentration profiles (TDP). These modifications to the PDM offer a significant improvement in accuracy over traditional approaches, particularly for identifying well-connected, water-bearing discontinuities in complex geological settings.
To define discontinuities and their interconnections, various types of traditional tracer tests have been performed for decades, such as convergent, natural gradient, and divergent tracer tests. These require accurate planning to ensure that false negative results do not arise from an insufficient amount of tracer being injected. On the other hand, a large quantity of tracer could induce water contamination and visual changes to water, leading to population concerns and issues in potable water wells. Although analytical equations have been developed and numerical simulations can be utilized to define the proper amount of tracer to be injected, significant uncertainty remains due to the nature of the test’s objectives. Additionally, time is a concern, as classic tracer tests can last for several weeks to several months, leading to increased costs and delays in obtaining the expected outcomes.
The objective of this research is to apply the TDP approach by varying the external flow conditions around the tested boreholes. The assumption is that by varying the regional stress (e.g., adding a pumping well in the surrounding area), it will affect the TDP results at different stages and highlight the connected water-bearing faults between the pumping well and the tested boreholes.
In 2017, this approach was tested at the Renard Mine site, a diamond mine located in the James Bay area, Canada. The results were coupled with water chemistry analysis to validate fault interconnections. The mine was then fully dewatered ahead of schedule, ensuring safe and efficient mining operations.
Keywords: Ambient flow; Dewatering; Dilution; Field characterization; Fractured; Mine; Tracers
Introduction
Conventional tracer tests, such as convergent, divergent, and natural gradient methods, have long been utilized to characterize groundwater flow and solute transport in subsurface environments (Kaas, 1998). Convergent tracer tests involve injecting a tracer at a known location and monitoring its recovery at a pumping well. Divergent tests, on the other hand, release the tracer at a well and track its migration to surrounding monitoring wells. Natural gradient tests rely on ambient groundwater flow to transport the tracer, offering insights into natural flow patterns (Field, 1995).
While these methods provide valuable data, they are subject to several limitations: 1) Scale Dependence: Conventional tracer tests often fail to capture small-scale heterogeneities due to the averaging effects over large transport distances. This can lead to inaccurate representation of flow pathways, especially in fractured rock systems (Maurice et al., 2011), 2) Tracer Dilution and Loss: High dilution rates and tracer losses, particularly in divergent tests, can result in undetectable concentrations at monitoring wells, leading to false negatives (Verreault 2003), 3) Logistical Challenges: The setup for these tests, including the installation of multiple monitoring wells and extended test durations, is time-consuming and costly (Field, 2002), 4) Complexity in Data Interpretation: The influence of anisotropy, axial dispersion, and multiple flow paths in fractured media complicates the interpretation of breakthrough curves, requiring advanced modeling tools, 5) Tracer Toxicity: The choice of tracer compounds can raise environmental and health concerns, particularly when toxic or persistent substances are used. Field (1995) emphasized the importance of selecting tracers with low toxicity and environmental impact to minimize risks during groundwater testing. Additionally, regulatory restrictions and public perception can limit the use of certain tracers, necessitating careful consideration during the planning phase. Despite these challenges, conventional tracer tests remain valuable for regional-scale hydrogeological studies where large-scale flow patterns dominate over local heterogeneities, but alternate options must be developed.
The point dilution method (PDM) has emerged as a promising alternative for characterizing fractured rock aquifers (Ogilvi, 1958), followed by tracer dilution profile (TDP). Unlike conventional tests, PDM and TDP operate on the principle of monitoring transient changes in tracer concentration within a borehole, thereby targeting specific water-bearing discontinuities (Verreault, 2024). This method is particularly suited for complex geological settings where conventional approaches fall short. Their key advantages includes: 1) Localized Assessment: TDP focuses on identifying well-connected, water-bearing fractures, providing high-resolution data on specific flow paths (Verreault, 2024), 2) Time Efficiency: The method requires shorter test durations compared to conventional tracer tests, reducing operational costs and delays, 3) Reduced Tracer Requirements: By confining tracer injection and monitoring to a single borehole, PDM and TDP minimizes the risk of tracer loss and environmental concerns (Jared, 2007).
Effective planning of tracer tests is crucial to overcoming many of their limitations. Field (2002) outlined strategies for designing tracer tests, including the determination of appropriate tracer quantities, the selection of injection and monitoring points, and the use of predictive modeling to estimate tracer transport behavior. Such planning minimizes the risk of false negatives and ensures that test objectives are met efficiently. However, uncertainties during the planning phase can still affect the outcomes of large-scale tracer tests aimed at understanding flow paths.
To overcome these challenges, a modified TDP approach was implemented to gather critical information about fault interconnections. This variation involves altering regional external stress by conducting TDP measurements in the same boreholes before and after the stress changes. The core assumption is that changes in flow velocity, induced by external stress (e.g., activating a nearby pumping well), will result in variations in the tracer profile behavior within the tested borehole. These variations provide insights into fault interconnections between the tested boreholes and the pumping well, offering a faster and more efficient alternative to traditional tracer tests for assessing fault connectivity.
Site area
The Renard Mine, located in the James Bay region of Canada, represents a significant development in diamond mining within the province of Quebec. Situated approximately 350 kilometers north of Chibougamau and over 1,000 kilometers from Montreal, the mine is positioned in a remote area accessible primarily via the Route 167 extension. The site consists of multiple kimberlite pipes, including Renard 1 through 10, which are composed of volcaniclastic kimberlites characterized by high concentrations of olivine and xenoliths. These formations are typical of volcanic kimberlite deposits, making the site geologically unique. The mine’s operation integrated both open-pit and underground mining methods, allowing for the extraction of an average of 1.6 million carats of diamonds annually.
A portion of the underground operation is located near Lagopède Lake. During the feasibility studies and early operational phases, the SDZ fault (Shallow Dipping Zone) was identified as a major geological feature using traditional methods, such as core logging and televiewer imaging. Initial dewatering efforts included drilling four surface wells targeting the SDZ fault around the kimberlite pipe, with plans to add six additional wells. However, some of these wells proved to be inefficient and, more critically, incurred high costs for completion and commissioning. Figure 1 illustrates the mine location, including Lagopède Lake and the relevant surface boreholes and wells.
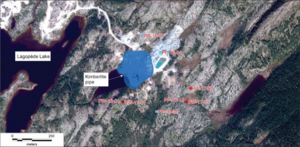
Figure 1: Illustration if the site on a aerial background and representing the kimberlite pipe (blue), the pumping wells (red square), the observation tested boreholes (blue) and the Lagopède Lake.
In response, an underground drain hole program was initiated, targeting the SDZ fault as the primary focus. The objective was to dewater the mine ahead of production at a fraction of the cost, using a single drilling station located beneath the SDZ fault. Successful drilling of these drain holes required a thorough understanding of flow dynamics within the targeted fault to avoid unproductive, dry holes.
The first seven drain holes intersecting the SDZ fault yielded limited water flow, ranging from just 5 to 25 l/min each—far below what was necessary to achieve the mine’s dewatering objectives. These results confirmed that the SDZ fault was not a significant water-bearing structure. Consequently, the identification of an alternative fault with greater water-bearing capacity became critical to meet the dewatering requirements essential for sustaining underground operations.
Methods
In the Renard Mine project, two tracer dilution profile (TDP) campaigns were conducted in existing surface boreholes, as follows:
- August 2017: Five surface boreholes were tested while only pumping well PW-16-01 was active. The boreholes tested included PP-16-04, PP-16-05, PP-16-07, PP-16-08, and PP-16-10.
- October 2017: Four of the five surface boreholes were retested a few days after the activation of three additional pumping wells (PW-17-01, PW-17-02, and PW-17-05) to amplify the regional flow velocity. The retested boreholes included PP-16-04, PP-16-07, PP-16-08, and PP-16-10. Borehole PP-16-05 was excluded from the second campaign due to obstruction.
- The pumping rates for each of the wells was of 2000L/min (PW-16-01), 1200 L/min (PW-17-01), 1000 L/min (PW-17-02) and 200 L/min (PW-17-05).
These two campaigns enabled the measurement of flow zones along the boreholes before and after the commencement of pumping operations in the newly activated wells. The objective was to evaluate the continuity of geological structures and pinpoint the specific locations of flow pathways influenced by the pumping wells.
The TDP approach, as described by Verreault and McCord (2024), involves introducing a tracer into an open borehole and monitoring changes in tracer concentration profiles over time. The fundamental assumption is that reductions in tracer concentration at specific depths indicate ambient groundwater flow at those levels. By activating surrounding wells, the flow regime can be altered, influencing tracer dilution over time and potentially revealing additional or more interconnected geological structures.
In this study, sodium fluorescein is used as the tracer at a low concentration (1 to 2 g per tested borehole). To prevent exceeding quenching levels and detection limits, the tracer is diluted by mixing it in a 50:50 ratio with table salt. The mixture is then introduced into the borehole using a specialized apparatus, which ensures thorough mixing. The apparatus is first lowered to the bottom of the borehole as quickly as possible at a constant velocity to achieve uniform dilution at time zero. Once at the bottom, it is then lifted back to the surface at the same constant velocity to maintain consistency in distribution. After the tracer is fully mixed, concentration measurements are taken in the form of vertical profiles. These profiles are conducted from the bottom to the top of the borehole to ensure consistent speed and improved uniformity. It is important to note that the initial profiles in Figure 2 are not perfectly straight or uniform. This is due to dilution processes beginning to take effect between the moment the tracer is fully mixed and the execution of the first profile.
Results
All TDP results were successful allowing to locate multiple water bearing discontinuities along the boreholes.
Shown in Figures 2 and 3, are the results of all TDP test, before and after regional condition changes.
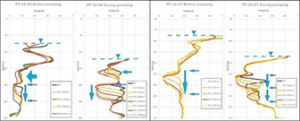
Figure 2: Illustration of the results in boreholes PP-16-04 and PP-16-07, before and after increase in pumping regime.
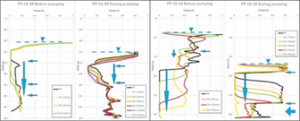
Figure 3: Illustration of the results in boreholes PP-16-08 and PP-16-10, before and after increase in pumping regime. Both X and Y scales are the same for each boreholes tested twice.
The results obtained under higher external pumping regimes are generally easier to interpret, as they reveal more distinct flow zones. However, it is important to consider that tests conducted under these conditions take place with a lowered piezometric surface. This occurs because the wells partially dewater the aquifer, making it impossible to compare the upper portions of the tested boreholes. Specifically:
- Borehole PP-16-04: Located 300 m from the nearest pumping well (PW-17-02), this borehole shows a significant increase in flow response and tracer dilution. A flow zone at 160 m depth is better defined, and the vertical downward flow between 200 and 245 m is much more apparent under the higher pumping regime.
- Borehole PP-16-07: Although farther from the nearest pumping well (450 m), this borehole still exhibits significant changes in its profile behavior. The reduced test duration under higher stress conditions allows for easier isolation of water-bearing zones. Additionally, a new flow zone around 240 m depth was identified, which was previously undetectable under lower regional stress.
- Borehole PP-16-08: Situated equidistantly between two pumping wells (220 m from each), this borehole shows fewer changes compared to others. This may be because well PW-16-01 was already active during the lower regional stress tests. Nonetheless, the faults at 180 m and 220 m are more easily identified under the higher pumping regime.
- Borehole PP-16-10: This borehole demonstrates the most dramatic changes, likely due to its proximity to well PW-17-05. Under lower regional stress, tracer flow was pushed downward, but neither the upper nor lower flow zones could be identified. In the second test under increased stress, flow zones at 220 m and 295 m, along with the downward flow between them, became distinctly evident.
In all tested boreholes, downward flow is more readily detected due to regional dewatering, which forces water toward the base of pumping wells and lower mine excavations. Notably, the fault at 160 m in borehole PP-16-04 exhibits horizontal flow under increased stress, potentially indicating a separate third fault connected to one of the wells. Since three wells were pumped simultaneously, it is not possible to determine which one induced the higher flow. The observed downward vertical flow suggests the presence of two subparallel faults at the site. The increased pumping rate highlights their existence more clearly.
(Figure 4) illustrates the flow zones isolated in the TDP conducted after the increase in regional pumping regime, alongside the SDZ fault as previously interpreted using traditional approaches. The figure confirms that no flow is related to the SDZ fault, as earlier suspected.
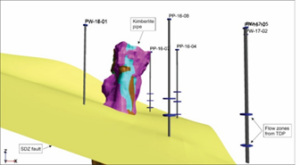
Figure 4: Illustration of the kimberlite pipe, the SDZ fault and the flow zones isolated with the TDP with higher pumping regime. No flow zones seems clearly related to the SDZ fault, confirming its low yield.
Validation and new interpretation
Since the drain holes were designed to be drilled from existing mine workings located below the SDZ fault, the initial seven drain holes were drilled upward, with flow rates averaging between 5 and 25 L/min. Subsequently, another sequence of drain holes was drilled higher to intercept the potential subparallel fault identified using the TDP method. Figure 5 illustrates the drain holes, their water interceptions, and the previously identified TDP flow zones.
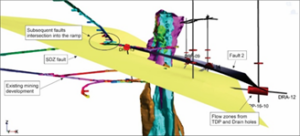
Figure 5: Illustration of the kimberlite pipe, the SDZ fault, the new Fault 2 and the flow zones isolated with the TDP and drain holes. Also identified, two water interception into the ramp
Both the TDP results, and the drain holes confirm the presence of a second subparallel fault to the SDZ fault, demonstrating that the SDZ fault was an unsuitable target. This is true despite structural data, such as acoustic televiewer imaging, showing obvious faults with significant openings. Each individual drain hole intersected flow rates between 1200 and 1500 L/min in HQ-sized holes (100 mm diameter). All drain holes were connected to a pumping station located in an underground bay, with gravity-driven water flow pumped to the surface for discharge. The dewatering process took about five days to complete once the system became operational, achieving results at approximately 15% of the original budget for surface dewatering wells. The TDP also suggests the presence of additional subparallel faults located above Fault 2. However, insufficient data is available to confirm their positions or water flow behaviour.
As a final validation step to confirm that the SDZ fault and Fault 2 are two distinct discontinuities, multiple water samples were collected from the drain holes and the ramp, where two water intersections had been observed during the initial mining development (see Figure 5). Initially, the mining team believed these two water intersections in the ramp originated from the same large, thick fault. However, the water chemistry analysis provided further evidence to differentiate between the two faults. Table 1 illustrates the chemical composition of water samples collected from several locations.
| ID | TOC
(mg/L) |
Chlorides
mg/L |
Elec. Cond.
µmhos/cm |
TDS
mg/L |
Hardness
mg/L |
| DRA-01 | <0.2 | 188 | 921 | 690 | 229 |
| DRA-02 | <0.2 | 196 | 914 | 668 | 253 |
| DRA-03 | <0.2 | 220 | 1010 | 794 | 289 |
| DRA-04 | <0.2 | 153 | 751 | 536 | 176 |
| DRA-05 | 0.87 | 329 | 1224 | 708 | 227 |
| DRA-09 | 1.05 | 12.2 | 195 | 110 | 70.63 |
| DRA-10 | 1.83 | 52.2 | 358 | 208 | 121 |
| DRA-12 | 4.32 | 14.5 | 434 | 216 | 202 |
| DRA-14 | 1.25 | 48.2 | 370 | 244 | 124 |
| Ramp upper fault | – | – | – | – | 103 |
| Ramp lower fault | – | – | – | – | 320 |
| DRA-15 | 2.50 | 67.9 | 424 | 290 | 133 |
| DRA-13 | 0.97 | 41.4 | 346 | 208 | 104 |
Table 1 Results of water chemistry for some parameters taken into the SDZ fault and the Fault 2 (Bold).
(Table 1) highlights the significant differences in water chemistry between the two faults, confirming that they are distinct discontinuities. Notably, Total Organic Carbon (TOC) is detected only in Fault 2, suggesting a potential connection to Lagopède Lake. Additionally, the lower concentrations of other measured chemical constituents indicate fresher and younger water in Fault 2 compared to the SDZ fault.
The overall key findings indicate that the TDP is already an effective tool for isolating water-bearing discontinuities with sustainable flow. However, applying external stress to the regional aquifer further highlights water-bearing locations and even reveals new flow zones along boreholes. In this specific case study, linking the fault system as a whole is not straightforward, partly due to multiple wells pumping water on the property. Nevertheless, the test results suggest that under various external stress conditions, the TDP could effectively connect water-bearing discontinuities when multiple boreholes are tested under different external flow regimes. Furthermore, TDP could support multiple applications, including structural geology analysis, which may enhance the overall understanding of a site’s geological framework.
Conclusions and Next Steps
This study demonstrates the efficiency of the Tracer Dilution Profile (TDP) method in identifying water-bearing faults and optimizing mine dewatering strategies in fractured rock formations. Unlike traditional tracer tests—such as convergent, divergent, and natural gradient methods-TDP offers several key advantages. By focusing on localized flow dynamics and integrating regional stress variations, TDP provides high-resolution insights into fault interconnections while minimizing environmental risks and operational costs.
Compared to conventional tracer methods, TDP is faster and more efficient. Traditional tests often require extended durations, large tracer volumes, and complex monitoring setups, which can lead to false negatives due to excessive dilution or undetectable concentrations. In contrast, TDP uses smaller tracer quantities confined to single boreholes, reducing logistical challenges and environmental concerns. Additionally, integrating regional pumping variations enhances results by revealing new faults and improving structural interpretations.
In traditional pump tests, drawdown is measured in multiple piezometers to assess the area of influence of pumping. However, incorporating TDP under external stress conditions adds a third dimension to the analysis by highlighting fault interconnections within the aquifer. This approach not only visualizes the drawdown cone but also validates which faults are impacted by pumping.
Since hydraulic conductivity is assumed to remain constant in geological media, only flow conditions can be measured. Traditional methods assess the formation’s hydraulic conductivity but not the actual flow. TDP overcomes this limitation by measuring flow velocity through tracer dilution, allowing for real-time monitoring of changes in the flow regime.
Future research should refine TDP methodologies for low-permeability formations and explore its integration with other hydrogeological tools. By combining TDP’s localized precision with the broader-scale insights of traditional tests, researchers and practitioners can further enhance resource management strategies in mining and beyond.
Acknowledgement: The authors want to thank M. Thierno Bah for the field tests performed on this site of Canada.
References
- Collins S, Bianchi M (2020) DISOLV: A Python Package for the Interpretation of Borehole Dilution Tests. Groundwater 58: 805-812.
- Field MS, Wilhelm R.G., Quinlan J.F., Aley T.J. (1995) An Assessment of the Potential Adverse Properties of Fluorescent Tracer Dyes used for Groundwater Tracing. Environmental Monitoring and Assessment 38: 75-96.
- Field MS (2002); A review of Some Tracer Design Equations for Tracer-Mass Estimation and Sample-Collection Frequency. Environmental Geology.
- Jared W, Noelle EO (2007); Characterization of a Multilayer Aquifer Using Open Well Dilution Tests. Groundwater, Vol 45 pp 74-84.
- Kass W (1998) Tracing Technique in Geohydrology. A.A. Balkema, Rotterdam, 581p.
- Maurice L, Barker J.A., Atkinson T.C., Williams A.T., Smart P.L. (2011) A tracer Methodology for Identifying Ambient Flows in Boreholes. Groundwater 49: 227-238.
- Ogilvi NA (1958) Electrolytic Method for the Determination of the Groundwater Filtration Velocity (in Russian). Bulletin of Science and Technology News 4.
- Verreault M (2003); Etude Méthodologique pour l’Estimation de l’Aire d’Alimentation de Captage d’Eau Souterraine en Milieu Complexe. Mémoire de Maitrise de l’Université du Québec à Chicoutimi.
- Verreault M, McCord JT (2024); Tracer Dilution Profiles for Mine Dewatering : Approach and Case Study, Enviro Sci Poll Res and Mang: ESPRM-147.
