Publication Information
ISSN 2691-8803
Frequency: Continuous
Format: PDF and HTML
Versions: Online (Open Access)
Year first Published: 2019
Language: English
| Journal Menu |
| Editorial Board |
| Reviewer Board |
| Articles |
| Open Access |
| Special Issue Proposals |
| Guidelines for Authors |
| Guidelines for Editors |
| Guidelines for Reviewers |
| Membership |
| Fee and Guidelines |
 |
The Study of Key Attributes in Public Transit User Satisfaction, Including Social Inclusion and Gender Equality: The Case of Jakarta
Alfa Adib Ash Shiddiqi1*, Dwita Sutjiningsih2, Tri Tjahjono2, Linda Darmajanti3, Ali Aryo Bawono4
1School of Environment, University of Indonesia, Jakarta, Indonesia
2Department of Civil Engineering, University of Indonesia, Jakarta, Indonesia
3Department of Sociology, University of Indonesia, Jakarta, Indonesia
4Faculty of Rail, Transport and Logistics, Technical University of Munich Asia, Singapore
Citation: Shiddiqi A A A, Sutjiningsih D, Tjahjono T, Darmajanti L, Bawono A A (2023) The Study of Key Attributes in Public Transit User Satisfaction, Including Social Inclusion and Gender Equality: The Case of Jakarta. Enviro Sci Poll Res and Mang: ESPRM-130.
Received Date: August 14, 2023; Accepted Date: September 16, 2023; Published Date: September 23, 2023;
*Corresponding author: Alfa Adib Ash Shiddiqi. School of Environment, University of Indonesia, Jakarta, Indonesia. Email: adibalfa@gmail.com
Citation: Shiddiqi A A A, Sutjiningsih D, Tjahjono T, Darmajanti L, Bawono A A (2023) The Study of Key Attributes in Public Transit User Satisfaction, Including Social Inclusion and Gender Equality: The Case of Jakarta. Enviro Sci Poll Res and Mang: ESPRM-130.
DOI: 10.37722/ESPRAM.2023104
Abstract
Three types of mass transit services have been developed and run in Jakarta metropolitan area. The Bus Rapid Transit, called Trans Jakarta, has been running since 2019, the Commuter Line train, called KRL, has been serving throughout 2020, and lastly, the Mass Rapid Transit, called MRT Jakarta, has been running since 2019. Yet, it was found that the majority 80% of commuters are still using private vehicles. This paper aims to explore the reasons why most commuters are still preferring to opt using private vehicles over public transport. A total of 23 attributes concerning the quality of public transport services have been investigated by conducting surveys and collecting data. As result, even majority of users mentioned that they are satisfied with the overall quality of the mass of transit, they are still hoping for improvement in some service attributes including vehicle capacity, green vehicle, and cost of transport feeder. This paper also concludes that female passengers and teenagers consider security officer presence as one of the attributes needed to be improved. To enhance social inclusion and promote gender equality, practical strategies are recommended such as discounts and improvement of feeder service, special wagon for female and youth passengers, and adjusted schedules to conform with school time. The improvements are critical as these factors may change the decision of commuters from opting using public transport rather than private vehicles.
Keywords: Customer Satisfaction; First Miles Last Miles; Gender Equality; Public Transport; Social Inclusion
Introduction
Jakarta, the capital city of Indonesia, is a metropolitan city in a developing country that faces typical urban problems such as traffic congestion and commuting time. According to Castrol’s Magnatec Stop-Start index, Jakarta is the city with the most traffic jam with approximately 33,240 stop-starts per year. It typically takes two hours to drive 25 kilometers to the city center from the outskirt area. The Guardian claimed that the average person in Jakarta spends 10 years of their life in traffic[1]. According to the Statistics Bureau, about 31 million people are living and working in Jakarta, where the total area of the city is only about 6,342 km2. Consequently, the situation increases the pollution level to 154 AQI (air quality index by https://www.iqair.com/indonesia/jakarta). However, in the past ten years, the local government of Jakarta has done much to solve those issues. Public transport holds a key role [2][3][4] since public transport is important to reduce the use of private vehicles and preserve the capacity of the transport system [5]. Studying the strategy and understanding factors to improve public transport usage is very vital for policymakers and transport providers [6].
According to the Statistic Bureau, around 5.362 million males and 5.282 million females lives in DKI Jakarta Province in the year 2021. In terms of age, 3.247 million residents are under 20 years old (around 30.5%), and 7.396 million residents are older than 21 years old in the year 2021. The average monthly wage/net salary for formal workers in DKI Jakarta is IDR 4,216,379. It is also reported that the number of low-income residents is around 501.92 thousand residents (4.72%).
The development of public transport in Jakarta has drastically improved during the last few years. It is indicated by the provision of mass transit such as commuting trains (called KRL), bus rapid transit (BRT), mass rapid transit (MRT) and light rail transport (LRT). However, this massive infrastructure provision, reported by JUTPI [7], [8] indicates that the proportion of the public transport user is drastically declining compared to private vehicles. In 2002, public transport was used by over 50% of commuters, then it decreased by less than half in 2010. In 2018, commuter transport mode was highly dominated by more than 80% of private vehicles. In addition, Central Statistical Bureau reports that 72% of commuters were using cars and motorcycles [9], and more surprisingly, 59% are using motorcycles [10].
The Statistic Bureau reported that around 33% of Jabodetabek’s commuters are female. The governance introduces the following strategies to address female commuters. DKI Jakarta Government has established a Public Transportation Friends of Women and Children Service Post (SAPA). The SAPA is a Call-Centre facility to accommodate female and youth commuters’ satisfaction when using public transport. Since it is a kind of “Call-Centre” facilities, the effectiveness of the measure is need to be studied thoroughly. Another strategy implemented was the introduction of a special wagon for the female commuter. The large number of sexual harassment cases experienced by female commuter in public transport has become the basis for this affirmative action. However, it is also reported that this “female special wagon” is less comfortable. This wagon is seen as a battlefield for female commuters where the one who is better at seeing opportunities wins the space which results in comfort.
The proportion of public transport users in the youth age is around 19.2% indicated by the number of young student users of public transport. One of the strategies being introduced to address youth public transport users is the school bus. Though government claim that school bus in Jakarta is effective, further study is needed to assess the impact on traffic comprehensively.
The above phenomenon raises a question about the quality of public transport, especially those in mass transit. User characteristics, travel behaviors, and mode qualities are affecting public transport selection [11, p. 218]. Studies have reported that commuters do not choose public transport because of the low quality of the service [12][13]. Hence, the public transport provider or authorities should provide the service demanded by the transport user. Therefore, understanding the user perspective regarding satisfaction with the public transport attribute is important.
In evaluating satisfaction, scholars use various methodologies. They are Customer Satisfaction Index [2], [14], [15], [16], Structural Equation Modelling (SEM) [17]–[19], Factor Analysis [5] [20] [21]–[24], Analytic Hierarchical Process (AHP) [25], descriptive quantitative such as regression [26], [27], more complicated thermodynamic model [28], Stated Preference survey [29], [30] and very simple spiderweb diagram [4], [31]. This paper are using importance and satisfaction analysis to measure the performance of public transport quality as explained by Eboli [14].
Customer satisfaction represents a measure of company performance according to customer needs [32]; therefore, the measure of customer satisfaction provides a service quality measure. Customers express their opinion about the services by providing judgments on some service aspects using sample surveys, known in the literature as “customer satisfaction surveys.” Parasuraman introduces ServQual which are assessing customer satisfaction by five dimensions: tangibility, reliability, responsiveness, assurance, and empathy [33]. It is then being d into transport service aspects such as accessibility, reliability, crew treatment, information, design, customer service, and safety and security [21] similar to aspects composed by del Castillo [34] which are connectivity, accessibility, information, time satisfaction, attendance, comfort, security/safety, and environmental impact. Further discussion about service attributes is discussed in the next section.
The satisfaction level of public transport in Jakarta has been discussed by several authors. Sumaedi, in 2012, studied paratransit [35], and then he studied the satisfaction level public of the bus in 2016 [24] by connecting perceived value, image, perceived ease of use, and perceived passengers’ satisfaction using factor analysis. Tecoalu was concerned to evaluate online transport [36]. While Supriyadi was concerned about the JAKLINGO microbus [37]. Nurmahmudi studied the satisfaction level of the airport bus [38]. In addition, Zulham also studied paratransit in Jakarta [31].
Related to satisfaction, other cities such as Bandung were also being studied by Joewono [21], [39] which were concerned with paratransit, and Adriana [40] investigated bus transit in Denpasar, Bandung, Bogor, and Surakarta. Studies of mass transit satisfaction were also being conducted in foreign cities such as Kaohsiung MRT by Lai [5], Tehran Metro by Aghajanzadeh [22], Shanghai Metro by Li [28], Beijing rail transit by Sun [41], Bangkok mass transit (BTS) by Dechen [27], and Kuala Lumpur Monorail and Klang Valley’s LRT by Ibrahim [42], [43].
On the other hand, studies on the satisfaction level for mass transit in Jakarta, have not been found too many. Recognized studies such as Sukwadi evaluated the MRT Jakarta but only for the transit system and did not evaluate the first mile/last mile (FMLM) quality [18]. While Pelangi [44], Rifai [45], and Nagari [46] are evaluating the satisfaction of the terminus in Duri Kepa and Dukuh Atas, and Kali Besar corridor. Meanwhile, Israeli [47] evaluated the satisfaction for the feeder of the LRT which is similar to paratransit, and Prabantari [48] tested the satisfaction level of Trans Jakarta passengers with only a few attributes (five) and only forty respondents.
Therefore, to fill the gap this paper will report the satisfaction level of several mass transit service attributes, including first/last mile satisfaction. As explained by Trip Chain Theory, the characteristic of the first/last mile is also an important factor for mass transit [49]. The first mile is defined as a traveling mode from/to the terminal/station from home/workplace [50][51][52].
This paper aims to explore the satisfaction level of mass transit users. It also aims to explore attributes of public transport services that need to be improved. By reading this paper, the reader might get an understanding of the important attributes as well as satisfaction attributes that are categorized by different classes of mass transit users. It also discusses the satisfaction results from different segments. This paper discusses satisfaction levels and studies the comparison between expense class, level of education, and travel distance.
Methodology
Research Flow
The process of this study is explained by the following flow chart. The first step is to define the problem. Then, literature studies were conducted to understand relevant and current studies. The service attributes are selected based on their importance of the service attributes. The next step is to develop the questionnaire followed by data collection. A pilot test was done to check whether the questions and related answers are relevant to structure the solution for the problem. Adjustments for the questionnaire were done based on results conducted in the pilot test.
The survey is done by using the updated questionnaire. Then, the data is processed with the statistical instruments and calculated with the Customer Satisfaction Index formula. The segmentation is categorized based on (I) transport expense, (ii) education level, and (iii) travel distance. The finding is analyzed by comparing the highest score and lowest scores for each segmented data. The final step is the discussion and construction of the conclusion based on the results and analyses.
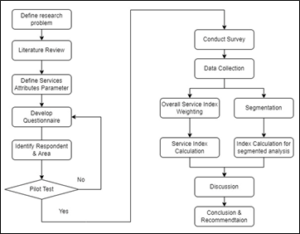
Figure 1: Process of study.
Selection of Services Attributes
In the context of public transport service, satisfaction is come from passenger experience of the service compared to their pre-defined expectations [53]. In measuring satisfaction, this study selects the main aspect to be evaluated are fare, time, comfort, reliability, safety and security, and environment. These 23 attributes are in line with 26 attributes proposed by Eboli [14], and also agree with EN13816 European Standard for public transport service quality consisting of eight aspects as follows: Availability, Accessibility, Information, Time, Customer Care, Comfort, Security, and Environmental Impact [54].
This study is covering not only evaluating mass transit service, but also its first/last mile satisfaction. Thus, attributes cost of the feeder and travel time for the feeder are also being investigated. Those attributes are rarely discussed for bus and paratransit service, but it was discussed in a study related to MRT and other mass transit such as Kaohsiung MRT [5]. This study also expands to the comfort aspect by adding disability facilities service attributes and parking facilities. Support for disabilities is important and promoted by Imam [55] indicated by her question: “Availability of Wheelchair Space, and Ease of Entering/Exiting the vehicle”. Parking facilities are also important for the future expansion of park and ride strategy. It also answers the problem of the lack of a feeder and the high proportion of private vehicle users [56].
Fare aspects are evaluated by the cost of mass transit, cost of first/last mile, payment integration and non-cash payment system. Most studies proposed that the cost factor is highly related to user satisfaction, especially for a paid service. In addition to the fare parameter, time is also considered a crucial factor since it directly affects passenger activities (working/studying). Comfort, reliability of service and safety and security is also necessary for transportation service.
Data collection
The survey is conducted with an online method targeting commuters in the Jabodetabek area. The questionnaire consists of two parts. The first part is investigating the demographic parameters, including age, gender, income level, daily transport expense, education, type of mass transit, and frequency of mass transit use. This demographic information is important for analyzing based on passenger segmentation. The second part consists of 46 questions considering 23 attributes, with each attribute investigated for its importance and user satisfaction. Both importance and satisfaction are evaluated by the Likert scale.
Five levels of response were developed on the Likert scale from 1 to 5, 3 being ‘moderately important or satisfied’, 5 ‘very important attribute or very satisfied with this attribute’ and 1 ‘very unimportant attribute or very dissatisfied with this attribute’. The Likert scale is used due to its practicability compared to the 1 to 10 scale of other customer satisfaction index methods. A total of 203 valid respondents are collected in about 3 weeks. To be eligible as a sample, a respondent must use the MRT or BRT TransJakarta or KRL Commuterline for daily commuting.
Customer Services Index Calculation
This research is adopting the Customer Services Index (CSI) method. The concept of customer satisfaction as a measure of perceived service quality was introduced in market study research. In this field, many customer satisfaction techniques have been developed. The main indicators investigated are the level of customer satisfaction and the level of importance of the variables. Indicators are calculated based on user ratings expressed by a numerical scale; this kind of scale has several advantages over scales with points described through words (e.g., Likert and verbal scales) in that they allow quantitative analytical techniques to be applied. In this study, a Likert scale of 1 to 5 was used which later is converted into a numerical scale.
This study uses CSI, which is calculated through the level of satisfaction expressed by users, weighed by importance, according to the following formula:
![]() is the average level of satisfaction expressed by users on k attributes of service quality.
is the average level of satisfaction expressed by users on k attributes of service quality.
![]() is (weight of importance) is the weight of attribute k, calculated based on the level of importance declared by the user. Specifically, this is the ratio between the average level of importance expressed by users on attribute k and the sum of the average importance levels of all service quality attributes:
is (weight of importance) is the weight of attribute k, calculated based on the level of importance declared by the user. Specifically, this is the ratio between the average level of importance expressed by users on attribute k and the sum of the average importance levels of all service quality attributes:
![]()
The CSI represents a good measure of overall satisfaction because it summarizes the ratings expressed by users about various service attributes in a single score. The more accurate the attribute selection, the more accurate the overall satisfaction measure. For this reason, the attributes selected must fully describe the service aspect.
Data collection and analysis
Scope of the study area
This study includes three types of mass transit service runs in Jakarta Metropolitan, which are Bus Rapid Transit called Trans Jakarta, Commuter Train called KRL Commuter line, and Mass Rapid Transit (similar to Metro) called MRT Jakarta.
TransJakarta started operating in 2004. By the end of 2019, 13 corridors were operating together with other services outside the main corridor. TransJakarta is operated with a total of more than 1,300 buses (source: TransJakarta.co.id). The number of passengers also increased in line with system improvements, such as the ticketing system, integration with other public transportation, corridors, and route expansion.
The MRT (Mass Rapid Transit) has been planned since 1980 and has been included in the Jabodetabek transportation master plan since then. However, the construction of the MRT was only realized in 2013 and started operating in 2019. MRT Phase 1 which connects Lebak Bulus and Bundaran HI has been fully operational since March 2019. Phase 1 consists of a 15.7 km long line (10 km flyover and 5, 7 km underground line) with 13 MRT stations (7 elevated stations and 6 underground stations) (source: jakartamrt.co.id).
In addition to the MRT, the rail-based transportation mode that has been used by Jabodetabek commuters is the Jabodetabek KRL. Since 1927, at that time the City of Batavia had built KRL surrounding the city (ceintuur-baan), and in 1930-1939, the Batavia (City of Jakarta) to Buitenzorg (City of Bogor) KRL line operated, and there were 72 KRL trips recorded. crossing the Batavia and Manggarai-Bogor ring routes. Currently, the Jabodetabek Commuter KRL is managed by PT Kereta Commuter Indonesia (a subsidiary of PT Kereta Api Indonesia (Persero)). Throughout 2020, 154,592,886 users were served by 1,196 KRL units operating with 80 stations in the Greater Jakarta area with a route of 418.5 km (source: krl.co.id).
Respondent characteristics
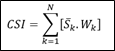
The sociodemographic of respondents is presented in Figure 2. Based on gender and age, 61% are female and 78% of respondents are of productive age. The majority of the respondents are high school graduates (58%) and bachelor’s degree holders (40%). Based on occupation, most of the respondents are students (81%), followed by private sector employees (14%), and the rest are entrepreneurs and civil servants. Based on income level, most of the respondents are low-income level which is below IDR 3 million (70%) and IDR 3 to 5 million by 11%. Based on the type of mass transit used, 16% are BRT TransJakarta users, 65% are KRL Commuterliner users and 19% are MRT users.
The socio-demographic characteristics of the respondents in this study are quite close to the census report published by Central Statistical Bureau (2019) [9]. According to the report, 40% of commuters have a monthly income of more than IDR 5 million, and about 48% of commuters have a monthly income between IDR 3 to 5 million. Furthermore, the report shows that the gender proportion is primarily male (70%) and female (30%) in their productive age (71%). Moreover, half of the commuters are graduates of high school.
Based on the socio-demographic distribution, the segmented analysis is conducted by comparing education level, transport expense level, gender, age, and income level.
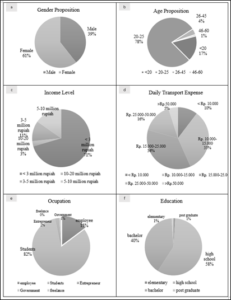
Figure 2: Respondent’s Socio-demographic based on (a) gender, (b) age, (c) income (d) daily transport expense, (e ) occupation, and (f) education.
Result and discussion
Overall Customer Satisfaction Index
A total of 23 attributes are investigated for their importance and satisfaction to evaluate the service level satisfaction. Results show that the final score of the index is 3.528. It means that the overall satisfaction level of the service is moderately satisfied since it is over a score of 3.0 but less than a score of 4.0.
Most of the attribute’s importance levels are highly important since their score is above 4.0. However, respondents feel that parking facilities and feeder availability are moderately important since their scores are below 4.0. It could be understood since the idea of park and ride in Indonesia is not common yet and face several concerns such as capacity and security of parking place, tariff clarity, and guarantee of interconnection [59]. A study in St Lucia also reported that reliable/convenient parking facilities are only addressed by a small proportion of commuters (3,93%) [56].
On the other side, unsurprisingly, respondents value punctuality as the most important attribute. Compared to other types of public transport such as paratransit, bus, and taxi, mass transit punctuality is better. A satisfaction study on Ostrava’s public transport also reported that punctuality is highly considered very important besides waiting time [58].
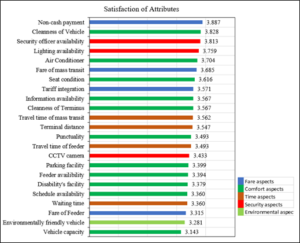
Figure 3: Result of Overall Satisfaction Index.
All satisfaction scores are between 3.14 to 3.53 therefore all attributes are considered moderately satisfying. The three highest satisfaction scores are (1) non-cash payment, (2) cleanliness of the vehicle, and (3) security officer present. This finding indicates that people are happy with the innovation of the payment system, vehicle hygiene and security of mass transit. It can be understood by the fact that non-mass transit public transport (paratransit, regular bus, taxi) is not very advanced in terms of e-payment service compared to more technological-advanced mass transit.
The three lowest satisfaction scores are (1) vehicle capacity, (2) green vehicle, and (3) cost of the feeder. Respondent experienced very crowded or under-capacity carriages/wagons very often. Respondents also feel that the vehicle used is not very environmentally friendly. This is not specific only to Jakarta public transport’s problem, this lack of environmental concern is also faced by European buses as well [60]. Respondents are also not very satisfied with their expense for first/last mile transport. It indicates that the feeder system for mass transit or mass transit coverage still needs to be improved. Respondent still spent a high proportion of transport expenses on taxi and online transport because the low fare, on-time, comfort feeder bus is not available yet. It is confirmed by Izadi’s report that the condition of feeder transportation in the Jakarta Metropolitan area is below the minimum service standards [47].
Customer Satisfaction Index based on Education Level
The comparison study is also conducted based on education level, between low level and high level. The low level is defined as elementary, and high school, while the high level is graduate and postgraduate. The result shows that the higher educated index is higher (3.546) compared to the 3.466 score by the lower one. The service of mass transit is more satisfying for the higher educated user.
In terms of attributes importance, the top three attributes for the lower one is punctuality, cleanness of vehicle, and cleanness of terminus, while for higher educated user top 3 attributes are security officer, non-cash payment, and lighting availability. The lower educated group feels that the cleanness of vehicles and terminus are an important feature that public transport must have, while the higher educated group feels that security is the most important aspect for them. The bottom three attributes for the lower group are the fare of mass transit, feeder availability, and parking facility, while the bottom three for the higher educated group are environment, vehicle capacity, and schedule availability. It is surprising since higher educated people feel that environmentally friendly vehicle is in the bottom three attributes. Related to the importance of attributes, it has also been found a significant deviation of 4.43 compared to 3.28, which is the attribute of schedule availability.
In terms of satisfaction, the top three attributes for lower educated are non-cash payment, vehicle cleanness and lighting availability, while for higher educated users top three satisfying attributes are vehicle cleanness, non-cash payment, and security officer. The result is similar, both groups are happy with vehicle cleanness and the innovation of payment. The bottom three attributes by satisfying level for the lower group are vehicle capacity, feeder fare, and environment, while for higher education, the bottom three are feeder fare, waiting time, and schedule availability. Both groups put feeder fare on the bottom three, which means that both groups expect improvement for feeder cost attributes. An interesting finding is the schedule availability which has a massive different score between the two groups. The satisfaction level for the low-educated group is higher (top five), but it was a very low score for the educated group (23rd rank).
The comparison study indicates interesting findings. First, the low-educated group feels that cleanness of the vehicle and terminus are the most important attributes, while the higher-educated group feels safety and security are the most important. Second, the higher educated group rated environmentally -friendly vehicle in the bottom three of importance aspect. Third, both groups are happy with vehicle cleanness and non-cash payment and not satisfied by the feeder cost. Fourth, a significant difference in satisfaction found between the two groups is for schedule availability attributes. It needs further research to understand the phenomenon since the different levels of education is correlated with the type of work (blue collar vs white collar) that required a particular mass transit schedule.
Customer Satisfaction Index based on Gender
To understand more about gender equality, this study compares the result between male and female respondents. The result shows that the top three satisfaction by female respondents are non-cash payment, air conditioner facilities, and cleanliness of the vehicle. While, male respondents are non-cash payment, cleanliness of the vehicle, and presence of security officer. The difference is female passengers are more satisfied with the current air conditioner facilities and male passengers more satisfied with the security officer’s presence. The service level provided by the presence of the security officer should be upgraded more so female passengers may appreciate higher satisfaction in the security officer attribute.
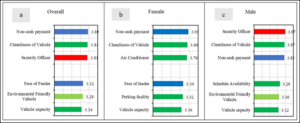
Figure 4: Comparison between (a) Overall CSI and (b) CSI based on Female (c) CSI based on Male gender.
The bottom three attributes by female users are the fare of feeder, parking facility, and vehicle capacity, while male users are more unsatisfied with schedule availability, vehicle capacity and environmentally friendly vehicle. Female users are less satisfied with feeders’ fare. It could be understood since female users experience more struggle with the current feeder facilities.
It can be seen from the above results that the security officer presence is less satisfied for females compared to male respondents. Female respondents were also less satisfied with the feeder service and parking facility. Female users also reported dissatisfaction with the parking facility. From this finding, we can see that feeder service and parking facilities are two attributes that are more concern attributes by females than males. Therefore, service providers and administrators should emphasize those attributes to support gender equality. Some examples of practical strategies are providing special wagon and terminus sections for female users, providing parking facilities for female users, and a special discount on feeder service for female users.
Customer Satisfaction Index based on Age (Youth and Adults)
The comparison study is also conducted based on age. It compares youth (age less than 20) with an adult (age more than 21). The result shows that the top three satisfaction by youth respondents are non-cash payment, air conditioner facilities, and information availability, while adult respondents are similar, except adult respondents are more satisfied with the presence of security officers and vehicle cleanliness. The bottom three attributes by teenagers are the fare of the feeder, schedule availability, and vehicle capacity, similarly adults are also more unsatisfied with the fare of the feeder, vehicle capacity and environmentally friendly vehicle.
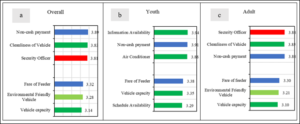
Figure 5: Comparison between (a) overall CSI and (b) CSI based on youth (c) CSI based on adults.
From this result, it was highlighted specific attributes such as the presence of security officers are one important concern of the youth. Similar to female users, the service level of security officer should be upgraded more so youth may appreciate higher satisfaction in the security officers attribute. Another finding is youth users are less satisfied to schedule availability. It can be understood since youth users commonly do school activities with a more rigid schedule than adult.
Therefore, it can be concluded that security officer presence and a more flexible mass transit schedule should be improved to satisfy the need of youth passengers. Some practical strategies to tackle this issue are providing specials wagon for the youth, and schedule adjustments adapting to school time.
Customer Satisfaction Index based on Income (Low-Income and Non-Low Income)
The comparison study is also conducted based on income level. It compares low-income passengers (below IDR 4 million) and passengers with higher incomes. The average regional minimum wage in metropolitan Jakarta is 4,2 million IDR. The result shows that the top three satisfaction of low-income passenger is non-cash payment, vehicle cleanliness, and the presence of security officers. Meanwhile, the higher-income passenger is similar, except higher-income respondents are more satisfied with the travel time. The bottom three attributes of a low-income passenger are the fare of the feeder, vehicle capacity, and environmentally friendly vehicle, while the bottom three attributes of higher income passenger are schedule availability, CCTV presence, and environmentally friendly vehicle.
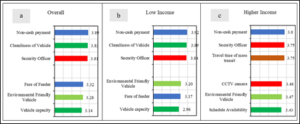
Figure 6: Comparison between (a) overall CSI and (b) CSI based on low income (c) CSI based on higher income.
From this result, it is shown that lower-income passenger is more concerned and less satisfied with the fare of feeder and vehicle capacity compared to the higher-income passenger that concerned about CCTV camera. It could be understood that low-income commuters feel that the cost of feeder and first/last miles is somewhat expensive and could be higher than the fare of mass transits. Therefore, it can be concluded that the feeder’s fare is a critical attribute for lower-income respondents.
Conclusion and Recommendation
For most attributes, a total of 21 out of 23, the importance value is over 4.0 which means most of the attributes are considered important. Only two attributes (Parking Facilities and Feeder Availability) are below 4.0 which means quite important. The result indicates that the most important attributes are punctuality, cleanness of the vehicle, and cleanness of the terminus. While parking facilities are considered the least important attribute.
This study reports that the overall satisfaction level for mass transit service in Jakarta is good. It is indicated by the score of the index of 3.5, which are between 3.0 to 4.0. Though the score is still below 4.0, notable variables with high satisfaction levels are non-cash payment, security officer appearance, and cleanliness of mass transit. The top three attributes satisfied by respondents are easiness of non-cash payment, cleanliness of the vehicle, and the presence of the security officer. Easiness of payment is indicated by using electronic type of payment, either by a tapping card or barcode scanning of an e-wallet. The cleanliness of the vehicle is experienced by no garbage and clean air on the vehicle. The presence of a security officer gives the respondent the feeling of safety and ensures the passenger is in an orderly manner. Attributes that need to be improved are vehicle capacity, green vehicle, and cost of the feeder. Comparison by the segmented demographic group could add more information about specific attributes for each segmented group.
However, when CSI is observed based on gender, the priority will be slightly changed. To adapt to female passengers’ needs, the following attributes should be improved: security officer presence, feeder service and parking facilities. Some practical strategies are a providing special wagon and special terminal section for female users with more security officer presence, discount for feeder’s fare for female users, and parking facility provision for female users.
One of the strategies above (i.e., special wagon for female users) has been implemented by the mass transit provider. It means that the provider already addressing the female user’s concern. However, the special wagon strategy is also being criticized as non-inclusive and raising social problems among female users. Since around half of mass transit users are female, this type of strategy is critical in maintaining the number of female users.
The CSI based on age also results differently compared to the overall CSI. The CSI based on youth is also concerned with security. In addition, the finding shows that youth is less satisfied to schedule availability. Therefore, schedule adjustment adapting to school time is a good strategy to make youth passengers more satisfied.
Currently, there are not many strategies addressing youth mass transit users. Government strategy about giving free or subsidies to students is not financially sustainable. Related to the security concern, the establishment of SAPA has good intention but the effectiveness need further research.
Lower-income passenger is more concerned and less satisfied with the fare of feeder and vehicle capacity. Therefore, to support this segment of passenger, discount for feeder’s fare as well as mass transit fare is encouraged by this study.
In practice, mass transit providers could provide better service by expanding vehicle or wagon capacities, especially during rush hour. In addition, improvement of the environmental aspect by the adoption of a more environmentally friendly vehicle also should be promoted. Then, the issue of difficulties in the first/last mile also must be addressed either by the provision of better bus feeders or the expansion of mass transit coverage. Policymakers and transport providers may consider improving the service attributes based on the level of satisfaction addressed by the users. In the case of limitation of cost and time budgeted, policy-makers may prioritize the plan and development based on the importance of attributes that have been studied carefully in this research.
Future studies could consider a more in-depth interview to investigate the reason behind the satisfaction or dissatisfaction with those attributes.
References
- van Mead, “The world’s worst traffic: can Jakarta find an alternative to the car?,” https://www.theguardian.com/cities/2016/nov/23/world-worst-traffic-jakarta-alternative, 2016.
- Zhang, Y. Liu, W. Lu, and G. Xiao, “Evaluating passenger satisfaction index based on PLS-SEM model: Evidence from Chinese public transport service,” Transp. Res. Part A Policy Pract, 2017,120:149-164, 2019.
- A. Saif, M. M. Zefreh, and A. Torok, “Public transport accessibility: A literature review,” Period. Polytech. Transp. Eng., 47:36-43, 2019.
- Mouwen, “Drivers of customer satisfaction with public transport services,” Transp. Res. Part A Policy Pract. 78:1-20, 2015.
- T. Lai and C. F. Chen, “Behavioral intentions of public transit passengers-The roles of service quality, perceived value, satisfaction and involvement,” Transp. Policy. 18:318-325, 2011.
- N. Borhan, D. Syamsunur, N. Mohd Akhir, M. R. Mat Yazid, A. Ismail, and R. A. Rahmat, “Predicting the use of public transportation: A case study from Putrajaya, malaysia,” Sci. World J., 2014.
- JUTPI, “Jabodetabek urban transportation policy integration project,” Jakarta, 2018.
- JUTPI, “Jabodetabek urban transportation policy integration project,” Jakarta, 2012.
- Badan Pusat Statistik, “Statistik Komuter Jabodetabek. Hasil Survei Komuter Jabodetabek 2019,” 2019.
- Kompas, “Sepeda Motor Pilihan Utama Komuter,” Jakarta, Feb. 04, 2022.
- de D. Ortúzar and L. G. Willumsen, Modelling Transport. 2011.
- Park and S. Chowdhury, “Investigating the barriers in a typical journey by public transport Tusers with disabilities,” J. Transp. Heal. 10:361-368, 2018.
- Paulley et al., “The demand for public transport: The effects of fares, quality of service, income and car ownership,” Transp. Policy, 13:295-306, 2006.
- Eboli and G. Mazzulla, “A new customer satisfaction index for evaluating transit service quality,” J. Public Transp. 12:21-37, 2009.
- de Oña, R. de Oña, L. Eboli, and G. Mazzulla, “Index numbers for monitoring transit service quality,” Transp. Res. Part A Policy Pract. 84:18-30, 2016.
- Ni, C. Zhang, Y. Hu, W. Lu, and H. Li, “Influence mechanism of the corporate image on passenger satisfaction with public transport in China,” Transp. Policy, 94:54-65, 2020.
- Z. Irawan, P. F. Belgiawan, A. K. M. Tarigan, and F. Wijanarko, “To compete or not compete: exploring the relationships between motorcycle-based ride-sourcing, motorcycle taxis, and public transport in the Jakarta metropolitan area,” Transportation (Amst), 47:2367-2389, 2020.
- Sukwadi, S. Cory, and Y. C. Liang, “the Study of Travel Satisfaction in Mrt Jakarta During the Pandemic of Covid-19,” Geoj. Tour. Geosites, 40:191-199, 2022.
- Allen, J. C. Muñoz, and J. de D. Ortúzar, “Understanding public transport satisfaction: Using Maslow’s hierarchy of (transit) needs,” Transp. Policy, 81:75-94, 2019.
- A. Nwachukwu, “Assessment of passenger satisfaction with intra-city public bus transport services in abuja, nigeria,” J. Public Transp, 17:99-119, 2014.
- Joewono and H. Kubota, “User Perceptions of Private Paratransit Operation in Indonesia,” J. Public Transp. 10:99-118, 2007.
- Aghajanzadeh, K. Aghabayk, J. Esmailpour, and C. De Gruyter, “Importance – Performance Analysis (IPA) of metro service attributes during the COVID-19 pandemic,” Case Stud. Transp. Policy, no. June, 2022.
- Fellesson and M. Friman, “Perceived Satisfaction with Public Transport Service in Nine European Cities,” J. Transp. Res. Forum, vol. 47, 2012.
- Sumaedi, I. G. M. Y. Bakti, T. Rakhmawati, N. J. Astrini, T. Widianti, and M. Yarmen, “Factors influencing public transport passengers’ satisfaction: a new model,” Manag. Environ. Qual. An Int. J., 27:585-597, 2016.
- Duleba and S. Moslem, “User satisfaction survey on public transport by a new pahp based model,” Appl. Sci., vol. 11, no. 21, 2021.
- S. Wachyuni, “The Effects of Service Quality, Customer Perceived Value, and Customer Satisfaction Towards Customer Loyalty of Damri Tour Bus,” J. Bus. Hosp. Tour. 5:285, 2019.
- Dechen, S. Sanyost, and A. M. Syah, “A Proposed Partnership Scheme of Bangkok Mass Transit System (BTS) and Mice Corporations: Passenger Satisfaction and Tourism Transport Policy Approach,” E-Journal Tour., 8:215, 2021.
- Li, Q. Y. Chen, Z. Liu, and H. C. Liu, “Public transport customer satisfaction evaluation using an extended thermodynamic method: a case study of Shanghai, China,” Soft Comput. 25:10901-10914, 2021.
- Cantwell, B. Caulfield, and M. O’Mahony, “Examining the Factors that Impact Public Transport Commuting Satisfaction,” J. Public Transp. 12:1-21 2009.
- Rojo, H. Gonzalo-Orden, L. dell’Olio, and ángel Ibeas, “Relationship between service quality and demand for inter-urban buses,” Transp. Res. Part A Policy Pract. 46:1716-1729, 2012.
- C. Zulham, T. R. Fathullah, A. A. Suryobuwono, and H. Sampurna, “The Effect of Service Quality Towards Customer Satisfaction In Jakarta (Case Study: Minimum Service Standards),” Adv. Transp. Logist. Res. 696-701, 2019.
- N. H. Ibrahim and M. N. Borhan, “The Interrelationship Between Perceived Quality, Perceived Value and User Satisfaction Towards Behavioral Intention in Public Transportation: A Review of the Evidence,” Int. J. Adv. Sci. Eng. Inf. Technol. 10:2048-2056, 2020.
- Ladhari, “A review of twenty years of SERVQUAL research,” Int. J. Qual. Serv. Sci. 1:172-198, 2009.
- M. del Castillo and F. G. Benitez, “Determining a public transport satisfaction index from user surveys,” Transp. A Transp. Sci, 9:713-741, 2013.
- Sumaedi, I. Gede Mahatma, Y. Bakti, and M. Yarmen, “The Empirical Study of Public Transport Passengers’ Behavioral Intentions: The Roles Of Service Quality, Perceived Sacrifice, Perceived Value, And Satısfaction,” Res. Cent. Qual. Syst. Test. Technol. 2:83-97, 2012.
- Tecoalu, “The Effect of Service Quality, Promotion Strategy and Company Image on Word of Mouth in Mediation by Online Transport Customer Satisfaction Jakarta Region,” Rev. Gestão Inovação e Tecnol. 11:93-102, 2021.
- Supriyadi, A. S. Manggabari, and H. Nastiti, “Analisis Kepuasan Pengguna Jasa Transportasi Umum Jak Lingko di Jakarta Selatan,” Pros. BIEMA Bus. Manag. Econ. Account. Natl. Semin. 1:1089-1102, 2020.
- Nurmahdi, “Customer satisfaction index for transport services,” Int. J. Econ. Bus. Adm. 7:192-199, 2019.
- B. Joewono, A. Matthew, and M. Rizki, “Loyalty of paratransit users in the era of competition with ride sourcing,” Sustain. 13:1-20, 2021.
- Cecilia ADRIANA, M. RIZKIb, T. Basuki JOEWONOc, “Investigating Satisfaction and Its Determinants of BRT-Lite Services in Indonesian Cities,” J. East. Asia Soc. Transp. Stud. 13:1447-1468, 2019.
- Sun, Y. Huang, Y. Chen, and L. Yao, “Vulnerability assessment of urban rail transit based on multi-static weighted method in Beijing, China,” Transp. Res. Part A Policy Pract. 108:12-24, 2018.
- N. H. Ibrahim, M. N. Borhan, M. H. Osman, F. H. Khairuddin, and N. M. Zakaria, “An Empirical Study of Passengers’ Perceived Satisfaction with Monorail Service Quality: Case of Kuala Lumpur, Malaysia,” Sustainability, 14:6496, 2022.
- N. H. Ibrahim, M. N. Borhan, M. H. Osman, M. R. M. Yazid, and M. Md. Rohani, “The Influence of Service Quality on User’s Perceived Satisfaction with Light Rail Transit Service in Klang Valley, Malaysia,” Mathematics, 10:2213, 2022.
- T. Pelangi, R. Situmorang, J. C. Levara, and H. M. Taki, “Satisfaction level of intermodal public transport passengers at Duri Station, Jakarta Indonesia,” IOP Conf. Ser. Earth Environ. Sci., vol. 737, no. 1, 2021.
- I. Rifai and F. Arifin, “Analysis of The Level of Passenger Satisfaction With Services And Transport Facilities-Based Integration in Jakarta,” J. World Conf, 2:66-73, 2020.
- K. Nagari, S. Suryani, and W. D. Pratiwi, “TOD Tourism Heritage District Livability: User Satisfaction in Kali Besar Corridor in Jakarta, Indonesia,” IOP Conf. Ser. Earth Environ. Sci., vol. 532, no. 1, 2020.
- Isradi, N. Fahriah, D. Prilita, A. Mufhidin, W. Budi, and J. Prasetijo, “Customer Satisfaction Analysis of LRT Feeder Transport: A Case Study of the Jakarta Metropolitan City,” Int. J. Eng. Nat. Sci. 6:55-61, 2020.
- V. K. Prabantari, “Analisis Hubungan Kualitas Pelayanan Terhadap Tingkat Kepuasan Pelanggan Transportasi TransJakarta,” J. Transaksi 12:25-39, 2020.
- Stam, N. van Oort, H. J. van Strijp-Harms, S. C. van der Spek, and S. P. Hoogendoorn, “Travellers’ preferences towards existing and emerging means of first/last mile transport: a case study for the Almere centrum railway station in the Netherlands,” Eur. Transp. Res. Rev., vol. 13, no. 1, pp. 1-14, 2021.
- E. A. EEA, “The first and last mile — the key to sustainable urban transport. Transport and environment report 2019.,” 2020.
- Los Angeles Metro, “First last mile strategic plan,” 2015.
- Mohiuddin, “Planning for the first and last mile: A review of practices at selected transit agencies in the united states,” Sustain. 13:1-19, 2021.
- van Lierop, M. G. Badami, and A. M. El-Geneidy, “What influences satisfaction and loyalty in public transport? A review of the literature,” Transp. Rev. 38:52-72, 2018.
- Anderson, B. Condry, N. Findlay, R. Brage-Ardao, and H. Li, “Measuring and Valuing Convenience and Service Quality,” 2013.
- Imam, “Measuring Public Transport Satisfaction from User Surveys,” Int. J. Bus. Manag., vol. 9, no. 6, 2014.
- Wang and Y. Liu, “Factors Influencing Public Transport Use: A Study of University Commuters’ Travel and Mode Choice Behaviours,” State Aust. Cities Conf. 2015, p. 14, 2015.
- Tangphaisankun, F. Nakamura, and T. Okamura, “Influences of Paratransit as A Feeder of Mass Transit System in Developing Countries Based on Commuter Satisfaction,” J. East. Asia Soc. Transp. Stud. 8:2009-2009, 2009.
- Olivková, “Model for measuring passenger satisfaction and assessing mass transit quality,” J. Public Transp. 18:52-70, 2015.
- N. Prayudyanto, O. Z. Tamin, and G. Besar, “Kajian Park and Ride untuk Busway Jakarta,” J. Transp., vol. 7, no. 2, p. 10, 2007.
- V. Corazza, U. Guida, A. Musso, and M. Tozzi, “A European vision for more environmentally friendly buses,” Transp. Res. Part D Transp. Environ. 45:48-63, 2016.
Appendix
Table 1: Result of satisfaction index.
Service attributes
Importance
Weight of importance
Satisfaction
indeks
1
B1
Fare of mass transit
4,000
0,041
3,685
0,152
2
B2
Fare of Feeder
4,138
0,043
3,315
0,142
3
B3
Tariff integration
4,089
0,042
3,571
0,151
4
B4
non-cash payment
4,039
0,042
3,887*
0,162
5
W1
Travel time of mass transit
4,271
0,044
3,562
0,157
6
W2
Waiting time
4,202
0,043
3,360
0,146
7
W3
Travel time of feeder
4,197
0,043
3,493
0,151
8
W4
Terminal distance
4,192
0,043
3,547
0,154
9
N1
Seat condition
4,123
0,043
3,616
0,154
10
N2
Air Conditioner
4,187
0,043
3,704
0,160
11
N3
Parking facility
3,906
0,040
3,399
0,137
12
N4
Disability’s facility
4,305
0,044
3,379
0,150
13
N5
Cleanness of Vehicle
4,409*
0,046
3,828*
0,174
14
N6
Cleanness of Terminus
4,369*
0,045
3,567
0,161
15
H1
Punctuality
4,429*
0,046
3,493
0,160
16
H2
Schedule availability
4,296
0,044
3,360
0,149
17
H3
Vehicle capacity
4,286
0,044
3,143
0,139
18
H4
Feeder availibility
3,985
0,041
3,394
0,140
19
I
Information availability
4,266
0,044
3,567
0,157
20
A1
Lighting availability
4,251
0,044
3,759
0,165
21
A2
Security officer availability
4,296
0,044
3,813*
0,169
22
A3
CCTV camera
4,276
0,044
3,433
0,152
23
L
Environmentally friendly vehicle
4,325
0,045
3,281
0,147
Total
1,000
3,53
*Top three
Gender
#
%
Income Level
#
%
Age
#
%
Male
80
39%
< 3 million IDR
143
70%
<20
34
17%
Female
123
61%
3-5 million IDR
23
11%
20-25
159
78%
Domicile Area
#
%
5-10 million
31
15%
26-45
8
4%
Jakarta Selatan
52
26%
10-20 mill. IDR
6
3%
46-60
2
1%
Jakarta Timur
48
24%
Daily transport expense
#
%
Occupation
#
%
Jakarta Pusat
4
2%
< Rp. 10.000
21
10%
employee
30
14,8%
Jakarta Barat
15
7%
Rp. 10.000-15.000
67
33%
students
166
81,8%
Jakarta Utara
9
4%
Rp. 15.000-25.000
73
36%
entrepreneur
5
2,5%
Kab. Bogor
4
2%
Rp. 25.000-50.000
32
16%
government
1
0,5%
Kota Bogor
13
6%
>Rp.50.000
10
5%
freelance
1
0,5%
Depok
29
14%
Education
#
%
Mass Transit mode
#
%
Kab Tangerang
3
1%
elementary
2
1%
BRT/TransJakarta
33
16%
Kota Tangerang
6
3%
high school
118
58%
KRLCommuterline
132
65%
Kota Tangsel
9
4%
bachelor
81
40%
MRT
38
19%
Kab. Bekasi
3
1%
post graduate
2
1%
Kota Bekasi
8
4%
Selected Attribute
[20]
[57]
[13]
[4]
[22]
[29]
[34]
[33]
[54]
[55]
[56]
[58]
[14]
[43]
Location
Bandung
Bangkok
Cosenza
Kaohsiung
Europe
Castilla
Jakarta
Bilbao
Europe
Amman
St.Lucia
Ostrava
Granada
Jakarta
Mode type
para
para
bus
MRT
bus
bus
para
bus
bus
bus
bus
bus
bus
BRT
B1
Fare
Fare of mass transit
v
v
v
v
v
v
v
v
v
B2
Fare of Feeder
v
v
B3
Tariff integration
v
v
v
v
B4
non-cash payment
v
v
v
v
W1
Time
Travel time of mass transit
v
v
v
v
v
v
v
v
W2
Waiting time
v
v
v
v
v
v
v
v
v
v
v
W3
Travel time of feeder
v
v
v
W4
Terminal distance
v
v
v
v
v
v
N1
Comfort
Seat condition
v
v
v
v
v
v
v
v
N2
Air Conditioner
v
v
v
v
v
v
v
v
v
N3
Parking facility
v
N4
Disability’s facility
v
v
N5
Cleanness of Vehicle
v
v
v
v
v
v
v
N6
Cleanness of Terminus
v
v
v
H1
Reliability
Punctuality
v
v
v
v
v
v
v
H2
Schedule availability
v
v
v
v
v
v
v
v
v
v
v
H3
Vehicle capacity
v
v
v
v
v
v
v
H4
Feeder availibility
v
v
v
v
v
v
I
Information availability
v
v
v
v
v
v
v
v
v
A1
Safety
Lighting availability
v
v
v
v
v
v
A2
Security officer availability
v
v
v
v
v
v
v
v
v
v
v
A3
CCTV
v
v
v
v
v
L
En
Environmentally friendly vehicle
v
v
v
v
v
