Publication Information
ISSN 2691-8803
Frequency: Continuous
Format: PDF and HTML
Versions: Online (Open Access)
Year first Published: 2019
Language: English
| Journal Menu |
| Editorial Board |
| Reviewer Board |
| Articles |
| Open Access |
| Special Issue Proposals |
| Guidelines for Authors |
| Guidelines for Editors |
| Guidelines for Reviewers |
| Membership |
| Fee and Guidelines |
 |
Iodine Deficiency and Anemia Levels of Urban and Rural Egyptian Children; Follow Up Study
Entsar Saad Shaaban1, Gamal Abdel Naser Yamamah2, Rania A Bassuoni3, Laila Hussein3, Magda S Mohamed3, Mosab Gad3*
1Home Economics Department, Faculty of women for Arts, Science and Education, Ain Shams University, Egypt
2Department of Pediatrics, National Research Centre, Cairo 12662, Egypt
3Nutrition and food science Department, National Research Centre, Cairo 12662, Egypt
Citation: Shaaban E S, Yamamah G A N, Bassuoni R A, Hussein L, Mohamed M S, Gad M. (2022) Iodine Deficiency and Anemia Levels of Urban and Rural Egyptian Children; Follow Up Study. Adv Pub Health Com Trop Med: APCTM-172.
DOI: 10.37722/APHCTM.2022601
Abstract
Both iodine deficiency (ID) and anemia have been known as health problems for decades, especially in underdeveloped and developing countries including Egypt. International recommendations urged all countries to eradicate iodine deficiency through implementation of salt iodization. Awareness about anemia and its consequences for the health and development of women and children has increased in the past few decades. In Egypt, measures applied to combat iodine deficiency through salt iodization and combat anemia through iron fortified school meal are running for more than 20 years. We aimed to evaluate ID and anemia status in Egyptian children in rural and urban communities. The study group consisted of 201 Egyptian children of both sexes with mean age 78.24 ± 25.01 months. children were recruited from two different communities: urban (90 children) and rural (111 children). Study subjects were subjected to medical history recording and clinical examination, determination of blood hemoglobin and urinary iodine measuring. The mean levels of urinary iodine concentrations (UIC) of the studied groups were within normal accepted values (≥ 100-199 µg/L). Statistical difference between urban and rural communities was highly significant (p=0.0007). Median UIC of total group was 150.65 µg/L. The % of anemia of the study group was 42.05%. It was higher in rural (47.62%) compared to urban area (35.56%). Yet, the difference wasn’t significant. Moderate and severe anemia degrees were more prevalent in rural compared to urban area with significant difference (p=0.0436).
In Egypt, the objectives of the salt iodization program could be considered as met at the national level, we can regard it as iodine deficiency disorder free country. In Egypt, anemia is still a health problem that needs national intervention program and continuous follow up. Monitoring of anemia is critical and prevention of ID in early childhood should remain a public health priority.
Keywords: Anemia; Children; Iodine Deficiency; Rural; Salt Iodization Program; Urban
Introduction
Both iodine deficiency (ID) and anemia have been known as health problems for decades, especially in underdeveloped and developing countries including Egypt. Iodine deficiency hinders growth and cognitive development. It is the single greatest cause of preventable mental impairment in the world [1]. In 1990, the World Summit for Children called for the elimination of iodine deficiency disorders (IDD) by the year 2000. After four years (1994), the Joint UNICEF/WHO Committee on Health Policy urged all countries to adopt and implement universal salt iodization (USI) [2]. In low-income countries, the proportion of households consuming iodized salt increased from 20% in 1990 to 70%, by 2000 and has expanded to 88% in 2019 [3]. Urinary iodine concentration (UIC), which is a quantitative and sensitive biochemical indicator, can assess the full range of population iodine status [4]. The median urinary iodine concentration (MUIC) value allows for the classification of countries as having optimal iodine nutrition, IDDs, or iodine excess [5]. In the global burden of disease (GBD) 2019; anemia was defined as decreased blood hemoglobin concentrations irrespective of the underlying cause, red blood cell morphology or red blood cell function [6].
The thresholds used to define individuals as anemic, and the anemia severity thresholds are based on WHO thresholds for hemoglobin in g/L [7]. Anemia, or low hemoglobin concentrations, adversely affects cognitive and motor development and causes fatigue and low productivity [8]. Symptoms of anemia are diverse and can include fatigue, weakness, headedness, headache, pallor, tachycardia, palpitations, chest pain, dyspnea, and cold distal extremities or claudication. These signs and symptoms vary in prevalence and magnitude [9]. Awareness about anemia and its consequences for the health and development of women and children has increased in the past few decades. In 2012, the 65th World Health Assembly approved an action plan and global targets for maternal, infant, and child nutrition, with a commitment to halve anemia prevalence in women of reproductive age by 2025, from 2011 levels [10].
Oftentimes anemia is not evaluated or managed adequately. It is routinely listed as a freestanding diagnosis; however, it is in fact a clinical sign indicating the presence of an underlying cause [9]. We aimed to assess the efficacy of salt iodization program for eradication of iodine deficiency and assess changes in anemia levels through twenty years for children living in both urban and rural communities in Egypt.
Subjects and Methods
Study subjects
The total study group consisted of 201 Egyptian children of both sexes with mean age 78.24 ± 25.01 months. Table (1) represents age, weights, and heights, calculated body mass index, height for age z-score (HAZ) and weight for age z-score (WAZ) of the studied children.
The participating children were recruited from two different communities; the first is urban at Giza city (90 children), while the second from El-Nowira village which belongs to the rural Beni-Suef governorate (111 children). The distance between the 2 governorates is 200 kilometers. Children below 60 months of age were recruited from morning care centers, while the older children were attending primary schools. Data of each subgroup (Giza and Beni -Suef) are illustrated in Table (1).
The age and sex of each child were obtained from the birth certificate; body weight and standing height measurements were taken, while the child was with light clothes and barefooted. Based on the data of age, sex, body weight, and height for each child, the respective nutritional indices of physical growth namely weight for age z- score (WAZ) and height for age z- score (HAZ) were computed using the EPI-INFO software program [11]. The child whose WAZ score measures below (-2.0) was underweight for his age. The child whose HAZ was below (-2.0) from the WHO child growth standards reference population was considered short for his age or stunted [12].
Body mass index (BMI) was calculated as weight (Kg) divided by square height (meter). Children with marked stunting or under nutrition were excluded.
Inclusion criteria: Acceptance of child’s mother or caretaker to participate in the study and signing approval certificate. Clinically healthy children who are free of chronic health problems or marked stunting or underweight were only included.
| Item | All children | Study community | |
| Al-Giza (urban) | Beni-Suef (rural) | ||
| Number | 201 | 90 | 111 |
| Males / females | 100 / 101 | 44 / 46 | 56 / 55 |
| Age (mo) range
± S.D |
34.04 – 137.0
78.24 ± 25.01 |
34.04 – 118.08
77.44 ± 24.24 |
34.42 – 137.00
78.68 ± 25.70 |
| Weight (Kg) range | 13.0 – 50.0
21.90 ± 6.20 |
13.50 – 30.0
20.80 ± 4.21 |
13.0 – 50.0
23.0 ± 7.30 |
| Height (cm) range
± S.D |
80.0 – 139.0
113.1 ± 13.08 |
91.0 – 133.0
113.7 ± 12.25 |
80.0 – 139.0
113.0 ± 14.0 |
| BMI range
± S.D |
13.88 – 37.50
16.92 ± 2.43 |
13.88 – 19.20
15.99 ± 1.20 |
13.89 – 37.50
17.68 ± 2.88 |
| HAZ range
± S.D |
-3.45 – 2.96
-0.87 ± 0.91 |
-2.41 – 1.48
-0.78 ± 0.68 |
-3.45 – 2.96
-0.94 ±1.05 |
| WAZ range
± S.D |
-2.64 – 2.85
-0.08 ± 0.96 |
-1.45 -1.72
-0.10 ± 0.75 |
-2.64 – 2.85
-0.08 ± 1.10 |
Table 1: represents age, gender, and anthropometric data of the study subjects.
Methods
Sample size was calculated using confidence interval 7.19, according to the research mediated by Madani et al (2022) [13], and confidence level 95%. By applying survey system program for sample size calculation [14]. Accepted sample size is 186.
Studied children were subjected to the following:
- Medical history was recorded, and clinical examination was mediated by pediatrician to exclude any child complaining of chronic or debilitating disease.
- Determination of blood hemoglobin was done by the cyanmethemoglobin method [15]. The degree of anemia was determined by age according to WHO classification. Total anemia was defined according to WHO cut off points of hemoglobin less than 110 g/L for children younger than 5 years and severe anemia as hemoglobin less than 70 g/L for children younger than 5 years [10].
- Urinary iodine concentration was measured according to the method of Sullivan (2000) [16].
- Statistical analysis was mediated using two-sample t-test to compare means of groups and CHI square test was used for quantitative data analysis. P< 0.05 was considered significant.
Results
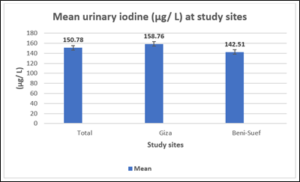
Figure 1: Mean UIC (µ/L) of the studied children and subgroups.
Figure (1) illustrates the mean of UIC (µg/L) of the studied children and subgroups. All groups show levels of UIC within normal accepted values (≥ 100 – 199 µg/L). Statistical difference between Giza and Beni-Suef was highly significant (p=0.00007). Median UIC of total group was 150.65 µg/L, That of Giza was 158.2 µg/L and Beni-Suef was 138.11 µg/L.
| Item | All children No (%) | Giza No (%) | Beni-Suef No (%) |
| Norm | 113 (57.95%) | 58 (64.44%) | 55 (52.38%) |
| All anemia | 82 (42.05%) | 32 (35.56%) | 50 (47.62%) |
| Degree of anemia | |||
| Mild | 30 (36.59%) | 16 (50.0%) | 14 (28.0%) |
| Mod | 40 (48.78%) | 16 (50.0%) | 24 (48.0%) |
| Severe | 12 (14.63%) | 0.0 | 12 (24.0%) |
Table 2: Data of anemia % and anemia degrees’ distribution of studied groups.
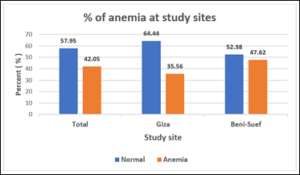
Figure 2: % of anemia at study sites.
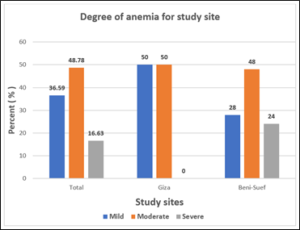
Figure 3: Distribution of degrees of anemia for study sites.
Table (2) and figures (2 & 3) represent % prevalence of anemia and anemia degrees’ distribution of the studied groups. Difference of anemia prevalence between Giza and Beni-Suef was not significant (p= 0.0889).
The % of anemia of the study group was 42.05% which is still high. It’s higher in Beni-Suef (47.62%) compared to Giza (35.56%). Yet, the difference wasn’t significant. Moderate and severe anemia degrees were more prevalent in Beni-Suef compared to Giza with significant difference (p=0.0436).
Discussion
Iodine is an essential trace element required for normal thyroid hormones activity. Both insufficient and excessive iodine intake can cause thyroid-hormone disorders [2]. Iodine deficiency hinders growth and cognitive development. It is the single greatest cause of preventable mental impairment in the world [17]. Urinary iodine concentration (UIC) is a quantitative and sensitive biochemical indicator that can assess the full range of population’s iodine status. The median UIC (MUIC) value, allows for countries’ classification as having optimal iodine nutrition, iodine deficiency disorders (IDDs), or iodine excess [2]. Using the criteria from WHO/UNICEF/ICCIDD, iodine status is identified based on the median UIC, where the median UIC <= 99 µg/L is considered insufficient, 100-199 µg/L is adequate, 200-299 µg/L is more than adequate and >300 µg/L is considered excessive [18]. In 1990, the World Summit for Children called for the elimination of IDDs by the year 2000. After four years (1994), the Joint UNICEF/WHO Committee on Health Policy urged all countries to adopt and implement universal salt iodization (USI) [2]. In low-income countries, the proportion of households consuming iodized salt increased from 20% in 1990 to 70%, by 2000 and has expanded to 88% in 2019 [3]. Universal Salt Iodization (USI) is globally accepted as the most cost-effective public health strategy for the prevention and control of IDD [19]. USI has been implemented in more than 120 countries worldwide, and many of them have successfully eliminated IDD or made substantial progress in their control [20]. After 18 years of salt iodization program more detailed studies are still needed to confirm that all communities are equally protected of IDD [21]. Implementation of USI programs (between 1993 and 2019) for 129 countries with a total population of 5.1 billion in 1993 and 139 countries with a total population of >7.1 billion in 2019 showed that there has been a dramatic decline in the number of countries classified as iodine deficient from 116 countries in 1993 to 19 in 2019. This estimates the impact over the past 25 years toward the global elimination of severe iodine deficiency, primarily through USI program [5]. Salt iodization in Egypt started in 1996. It is now implemented according to mandatory legislation for iodization of household salt and of salt used in the baking industry (Specification No. 2732-1/2005 issued by the Egyptian organization of standardization and quality). Regulations state that salt should be iodized at the level of 30-70 mg/kg potassium iodate (KIO3), equivalent to approximately 18-41.5 mg/kg iodine [17]. Published data before the implementation of salt iodization in the New Valley governorate showed that the mean UIC among children was 76± 50 µ/L and those having UIC <100 µ/L were 76% [22]. A more recent study mediated in South Sinai after USI implementation defined 57.9% of the children having UIC <100 µ/L, among them 20.12% were <50 µ/L [23]. Present results showed nearly complete eradication of ID with mean Urinary iodine150.78± 28.29 µg/L The difference between urban and rural communities was significant (p< 0.001). MUIC was 150.65 µg/L for the studied group. MUIC for urban and rural subgroups were 159.2 µg/L and 138.11 µg/L respectively.
The objectives of the USI program could be considered as met at the national level, with reference to the adequacy criteria of a median in the 100 µg/L to less than 300 µg/L range, which define acceptable iodine status at population level. Additionally, UIC criteria regarding the “IDD free country” certification was met [24]. Results of USI were inconsistent in different countries, many of the became ID free as Tunisia [20] which is comparable to the low rates observed in the American continent [20]. In China, there was a dramatic decrease in ID but MUIC rose to 330 µg/L in 1997 and became 306 µg/L in 1999 [25]. Some African countries and East Mediterranean countries still have high % children with low UIC levels, 41.4%, and 48.8%, respectively [26].
Anemia, or low concentrations of blood hemoglobin, affects cognitive and motor development adversely and causes fatigue and low productivity [8]. Oftentimes anemia is not evaluated or treated adequately. It is usually listed as freestanding [9]. The sustainable development goals for 2030 created by the United Nation organization in the year 2015 imply that each of the 193 member states should do substantial efforts and undertake actions to reduce stunting, wasting and anemia (indicators of hunger) by 50 % by the year 2030 (SDG, 2030) [27]. Periodic evaluation of anemia prevalence at global and national levels was recorded throughout the last decades to assess improvement in anemia management. Global mean hemoglobin improved slightly between 1995 and 2011, from 109 g/L to 111 g/L in children. Anemia prevalence decreased from 47% (43-51) to 43% (38-47) in children. This prevalence translated to 273 million children with anemia in 2011 [10]. In 2019, there were 1.8 billion prevalent cases of anemia across the world, which is 13.4% lower than in 1990 (the world population was estimated to be 5.35 billion in 1990 and 7.74 billion in 2019) [6]. The global number of prevalent cases of anemia increased from 1.4 billion in 1990 to 1.8 billion in 2019. South Asia, East Asia, and Southeast Asia experienced the largest number of prevalent cases in 1990, while the highest in 2019 was found in South Asia, Western Sub-Saharan Africa, and Eastern Sub-Saharan Africa [6]. Many studies for the estimation of prevalence of anemia in Egyptian children were mediated. In El- Fayoum during 2011- 2012 iron deficiency anemia was found in 64% of studied children (20% mild, 41.7% moderate, and 2.3% severe) [28]. In South Sinai, 1832 children were tested for anemia, 37.7% of children had mild to moderate degrees of anemia [29]. One more recent study recorded data of 33150 children distributed in diverse geographical districts, anemia was diagnosed in 26% of them [30]. In the present work prevalence of anemia was 42.05% of the studied children. Mild, moderate, and severe anemias were 36.59%, 48.78 and 14.63%; respectively. Prevalence among rural children was 47.62% which is higher than that of children living at urban communities which were 35.56%. The prevalence of mild, moderate, and severe anemias among rural children was 28.0%, 48.0%, and 24.0%; respectively. The corresponding values for urban children were 50.0%, 50.0%, and 0.0%. In China, the mean blood hemoglobin increased among children and adolescents, from 135.2 ± 13.9g/L in CNNHS at 2002 to 141.2 ± 15.8 g/L in CNNHS at 2010-2012, the prevalence of anemia decreased from 12.6% to 6.6% (p < 0.0001) [31]. The anemia prevalence of Chinese SAC in primary schools was 4.4%. Among children with anemia, (53.5%) had mild anemia, 45.3% had moderate anemia, 1.2% had severe anemia). There were significant differences in children’s anemia between urban and rural areas (p < 0.01). Anemia prevalence of urban children was 3.5% compared to rural children (5.0%) [32]. In US, the prevalence of anemia among children 1-5 years using data from 2007-2010 National Health and Nutrition Examination Survey (NHANES) was 3.2%. This analysis provides an update on the prevalence of anemia for a representative sample of US children. Little change in this indicator was observed over the past decade [33]. In Ethiopia, the overall pooled prevalence of anemia among children was 34.4%. One in three children was anemic in Ethiopia [34]. In developing countries, about half of children are estimated to be anemic, and it is prevalent in sub-Saharan African Countries as Kenya 48.9% [35], Mali 55.8% [36], and Tanzania 79.6% [37]. The report of the Ethiopian Demographic and Health Survey (EDHS) at 2016 stated that more than half (57%) of Ethiopian children aged 6-59 months have anemia, which is higher than that reported in EDHS 2011 (44%). The EDHS 2016 report showed also that mild, moderate, and severe anemia were 25%, 29%, and 3%, respectively. Children in rural areas are at higher risk of anemia than children in urban areas (58% vs 49%) [38]. In Saudi Arabia, the prevalence of anemia was 27.2% (40/147) in children (age 7-11 years) [13].
Conclusion
In Egypt, the objectives of the salt iodization program could be considered as met at the national level, we can regard it as iodine deficiency disorder free country. In Egypt, anemia is still a health problem that needs national intervention program and continuous follow up. Monitoring of anemia is critical and prevention of ID in early childhood should remain a public health priority.
Ethical approval
The research protocol and all informed consent documents were approved by the NRC Medical Research Ethics Committee (MREC), approval number 16-422. The mothers of the children were interviewed for explaining the details of the study. Those accepting were asked to sign an informed written consent.
Competing of interest: The authors declare no conflict of interest.
Acknowledgments
The authors have received funding from the STDF scientific, technological, and innovative Fund under the project agreement no. 30023. The authors are grateful to the participants and their mothers, who without their cooperation this study could not be completed.
References
- Food and Agricultural Organization of the United Nations. CODEX Alimentarius: List of Standards Codex Standard for Food-Grade Salt, CX STAN 150-1985, Rev. 1-1997, Amend. 1-1999, Amend. 2-2001, Amend. 3-2006.
- WHO, UNICEF, ICCIDD Progress towards the elimination of iodine deficiency disorders (IDD) World Health Organization, Geneva, Switzerland; 1999.
- UNICEF Global Database on Household Iodized Salt.
- Rohner F, Zimmermann M, Jooste P, Pandav C, Caldwell K, et al. (2014). Biomarkers of nutrition for development-iodine review. J Nutr 144:1322S-1342S.
- Gorstein J, Bagriansky J, Pearce E, et al. (2020). Estimating the Health and Economic Benefits of Universal Salt Iodization Programs to Correct Iodine Deficiency Disorders. THYROID, 30, 12, 1802-1809. Mary Ann Liebert, Inc.
- Safiri S, Kolahi A, Noori M, et al. (2021). Burden of anemia and its underlying causes in 204 countries and territories, 1990-2019: results from the Global Burden of Disease Study 2019. Safiri et al. J Hematol Oncol 14:185-200.
- World Health Organization. Haemoglobin concentrations for the diagnosis of anaemia and assessment of severity. Geneva: World Health Organization; 2011.
- Balarajan Y, Ramakrishnan U, Ozaltin E, et al. (2011). Anaemia in low-income and middle-income countries. Lancet; 378:2123-2135.
- Freeman A, Rai M, Morando D. Anemia Screening. In: StatPearls. Treasure Island (FL): StatPearls Publishing; 2022.
- Stevens G, Finucane M, De-Regil L, et al. (2013). Global, regional, and national trends in hemoglobin concentration and prevalence of total and severe anaemia in children and pregnant and non-pregnant women for 1995-2011: a systematic analysis of population-representative Lancet Glob Health.1: 16-25.
- Epi Info- 7, Division of Health Informatics & Surveillance (DHIS), Center for Surveillance, Epidemiology & Laboratory Services (CSELS). Centre for disease control and prevention.
- Software for assessing growth and development of the world’s children. WHO, 2006, Geneva.
- Madani B M, Alsulami A M, Abu Alola I A, et al. (2022) Prevalence of Anemia Among Children and Adolescents in Rural Area of Khulais in Saudi Arabia. Cureus 14: e21894.
- Sample Size Calculator – Creative Research Systems.
- Van Assendelft O W. The assessment of hemoglobin. In: Modern concepts in hematology. Eds;Isak G., Lewis S.M. New York Academic Press. P14; (1977).
- Sullivan KM, May S, Maberly G. Urinary Iodine Assessment, A Manual on Survey and Laboratory Methods, PAMM, Unicef 15, 2nd ed. 2000.
- Knowles J, Haar F, Shehata M, et al. (2017). Iodine Intake through Processed Food: Case Studies from Egypt, Indonesia, the Philippines, the Russian Federation and Ukraine, 2010-2015 Nutrients 9, 797.
- World Health Organization, United Nations Children’s Fund, International Council for the Control of Iodine Deficiency Disorders Assessment of iodine deficiency disorders and monitoring their elimination: A guide for program managers. Geneva, Switzerland: World Health Organization; 2007.
- United Nations Children’s Fund (UNICEF); World Health Organization (WHO). World Summit for Children-Mid-Decade Goal: Iodine Deficiency Disorders; Special Session; UNICEF-WHO Joint Committee on Health Policy: Geneva, Switzerland, 1994.
- Li M, Eastman CJ (2012). The changing epidemiology of iodine deficiency. Nat. Rev. Endocrinol. 8:434-440.
- Machamba A, Azevedo F, Candido A, et al. (2021). Assessment of the Impact of Salt Iodisation Programmes on Urinary Iodine Concentrations and Goitre Rates: A Systematic Review. Journal of Nutrition and Metabolism.
- Yamamah G, Hassanein M (1997). Prevalence of goiter among school children of the New Valley, the value of urinary iodine in diagnosis and prognosis. J Arab Child. 8:553-563.
- Yamamah GA, Salah MM, El Hussieny MS, et al. (2016). Monitoring of Iodine Deficiency Disorders for South Sinai Children (IDD Monitoring in South Sinai). International Journal of Pharmaceutical and Clinical Research 2016; 8:1127-1131.
- World Health Organisation; United Nations Children’s Fund and International Council for Control of Iodine Deficiency Disorders. Assessment of Iodine Deficiency Disorders and Monitoring Their Elimination: A Guide for Programme Managers, 3rd ed.; World Health Organization: Geneva, Switzerland, 2007.
- Ministry of Health of the People’s Republic of China, Ministry of Light Industry of the People’s Republic of China Outline of eliminating iodine deficient disorders in China in 2000 (Article in Chinese). Beijing;1994.
- Endemic Disease Control Department in Ministry of Public Health (1989) China national programme 1989-1995 for the control of iodine deficiency disorders (Article in Chinese). Chin J Endemiol 8:252-254.
- SDG, 2030.The Sustainable Development Goals Report 2018.
- Al Ghwass M, Halawa E, Sabry S, et al. (2015). Iron deficiency anemia in an Egyptian pediatric population: a cross-sectional study. Ann Afr Med. 14:25-31.
- Yamamah GA, Hasan NS, Mohammed AM, et al. (2015). Screening for Iron Deficiency Anemia in Children Living at South Sinai, Egypt. Athens Journal of Health, 2:207-218.
- El-Shafie A, Kasemy Z, Omar Z, et al. (2020). Prevalence of short stature and malnutrition among Egyptian primary school children and their coexistence with Anemia. Ital J Pediatr. 29;46(1):91.
- Jinghuan Wu, Yichun Hu, Min Li, et al. (2019). Prevalence of Anemia in Chinese Children and Adolescents and Its Associated Factors. Int. J. Environ. Res. Public Health. 16:1416-1428.
- Shujuan Li, Xue Cheng, Liyun Zhao, et al. (2021). Anemia of School-Age Children in Primary Schools in Southern China Should Be Paid More Attention despite the Significant Improvement at National Level: Based on Chinese Nutrition and Health Surveillance Data (2016-2017). Nutrients,13:3705-3717.
- Gupta P, Perrine C, Mei Z, et al. (2016). Iron, Anemia, and Iron Deficiency Anemia among Young Children in the United States. Nutrients, 8:330-333.
- Gebrie1 A, Alebel A. (2020). A systematic review and meta-analysis of the prevalence and predictors of anemia among children in Ethiopia. African Health Sciences, 20 4, 2007- 2021.
- Neumann CG, Bwibo NO, Murphy SP, et al. (2003). Animal source foods improve dietary quality, micronutrient status, growth and cognitive function in Kenyan school children: background, study design and baseline findings. The Journal of Nutrition, 133:3941S-3949S.
- Hall A, Roschnik N, Ouattara F, et al. (2002). A randomised trial in Mali of the effectiveness of weekly iron supplements given by teachers on the haemoglobin concentrations of schoolchildren. Public Health Nutr, 5:413- 418.
- Tatala S, Kihamia C, Kyungu L, et al. (2008). Risk factors for anaemia in schoolchildren in Tanga Region, Tanzania. Tanzania Journal of Health Research,10(4).
- Cameron A, Ewen M, Ross-Degnan D, et al. (2009). Medicine prices, availability, and affordability in 36 developing and middle-income countries: a secondary analysis. The Lancet 373:240-249.
