Publication Information
ISSN 2692-1529
Frequency: Continuous
Format: PDF and HTML
Versions: Online (Open Access)
Year first Published: 2019
Language: English
| Journal Menu |
| Editorial Board |
| Reviewer Board |
| Articles |
| Open Access |
| Special Issue Proposals |
| Guidelines for Authors |
| Guidelines for Editors |
| Guidelines for Reviewers |
| Membership |
| Fee and Guidelines |
 |
Allocation of Zones for Aquaculture in Tuscany Region: The Case Study of Follonica Gulf
P. Stipa*
Agroittica Toscana Soc. Agr srl, Italy
Received Date: November 02, 2022; Accepted Date: November 10, 2022; Published Date: November 16, 2022;
*Corresponding author: P. Stipa. Agroittica Toscana Soc. Agr srl, Italy. Email: p.stipa@agroitticatoscana.it
Citation: Stipa P (2022) Allocation of Zones for Aquaculture in Tuscany Region: The Case Study of Follonica Gulf. Jr Aqua Mar Bio Eco: JAMBE-117.
DOI: 10.37722/JAMBE.2022301
Introduction
A key bottleneck of marine aquaculture in Italy is due to the lack of allocated space. This is recognized to be a key factor limiting the expansion of the mariculture industry (COM 2021/236 final). The process through which such space is allocated, Maritime Spatial Planning, has been defined by ISPRA and the Ministry of Agriculture through a technical manual (Marino et al 2020). This process, although not yet mandatory, is conducted by competent authorities to help identify Allocated Zones for Aquaculture (AZA), consequently allowing for the culture of specified fish and bivalve species, along with the monitoring of environmental impacts within such zones.
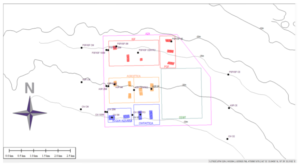
The first fish farm cluster in Italy was established by the Municipality of Piombino within the gulf of Follonica, forming an extensive zone for mariculture.
This area, was established through the administrative decision, Delibera Giunta comunale di Piombino n. 104 del 17/3/2013, a practice which, however, lacks a true scientific-based zoning process. Due to an extensive expansion of aquaculture within this zone from 2009 to 2018, it was created a hotspot of fish and bivalve culture, all adjacent to each other.
The Follonica Gulf
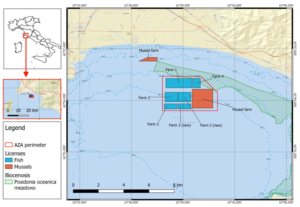
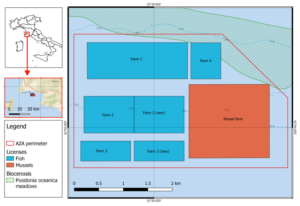
The whole AZA within the gulf is more than 16 mil m2 with 5.8 mil m2 allocated to fish culture and 3.7 mil m2 to bivalve culture. The remaining 7.1 mil m2 were identified by the municipality as safety and transition zones.
The boundaries of the zone run due north-south and east-west. Δϕ 2’, ie 3.7km, Δλ 3.2’, ie 4.5km.
Isobaths run along the coastline (West to South-East), with depths ranging 20 to 35 m. On the Northern part of the AZA the seabed consists of dead mattes of P. oceanica (approx. 20m), whilst intermediate depths are characterized by a mud and silt composition. The deeper ranges are composed of sand and mud.
Hydrodynamic forces guarantee optimal water circulation within the bay, as currents are seldom less than 10cm/sec, and with wind driven swell often occurring within the 1st, 2nd, and more predominantly 4th quadrant.
The AZA includes several fish farms and one mussel farm; on the northern side of the AZA but not included in this zone, there is another small mussel farm. Fish farms vary in size, physical characteristics, and administrative property. All companies are agriculture structured with a special taxation context.
Farm n. 1: total licensed area 2 million m2, average depth 25 mt. Three grids with a total of 24 cages, diameter 22/28 mt.
Farm n. 2 plus n. 2 new: total licensed area 1 plus 1 million m2 (2 mil) average depth 30 mt. Five grids with a total of 44 cages, diameter 16/25/32 mt.
Farm n. 3: total licensed area 0,55 million m2, average depth 35 mt. Two grids with a total of 20 cages, diameter 30 mt.
Farm n. 3 new: total licensed area 0,9 million m2, average depth 35 mt. Two grids with a total of 24 cages, diameter 30 mt.
Farm n. 4: total licensed area 0,55 million m2, average depth 25 mt. Three grids with a total of 30 cages, diameter 28 mt.
The mussel farm is 3,7 million m2 and started its production in 2019, however we do not have reliable data about the number of active lines and production output, due to its recent history. The administrative process Each concession license within the AZA can be classified and analyzed in terms of: distance from ports, bathymetry, interference with fishing and tourism related activities, as well as production potential. The first concession was established in 2009, totaling an area of 1 mil m2. At that time priority was given to the distance from the logistical headquarter rather than the physical characteristics of the area, which was overlapping with a region of Posidonia meadows at 20 mt depth. Beneath the first cages there were rare patches of Posidonia plants which soon disappeared during the following years. Nowadays, the bottom substrate is hard due to the old Posidonia roots, mixed with sand and mud. The second and third concession were established in 2013. These zones were allocated in deeper water, and avoided the eastern side of the first concession which had similar characteristics with both Posidonia and Cymodocea plants along with shallower depths. Following the criteria later outlined in the AZA guidelines (box 4-2 at pag. 86) the municipality decided to add a safety corridor 500 mt wide between the first and the second concessions, on the 27 mt isobath, and a corridor 300 mt wide between the second and third concession, on the 33 mt isobath. Soon after these decisions, the municipality released an expansion of concession n. 1 (n. 1 new) east of the original one, thus demonstrating that the new criteria applied for farm n. 2 and 3 were no longer valid for farm 1, even though this new zone was likely considered as a buffer area to be used for a limited production. In 2015, concession n. 3 was subleased to a third party, which soon after requested its own concession. Due to the high interest at the time, more companies began inquiring for concessions. As a result, the municipality decided to allocate a wider area for aquaculture toward the east side of the bay. In total, there were 4 additional requests for new concessions: the expansion of farm 2, a new concession for the leaser of farm 3, a new farm (n. 4) and a requested concession for mussel culture (3,7 mil m2). The final outline of the Follonica gulf AZA as seen today was decided following different criteria; compared to the previous. Safety corridor disappeared and the new concessions were close to each other. The mussel farm was positioned in deeper water while concession n. 4 was leased in the shallowest area of the AZA, close and eventually overlapping the cymodocea meadows. Production scenarios In order to try calculate the maximum allowable carrying capacity of the site (production carrying capacity) we used several criteria, applying different guidelines of countries with the same geographic area (Karakassis et al. 2013). The main models are based on the following parameters: leased area dimension, distance from the coast, depth and exposure rate to oceanographic events (waves, current and wind). Unlike many other Mediterranean countries, including Greece, Italian Authorities include the mooring system within the leased area, therefore every component of the fish farm, including anchors or concrete blocks, have to be located inside the concessions boundaries. In the present study, the cages area – or theoretical production area – has been obtained starting with the whole concession using the following formula: Hg=production area Since distance from the coast is greater than 1000 mt for all farms, and all of them lay inside the base line of the Follonica Gulf, this parameter has been considered null. Regarding the exposure rate, this parameter has been judged as a constant for the entire central area of the gulf, therefore for the whole AZA. The value for exposure is 0,58 on a range of 0 to 1 (minimum to maximum exposure rate). Maximum carrying capacity was then calculated using two different methods, obtaining similar results: With D=maximum carrying capacity Exposition rate/current assumed constant for all farms (F=0,58; exposed site) The following results were obtained: Concession N. 1 + 1 new (200 He, mean depth 25 mt) Maximum carrying capacity (method n. 1): 2922 ton (E=20; fa=1; fb=1; fk=1,75) Maximum carrying capacity (method n. 1a): 2188 ton (E=20; fa=1; fb=1; fk=1,31) Maximum carrying capacity (method n. 2): 3200 ton Actual biomass is 25% of maximum carrying capacity Forecasted production will be 30% Concession N. 2 + 2 new (200 He, mean depth 30 mt) Maximum carrying capacity (method n. 1): 3846 ton (E=26,6; fa=1; fb=1; fk=1,75) Maximum carrying capacity (method n. 1a): 3015 ton (E=26,6; fa=1; fb=1; fk=1,31) Maximum carrying capacity (method n. 2): 4000 ton Actual biomass is 50% of maximum carrying capacity Forecasted production will be 75% Concession N. 3 (55 He, mean depth 35 mt) Maximum carrying capacity (method n. 1): 1396 ton (E=9,1; fa=1; fb=1; fk=1,75) Maximum carrying capacity (method n. 1a): 1175 ton (E=9,1; fa=1; fb=1; fk=1,31) Maximum carrying capacity (method n. 2): 1320 ton Actual biomass is 65% of maximum carrying capacity Forecasted production will be 100% Concession N. 3 New (90 He, mean depth 35 mt) Maximum carrying capacity (method n. 1): 2222 ton (E=15; fa=1; fb=1; fk=1,75) Maximum carrying capacity (method n. 1a): 1854 ton (E=15; fa=1; fb=1; fk=1,31) Maximum carrying capacity (method n. 2): 2160 ton Actual biomass is 40% of maximum carrying capacity Forecasted production will be 70% Concession N. 4 (55 He, mean depth 25 mt) Maximum carrying capacity (method n. 1): 892 ton (E=5,5; fa=1; fb=1; fk=1,75) Maximum carrying capacity (method n. 1a): 632 ton (E=5,5; fa=1; fb=1; fk=1,31) Maximum carrying capacity (method n. 2): 880 ton Actual biomass is 110% of maximum carrying capacity Forecasted production will be 230% Note: cc=carrying capacity (tons). Maximum allowable carrying capacity for the whole farm cluster was calculated at 9.000 tons. It can be reasonably assumed that average standing stock and production have similar figures. Environmental monitoring plan Recently, the municipality of Piombino expressed the interest that a collective plan could be outlined in order to evaluate the cumulative effects of all farms in the AZA. The plan objective is to develop a monitoring scheme which identifies any alteration of target parameters (Environmental Quality Standards). The AZA has thus been subdivided in several AZE (Allowable Zones of Effect). According to the current guidelines, the sampling spots have been indicated for each AZE. The Environmental Monitoring Plan is mandatory for each concession. In the text of each license, the Municipality of Piombino has outlined the general context of the plan, along with the required local environmental authority, i.e. ARPAT. Since 2009, each farm has established its own plan. Once a year these plans are submitted to ARPAT through the municipality offices for review. Before the ISPRA manual was published there was a general consensus on a method to identify sampling sites in each farm for both sediment and water. Additionally, general consensus on mean current direction in the Follonica gulf, was assessed assuming a surface flow along the coastline east/west and vice versa, although there were several deeper flows generating eddies and countercurrents in different area of the gulf to take into account (CIBM, pers. com.). In 2021, following the publication of the technical manual, a cumulative environmental plan has been adopted by the companies operating in the AZA as per requested by the municipality and a proposal is being prepared by an independent scientific consultant. The consultant has collected data from the past 10 years environmental reports published by companies which complied to the mandatory scheme, however some of these reports were either missing or not complete due to different production protocols and property transitions in some of the concessions. Additionally, data from previous years production as well as feed quantities distributed within the gulf were analyzed and clustered in order to obtain a cumulative effect of fish farming activities in the Follonica gulf. Following the technical manual schemes, the EMP will be conducted twice annually, in fall, when the average biomass is at its highest peak, following four months with maximum feed dispersal and in spring, when the average biomass is at its lowest, following four months with minimum feed dispersal. AZE were identified following (i) the bathymetric and type of sediment scheme and (ii) the different concession ownership in the AZA. It was impossible to compare shallow hard substrates with deeper softer ones, therefore the AZA was divided in 3 zones with 25 m, 30 m and 35 m depths as its boundaries. Whenever different companies run different concession in the same depth/sediment range, it has been hypothesized that they adopt different feeding and management protocols. This means they might have different outputs and therefore different AZE may occur. Blank stations have been chosen due east and west, although there might be interference with the mussel farm on the east and unique sediments on the west, especially on the shallower depths. The sampling scheme follows the technical guidelines as well as ASC certification protocol due to a slight difference between the two protocols especially in the sediment sampling distances from AZE center. The EMP was submitted recently with the possibility to be updated as soon as first results are analyzed and compared to previous reports. The latest issue coming up in the Follonica gulf is the central Government approved project of a FSRU (Floating Storage and Regassification Unit). The Unit will be moored in the port of Piombino for the next three years. DICCA, Universitu of Genova, has produced a report with different scenarios in order to investigate the potential impact of cold water and chlorine discharge from the ship. References
Area (He)
Cages
Diametre (mt)
Site depth (mt)
Net depth (mt)
Production 2021 (ton)
Production 2022 (ton)
Farm 1
200
25
22
24
10
550
650
Farm 2
100
24
25
30
10
900
1150
F 2 (new)
100
16
32
30
10
600
1100
Farm 3
55
20
30
35
10
800
1200
F 3 (new)
90
24
30
35
10
800
1400
Farm 4
55
30
28
22
15
750
1500
Total
600
142
4400
7000
The present study identifies the administrative process and technical decisions which have led to the current allocation and use of marine space within the bay.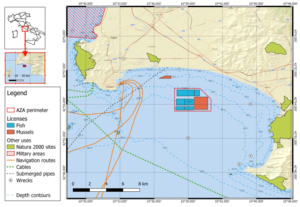
A comparison between actual and potential or desired production scenarios has been carried out to estimate and simulate the potential environmental impact and carrying capacity of the AZA.![]()
Where,
Ht=total concession area
P=mean depth
![]()
E=production area
Fa=distance to coast parameter
Fb=depth parameter
Mean depth 25 mt
80.000 fish/He
16ton/He
Mean depth 30 mt
100.000 fish/He
20ton/He
Mean depth 35 mt
120.000 fish/He
24ton/He
Concession
Area He
Depth mt
Max cc (1)
Max cc (1a)
Max cc (2)
Biomass (2022)
Actual biomass %
Forecasted production %
1+1new
200
25
2922
2188
3200
650
25
30
2+2new
200
30
3846
3015
4000
2250
50
75
3
55
35
1396
1175
1320
1200
65
100
3new
90
35
2222
1854
2160
1400
40
70
4
55
25
892
632
880
1500
110
230
total
600
11278
8864
11560
7000
60
Depending on the production output and site-specific parameters of each farm (depth, sediment composition, and hydrodynamic forces) an environmental monitoring scheme has been developed in correspondence with ISPRA, ARPAT, and ASC Guidelines.