Publication Information
ISSN 2691-8803
Frequency: Continuous
Format: PDF and HTML
Versions: Online (Open Access)
Year first Published: 2019
Language: English
| Journal Menu |
| Editorial Board |
| Reviewer Board |
| Articles |
| Open Access |
| Special Issue Proposals |
| Guidelines for Authors |
| Guidelines for Editors |
| Guidelines for Reviewers |
| Membership |
| Fee and Guidelines |
 |
COVID-19 Infection in Nepal: Epidemiological Analysis
Shambhavi Mishra1*, Sujan Marahatta2, Faith Boucher1
1Department of Public Health Sciences, University of California, Davis, USA
2Manmohan Memorial Institute of Health Sciences, Kathmandu, Nepal
Received Date: September 28, 2022; Accepted Date: October 06, 2022; Published Date: October 12, 2022;
*Corresponding author: Shambhavi Mishra. Department of Public Health Sciences, University of California, Davis, USA. Email: simishra@ucdavis.edu
Citation: Mishra S, Marahatta S, Boucher F (2022) COVID-19 Infection in Nepal: Epidemiological Analysis. Adv Pub Health Com Trop Med: APCTM-164.
DOI: 10.37722/APHCTM.2022502
Abstract
Nepal saw its first COVID-19 case on January 23, 2020. Since then, Nepal has suffered from three waves of COVID-19. The goal of this paper is to conduct an epidemiological analysis of COVID-19 in Nepal and compare the changes in morbidity and mortality of COVID-19 over the course of two periods. The first period is defined as April 1, 2020- March 31, 2021. The second period is defined as April 1, 2021- March 31, 2022. Relevant variables were collected from Daily Situation Reports provided by the Ministry of Health and Population of Nepal. The main findings were the number of COVID-19 cases and deaths due to COVID-19 were higher in Period 2 in comparison to Period 1. Period 2 had a higher average recovery rate in comparison to Period 1. Majority of cases during both periods were male and in the 21-40 age category. The distribution of cases was more even amongst males and females in Period 2 in comparison to Period 1. Most cases reported during both periods were from Bagmati Province, which also had the most RT-PCR testing centers during both time periods. In terms of preventative measures, Period 2 had vaccination data reporting and a greater number of tests conducted in comparison to Period 1. Compared to the world, Nepal contributes a low mortality burden due to COVID-19. In addition, most Nepalese are vaccinated against COVID-19 (63.4%), which is comparable to India (62.50%) and the world (67.1%). The results from this study can be used to better implement prevention strategies in Nepal for future outbreaks.
Introduction
Like many countries in the world, Nepal faced difficulties due to COVID-19 and is still suffering from its aftermath. Nepal saw its first COVID-19 case on January 23, 2020 [1]. Since then, Nepal has suffered from three waves of COVID-19. The first wave occurred from mid-October 2020 to mid-November 2020 [2]. The Second Wave occurred from May 1, 2021 to June 28, 2021 and involved the Delta Variant [3]. The Third Wave occurred from January 2022 to February 2022 and involved the Omicron Variant. On January 27, 2021, almost a year after their first case, Nepal started implementing vaccinations with the help of 1 million doses of Oxford-AstraZeneca donated from India [4]. Since then, Nepal has continued to provide free vaccinations to its citizens.
Nepal’s success in mitigating the effects of COVID-19, despite being a low-income country with limited resources and a diverse population, is attributed to their strong political will, change in policies, priority setting, and three-tiered government system [4]. Nepal’s government follows a federalist governing system, which they adopted in 2015 to address the diversity within the country and to transfer power to the local level and allocate resources for development [5]. There are three levels of government: federal, provincial, and local governments [5]. In response to the pandemic, on March 1, 2020, the government created the High-Level Coordination Committee to prevent and control COVID-19 through lockdown management and resource allocation [6], In addition, to keep information regarding COVID-19 in Nepal consistent, the Ministry of Health and Population (MOHP) has issued press briefs and daily situation briefs [6]. Information has been spread to the public regarding the effects of the pandemic through phone, caller tune services, and flyers throughout the country in efforts to mitigate the spread of the disease [1].
The intention of this project is to provide numerical values to the burden of COVID-19 in Nepal. The data is divided into two time periods: April 1, 2020 to March 31, 2021 and April 1, 2021 to March 31, 2022. The goal is to understand the factors that impacted the morbidity and mortality due to COVID-19 between the two time periods and the demographics of people who were most impacted. The findings from this paper can help in better informing policy and flow of resources in Nepal to better handle future outbreaks.
Methods
The MOHP has published Daily Situation Reports regarding updates about COVID-19 in Nepal. In this study, the Daily Situation Reports from April 1, 2020 to March 31, 2022 were downloaded from the MOHP website for analysis. April 1, 2020 was chosen as the beginning date. The Situation Reports were cross-referenced with the Worldometer, which provides statistics about COVID-19 worldwide, for accuracy. Data collected included number of tests performed, total number of positive cases, deaths, and vaccination status. The data was split between two time periods for comparison. The first period was data from April 1, 2020 to March 31, 2021. The second period was data from April 1, 2021 to March 31, 2022.
The variables of interest were collected from the Daily Situation Reports. Total positive cases were cumulative COVID-19 cases. Daily cases were new cases over the past 24 hours. Total COVID-19 related deaths were the cumulative COVID-19 related mortality cases. Daily COVID-19 related deaths were new deaths over the past 24 hours. Total tests performed included the number of antigen and RT-PCR tests. The recovery rate refers to those who tested positive for COVID-19 and recovered with no symptoms. Total vaccinations include the number of people who were provided the first, second, and additional dose of vaccinations. The case fatality rate refers to the percentage of people who tested positive for COVID-19 and passed.
Results
Number of Cases
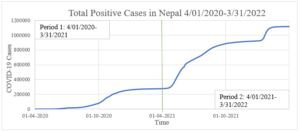
Figure 1A: Total Positive Cases: Period 1 had 277,304 cases, and Period 2 had 841,255 cases.
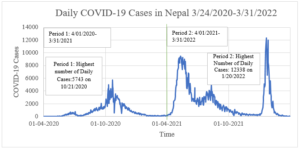
Figure 1B: Daily COVID-19 Cases: Period 1 had the highest number of daily cases of 5743 on October 21, 2020, which corresponds to the first wave. Period 2 had the highest number of daily cases of 12,338 on January 20, 2022, which corresponds to the third wave or the Omicron variant.
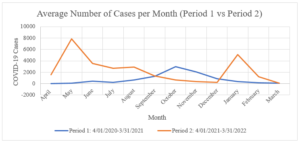
Figure 1C: Average Number of Cases per Month: The largest difference in average cases per month between the time periods was between May 2020 of Period 1 and May 2021 of Period 2. Period 2 most likely saw this increase because of the Delta variant during Wave 2. Another large difference in the number of cases per month was between January 2021 of Period 1 and January 2022 of Period 2. Period 2 probably saw a larger number of cases during this time because of the Omicron variant.
Recovery Rate
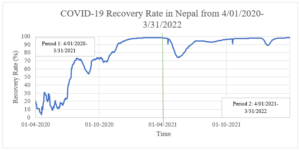
Figure 2A: COVID-19 Recovery Rate: The average recovery rate in Period 1 was 65.65%. The average recovery rate in Period 2 was 93.69%.
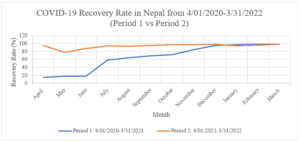
Figure 2B: COVID-19 Recovery Rate Month by Month Comparison between Period 1 and Period 2: The recovery rate was higher in Period 2 in comparison to Period 1 except for January-March 2022 of Period 2 in comparison to January-March 2021 of Period 1. This is most likely due to the Omicron variant corresponding to the Third Wave during Period 2.
Case Fatality
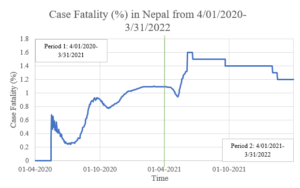
Figure 3: Case Fatality: The average case fatality during Period 1 was 0.69%. The average case fatality during Period 2 was 1.35%. The highest case fatality during Period 1 was 1.10% on March 1, 2021. The highest case fatality during Period 2 was 1.6% from June 5, 2021-June 19, 2021, which corresponds to the Second Wave or the Delta Variant.
Number of Deaths
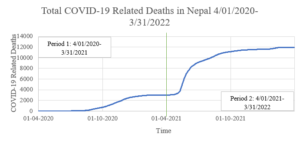
Figure 4A: Total COVID-19 Related Deaths: The total number of deaths due to COVID-19 in the first period was 3,030. The total number of deaths due to COVID-19 in the second period was 8,291, which is about a 94% increase in the number of deaths between the two periods. The total number of deaths due to COVID-19 during the two periods was 11,951.
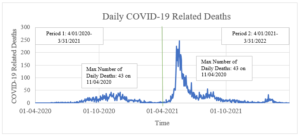
Figure 4B: Daily COVID-19 Related Deaths: Period 2 had a general increase in the average number of daily deaths in comparison to Period 1. The average number of daily deaths in Period 1 was 8.3 deaths. The average number of daily deaths in Period 2 was 24.5 deaths. The highest number of daily deaths in Period 1 occurred on November 4, 2020 with 43 deaths, which corresponds to the first wave. The highest number of daily deaths in Period 2 occurred on May 19, 2021 with 246 deaths, which corresponds to the Second Wave or Delta variant.
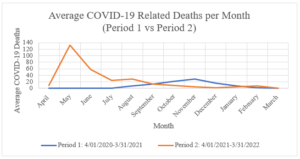
Figure 4C: The largest difference in average deaths per month was between May 2020 of Period 1 and May 2021 of Period 2 which corresponds to the Second Wave or Delta variant during Period 2.
Prevention
Total Tests
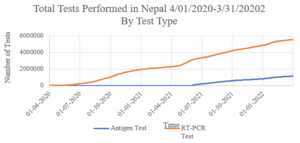
Figure 5A: Total Number of Tests Performed: The total number of tests performed in Period 1 was 2,270,182. The total number of tests performed in Period 2 was 4,401,976. The total number of tests performed during both periods was 6,672,158. Period 1 records included only RT-PCR tests, whereas Period 2 records included both RT-PCR and antigen tests starting from June 5, 2021.
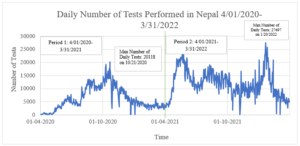
Figure 5B: Daily Number of Tests Performed: The average number of daily tests conducted in Period 1 was 6,154 tests. The average number of daily tests conducted in Period 2 was 11,998 tests. The highest number of daily tests conducted in Period 1 occurred on October 21, 2020 with 20,118 tests which corresponds to the First Wave. The highest number of daily tests conducted in Period 2 occurred on January 20, 2022 with 27,497 tests which corresponds to the Third Wave or Omicron Variant.
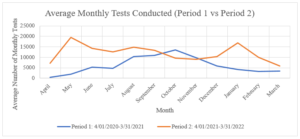
Figure 5C: Average Monthly Tests Conducted Month by Month Comparison between Period 1 and Period 2: This figure shows the differences in the average number of tests conducted per month during each time period. The largest difference in average number of tests conducted per month was between May 2020 of Period 1 and May 2021 of Period 2. This is most likely due to the Second Wave or Delta Variant during Period 2. The second largest difference in number of tests conducted was between January 2021 of Period 1 and January 2022 of Period 2. January 2022 of Period 2 most likely had an increase in number of tests due to the Third Wave or Omicron Variant.
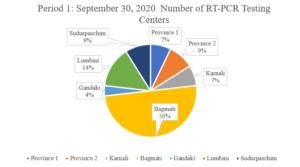
Figure 5D: Pie chart of number of RT-PCR Testing Centers Midway in Period 1 (September 30, 2020).
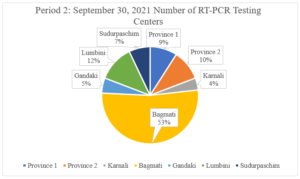
Figure 5E: Pie chart of number of RT-PCR Testing Centers Midway in Period 2 (September 30, 2021).
Figures 5D and 5E show the relative percentages of RT-PCR testing centers in each province during the midpoint of each time period (September 30). Period 1 had a total of 56 RT-PCR testing centers, whereas Period 2 had 99 RT-PCR testing centers, which is around a 77% increase in number of RT-PCR testing centers between Period 1 and Period 2 in Nepal. This may account for the increase in number of tests being conducted in Period 2 in comparison to Period 1 as seen in Figures 5A-5C. In addition, Bagmati Province had majority of RT-PCR testing centers in Nepal during both time periods with 50% in Period 1 and 53% in Period 2.
Vaccination
Figures 6A, 6B, and 6C show the number of people vaccinated with each dose of COVID-19. The vaccines that are accounted for in the data are VeroCell, COVISHIELD, AstraZeneca from Japan, AstraZeneca from Sweden, Moderna, Pfizer, and Johnson & Johnson. Vaccination data in the reports started being available on June 5, 2021. As of March 31, 2022, 18,762,727 had the first dose, 19,085,632 had the second dose, and 2,159,502 had an additional dose. The number of vaccinations has been increasing since reporting started.
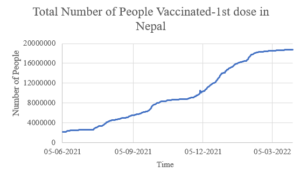
Figure 6A: Total number of vaccinations first dose.
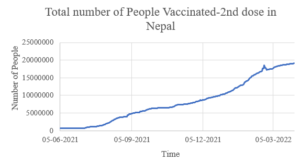
Figure 6B: Total number of vaccinations second dose.
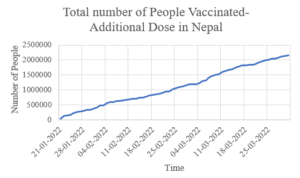
Figure 6C: Total number vaccinations additional dose.
Demographics
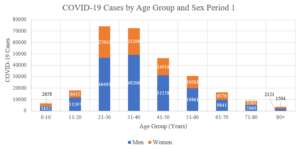
Figure 7A: Period 1: COVID-19 Cases by Age Group and Sex: Men made up majority of cases in Period 1 with 64.89% of cases. Women made up 35.11% of cases in Period 1.
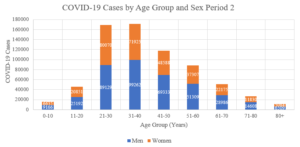
Figure 7B: Period 2: COVID-19 Cases by Age Group and Sex: Men continued to make up majority of cases in Period 2 with 56.38% of cases. Women made up 43.62% of cases in Period 2.
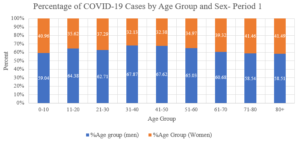
Figure 7C: Period 1: Percentage of COVID-19 Cases by Age Group and Sex.
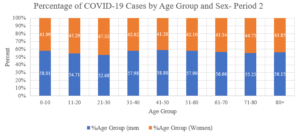
Figure 7D: Period 2: Percentage of COVID-19 Cases by Age Group and Sex.
During both Periods 1 and 2, the highest number of cases were in the 21-30 and 31-40 age groups. But, in Period 2, there seemed to be a more even distribution of cases in both males and females amongst the age groups as seen in Figures 7C and 7D.
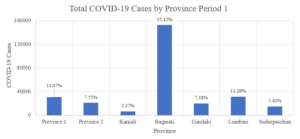
Figure 7E: Period 1: Total COVID-19 Cases by Province: Bagmati Province had the highest proportion of cases during Period 1 with 55.12% of cases in Nepal.
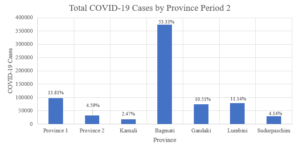
Figure 7F: Period 2: Total COVID-19 Cases by Province: Bagmati Province had the highest proportion of cases during Period 2 with 53.33% of cases in Nepal.
Discussion
The main findings from this paper were the number of COVID-19 cases and deaths were higher in Period 2 in comparison to Period 1. Period 2 had a higher average recovery rate in comparison to Period 1. In terms of preventative measures, Period 2 had vaccination data reporting and a greater number of tests being conducted in comparison to Period 1. Majority of the cases during both periods were male and in the 21-40 age category. The distribution of cases was more even amongst males and females in Period 2 in comparison to Period 1. Most cases reported during both periods were from Bagmati Province.
The infection rate, which is defined as the proportion of people who tested positive to the population at risk, was higher in Period 2 in comparison to Period 1. The infection rate in Period 1 was calculated to be 915 cases per 100,000 by a previous study [7]. The infection rate in Period 2 was higher and calculated to be 2,795 cases per 100,000, with the population at risk being 30,096,878 [8]. This is most likely due to Period 2 having the Second and Third Waves which correspond to the Delta and Omicron variants respectively
Possible reasons for Period 2 having higher number of COVID-19 cases and deaths in comparison to Period 1 is that Period 2 had more testing centers in addition to having the Second and Third Waves of COVID-19 in comparison to the First Wave in Period 1. But, Period 2 had a higher average recovery rate in comparison to Period 1, which could be due to vaccination implementation during Period 2.
In addition to the data presented comparing the two time periods, it is also important to understand Nepal in a global context. The total number of deaths in Nepal during both time periods of this study was 11,951. The population of Nepal at the end of the second time period in this study was 30,096,878 [8]. The total number of deaths in the comparable country of India during both time periods of this study was 522,432 [9]. The population of India at the end of the second time period in this study was 1,404,865,590 [10]. The total number of deaths due to COVID-19 worldwide during both time periods of this study was 6,114,917 [11]. Nepal and India both had similar mortality rates due to COVID-19 in relation to their total population. In addition, Nepal accounts for 0.37% [8] of the world’s population yet contributed to only 0.19% of the worldwide deaths due to COVID-19. This difference may be because the median age of the Nepalese is around 24.6 years [8], which is relatively young and thus people are more likely to recover from COVID-19. In addition, as seen in Figure 3A and Figure 3B, Nepal had a low case fatality between the two time periods ranging from 0.2%-1.6%. It may seem that Nepal has low mortality due to COVID-19 but underreporting of deaths may have occurred. Furthermore, Nepal’s low mortality due to COVID-19 in comparison to the world can be due to early vaccination efforts made by the government. Fully vaccinated is defined as having two doses of the COVID-19 vaccine [12]. Based on this, Nepal has around 63.4% of its citizens vaccinated by the end of the second period in this study [8]. In comparison, India has around 62.50% of its citizens vaccinated by the end of the second period in this study [12]. Worldwide, around 67.1% are vaccinated by the end of the second period in this study [13]. Therefore, Nepal is comparable to its neighboring, similar country of India and the world in terms of vaccination against COVID-19.
The results from this project can help in understanding the progression of COVID-19 in Nepal in the past two years. It can be used in conjunction with an analysis on policy to better understand how different policies and preventative measures have impacted the burden of COVID-19 in Nepal. In addition, the results from this study can be used to better implement prevention strategies in Nepal. Efforts can be targeted towards the 21-40 age group and Nepalese men to be tested for COVID-19 and implement appropriate preventative measures consistently. This can help in mitigating the spread of COVID-19 to others.
A limitation of this paper is that because the data was taken from Daily Situation Reports provided by the government, there is the possibility of reporting bias. There could have been underreporting of the number of cases and deaths. Majority of the testing centers in Nepal are in Bagmati Province, which is also where most of the cases were found. It is possible that other provinces had more COVID-19 cases, but due to lack of testing centers nearby many cases were not being reported in the Daily Situation Reports. In addition, deaths that were reported in the Daily Situation Reports were reported by the military. There could have been deaths due to COVID-19 in many homes and in other remote areas that the military did not record, leading to underreporting. Therefore, to decrease reporting bias, it is suggested that testing centers increase in provinces based on the population of provinces. To increase the accuracy of reporting of deaths in Nepal, it is recommended that local governments implement strategies to report deaths in their jurisdiction to the provincial level instead of to the military.
References
- Ministry of Health and Population. Kathmandu: Ministry of Health and Population; 2021.
- Dhimal M, Aryal K, Pandey AR. Traversing Nepal's COVID Peaks and Valleys: Think Global Health. Council on Foreign Relations.
- Joshi P (2021). Lessons from the Second Wave: Reference for Averting the Third Wave. The Himalayan Times.
- Bhattarai S, Dhungana J (2021). A Million-Dose Success for Nepal: Insights from Nepal’s National Vaccine Deployment Plan against COVID-19. Journal of Travel Medicine. 28(4).
- Federalism in Nepal: A Country in Transition. International Alert (2021).
- Rayamajhee B, Pokhrel A, Syangtan G, et al. (2021) How Well the Government of Nepal is Responding to Covid-19? An Experience from a Resource-Limited Country to Confront Unprecedented Pandemic. Frontiers in Public Health. 9.
- Le H, Shen T, Marahatta S, Boucher F (2021). Covid-19 Infection in Nepal: Epidemiological Analysis from April 2020 to March 2021. Advances in Public Health, Community and Tropical Medicine.
- Nepal Population. Worldometer. Accessed May 14, 2022.
- Worldometer. Accessed May 14, 2022.
- India Population. Worldometer. Accessed May 14, 2022.
- Coronavirus Worldwide Graphs. Worldometer. Accessed May 14, 2022.
- Understanding Vaccination Progress by Country. Johns Hopkins Coronavirus Resource Center. Accessed May 14, 2022.
- Holder J. Tracking Coronavirus Vaccinations Around the World. The New York Times. Accessed May 14, 2022.