| Journal Menu |
| Editorial Board |
| Reviewer Board |
| Articles |
| Open Access |
| Special Issue Proposals |
| Guidelines for Authors |
| Guidelines for Editors |
| Guidelines for Reviewers |
| Membership |
| Fee and Guidelines |
 |
The Adoption of Cybersecurity: An Analysis of Maldivian Internet Users’ Behaviour Using the Health Belief Model
Ahmed Naufal Abdul Hadee*
Received Date: July 04, 2022; Accepted Date: July 08, 2022; Published Date: July 14, 2022;
*Corresponding author: Ahmed Naufal Abdul Hadee, Mobile: +9607969256 Email: Ahmednawfal@hotmail.com
Citation: Hadee A N A, (2022) The Adoption of Cybersecurity: An Analysis of Maldivian Internet Users’ Behaviour Using the Health Belief Model. Enviro Sci Poll Res And Mang: ESPRM-124.
DOI: 10.37722/ESPRAM.2022203
Abstract
Cybersecurity has been one of the most pressing issues of our time yet there is a shortage of research in this domain. Research indicates that this is an evolving field that needs maturity and the human aspects of cybersecurity is one of the most important aspects of the domain as many authors have identified the human factor to be among the weakest link in this domain. The Maldives is a developing country that has a high internet penetration rate, however, there lack research that focuses on cybersecurity, especially understanding internet users’ cybersecurity behaviour. This research is one of the first to focus on the human aspect of cybersecurity within the Maldivian context. A quantitative cross-sectional survey design has been used to collect 206 responses using a systematic random sampling technique. The health belief model has been used to test 26 hypothesize relationships to understand the adoption of cybersecurity of individual internet users of the Maldives. A multiple hierarchical regression analysis has been conducted using IBM’s SPSS version 26 to test the relationships and the results show that internet users’ perceived severity of cyber-threats, their cybersecurity self-efficacy and their prior experience of cyber-threats, are strong indicators of their adoption of cybersecurity behaviour. Hence this study has provided an original contribution to the body of knowledge by targeting internet users of the Maldives to explore their cybersecurity behaviour utilizing HBM.
Introduction
Cybersecurity plays a major role in the economic stability of the World (Schneier, 2000) because cyberattacks represent one of the most destabilizing global effects on human lives today (Sawyer & Hancock, 2018). With the ever-increasing number of people using all sorts of devices to connect to the internet, the security threats of cyberspace have grown exponentially. As Schneier (2000) says that employing sophisticated encryption techniques alone cannot safeguard against cyber threats, people must adopt security practices because people are the weakest link in cyberspace and the threat of this weakest link is not only to the technology sector or finance sector, it is even severe for the health sector and if cybersecurity is not made a priority issue, the promise of improved care from a digital world will be broken and patients could be placed at grave danger (Jarrett, 2017).
Background
The Maldives is comprised of 26 atolls made up of 1190 islands out of which 188 are inhabited. Over 80% of the islands are one meter above sea level. The population of Maldives is 338,434 and is spread across 115 square miles. Most of the economic activities are centred on Male’, which is the capital city of the Maldives. Therefore, people tend to migrate to Male’ for better opportunities, making Male’ one of the most densely populated cities in the world. Significant growth has been made to meet the Millennium Development Goals and now is currently working towards the Sustainable Development Goals (UNDP, 2018).
The Internet plays a major role in the Maldives, some colleges run fully online distance classes which require real-time access (MandhuCollege, 2016). With a population of little over 338,400 people, there are more than 270,000 mobile broadband subscribers in the country (CAM, 2018). According to internetworldstats.com (2018), 76.5% of the Maldives’ population has internet access and as of the year 2017, 72.0% of the population uses Facebook. However, there lack research that focuses on cybersecurity, especially understanding internet users’ cybersecurity behaviour.
Research Questions
The following questions address the research problem:
- To what extent do the Maldivian internet users’ perceptions of vulnerability, severity, benefits, barriers, self-efficacy, cues to action and cybersecurity usage affect their intention to practice cybersecurity behaviours?
- To what extent do the Maldivian internet users’ age, gender, educational qualification, and prior cyber-threat experience moderate their perceptions of vulnerability, severity, benefits, barriers, and self-efficacy on cybersecurity usage?
Literature review
There exists a lack of clarity when it comes to defining cybersecurity (Schatz et al., 2017). Many authors have defined information security as inclusive of cybersecurity and some argue that cybersecurity is anonymous to information security (von Solms & van Niekerk, 2013). Some authors have highlighted that defining cybersecurity is a difficult task as there is no consistency in defining the term in the literature (Maskun et al., 2013). Despite the differences among scholars, most of the authors agree that cybersecurity is more concentrated on people and defending people against the threats of cyberspace is fundamental to addressing security threats related to cyberspace or the internet (Fischer, 2009; Hamburg & Grosch, 2017; Maskun et al., 2013; Schatz et al., 2017; Schneier, 2000; von Solms & van Niekerk, 2013).
Human aspects of cybersecurity research
Cybersecurity is a critical, cross-functional issue that affects everyone and every organization, directly and indirectly (Parent & Cusack, 2016), and it is one of the greatest issues of our time and even though people are the key (Hall, 2016) human aspects of cybersecurity remains less understood (Addae et al., 2016), despite the fact, there is still a lack of interest observed about human aspects of cybersecurity research (Hughes-Lartey et al., 2021; Rahman et al., 2021). Research indicates that 95% of all cyber incidents are human-enabled hence human factors need to be accounted for when dealing with cyber threats (Nobles, 2018). Hence it can be stated that everyone who uses the internet should have cybersecurity skills as a vital life skill (Duić et al., 2017; Reid & Van Niekerk, 2014) up to the point it becomes an unconscious action to practice secure behaviour (Reid & Van Niekerk, 2014).
Moreover, some authors considered cybersecurity as an evolving field in the areas of human-computer interaction, with special emphasis on human factors (Duffy & Duffy, 2020). This adds more complexity to the understanding of this evolving domain; thus, cybersecurity has been considered a complicated and diverse subject (Smith, 2017). Due to the interwoven and interdisciplinary nature of the subject, there are always varying viewpoints on the subject domain, and in this regard, Carely (2020) has discussed social cybersecurity as an emerging field to address cyber-mediated changes in human behaviour and social, cultural, and political outcomes (Carley, 2020).
Common cyber threats to individual internet users
This study focuses on the common threats of cybersecurity to an individual internet user. In this regard, three major areas have been focused known as social engineering, phishing and Malware. Authors have identified several techniques used by cybercriminals for targeting individuals, among them the most used techniques are considered to be social engineering attacks (Salahdine & Kaabouch, 2019). According to Salahdine and Kaabouch (2019) phishing, baiting, pretexting, tailgating, ransomware, impersonation on the help desk, dumpster diving, shoulder surfing, pop-up windows, robocalls, online scams, fake software attacks, pharming and SMS-scams can all be categorized under social engineering attacks, however, this definition of social engineering even though beneficial at times to understand the importance of its role in cybercrime seems too broad, because many different sub-groups categorized here, have been categorized as its sub-groups which do not fall under social engineering by many authors (Salahdine & Kaabouch, 2019; Uma & Padmavathi, 2013). According to Gupta et al. (2016), phishing is a type of social engineering attack that has many different categories and is a very successful method that exploits the weaknesses found in human beings’ reliance on trusting each other. Phishing is a social engineering attack technique that exploits some aspects of a system by targeting users (Khonji et al., 2013), and some phishing attacks can fool even the most sophisticated users (Dhamija et al., 2006) and could be considered the most pressing cyber threat in our time to all internet users regardless of their level of technical expertise (Alkhalil et al., 2021).
Malware is defined as any form of malicious code (Idika & Mathur, 2007), most distinguish categories of them are internet worms, computer viruses and trojan horses (Rieck et al., 2008). A computer virus is a malicious code that replicates itself by inserting it into other programs whereas, a worm is a malicious code that replicates itself without the need for any host, and the trojan horse is code that hides inside other legitimate software or files (Idika & Mathur, 2007).
Cybersecurity Behaviour
There exist various studies conducted to identify users’ security behaviour. Among those most of the studies are focused on users’ security behaviour in an organizational setting (Chandarman & van Niekerk, 2017). Very few studies such as that of Claar (2011) has targeted on security behaviour of non-organizational setting such as home computer users. The studies which have targeted users’ cybersecurity behaviour have also been focused on some aspects of cybersecurity such as the use of emails (Ng et al., 2009) password usage, anti-virus, anti-malware software usage or firewall usage or piracy software usage or browser usage (Chandarman & van Niekerk, 2017). Except for Muniandy, et al (2017) there lacks studies that are focused comprehensively on users’ cybersecurity behaviour by taking various domains of cybersecurity together, the reason for this also could be that cybersecurity is a complex topic and it could take years of research before it will become a matured discipline distinguished from information security (Couce-Vieira et al., 2020).
As individual internet users are the weakest link in cybersecurity (De Kimpe et al., 2021), studies have shown that while technology has a role in reducing the impact of cybersecurity issues, human behaviour is the main area that needs to be improved to safeguard against such threats (Conteh & Schmick, 2016) and taking aggressive actions in exploring behaviour based risks is vital (Nobles, 2018) this is because cybersecurity awareness significantly impacts one’s cybersecurity practice (Muhirwe & White, 2016) and understanding internet users’ behaviour leads understanding how an intervention could be planned to increase the awareness.
Authors Pollini et al (2021) argued that usually computer and information security is approached by adopting a technology-centric viewpoint, in which human components of sociotechnical systems are generally considered as their weakest part.
Health belief model and cybersecurity bahaviour
The Health Belief Model (HBM) is one of the most widely recognized and tested models in literature rooted in the healthcare domain (Ng et al., 2009). The HBM was created by Rosenstock in the 1950s to predict the behaviours of individuals related to their personal health activities (Rosenstock, 1974). The HBM argues that the belief in a threat, combined with the belief in the effectiveness of protective behaviour, predicts the likelihood of adopting that behaviour (Geil et al., 2018).
The first version of the HBM included perceived susceptibility, perceived severity, perceived benefits, and perceived barriers. Perceived susceptibility and perceived severity combined form perceived threat. Perceived threat combined with perceived benefits versus perceived barriers determines the likelihood of taking a recommended behavioural action (Rosenstock, 1974). The original model did not have a cue to action and the option to add modifying factors, however, it was added later by Rosenstock (1966) with a cue to action construct to increase the model’s ability to measure health-related behaviours. Even though HBM was initially developed in response to the failure of a tuberculosis health screening program, the researchers wanted to understand the factors that influence individuals’ choices to reject the screening and was later updated by the original authors to include Self-efficacy constructs as well (Rosenstock et al., 1988).
Literature shows that the first use of HBM in an information security behaviour setting was done by Ng & Xu (2007) in their conference paper and was later published as a full research paper in the journal of decision support systems (Ng et al., 2009). The second study to adopt HBM in a security behaviour setting was done by Claar (2011) in the author’s PhD research. Claar’s (2011) study used HBM to analyse home computer users’ security behaviour. This is one of the significant security behaviour studies done in a non-organizational setting focusing mainly on home computer users. Another similar study in this regard is the experiment conducted by Davinson and Sillence (2010) which, unlike Ng, et al (2009) and Claar (2011) uses an adapted version of HBM to understand user security behaviours. Some authors also have used the core constructs of HBM with additional moderating factors to understand user security behaviour in a Bayesian network analysis approach, they have investigated the problem of personalizing security risk analysis and matching home computer security to each user’s needs, as they believed that the vast majority of security threats to the home computer is coming from routine computer activities such as checking emails, web browsing and filling out online forms and it can be associated with many users not being able to fully understand how their activities impact security (Urbanska et al., 2013).
Similar to Claar (2011), Williams, et al (2014) conducted a study that employed HBM but without the moderating construct which explored some aspects of information security behaviour in another study authors have used an extended HBM framework to study users’ compliance behaviour towards information security policies of health information systems (Humaidi et al., 2014). Later on, Schymik and Du (2018) conducted a study that used both Ng, et al (2009) and Claar (2011)’s survey constructs to understand the email security behaviour of undergraduate students of a large campus using HBM as their research model. To the author’s knowledge, the only study that used HBM specifically to understand cybersecurity behaviour was conducted by Geil , et al (2018) and this study employed the core survey construct created by Claar (2011). According to Geil, et al (2018) most cybersecurity research has focused on the information technology (IT) industry or IT technical users hence, their study was focused on the agriculture industry to address the research gap identified by them. Thus, it is evident that the use of HBM in understanding internet users’ cybersecurity behaviour is an area that needs more exploration and there exists a significant research gap in this regard.
HBM based conceptual framework used for the current study
The research design is based on cross-sectional data collection by utilizing the conceptual framework of the HBM as indicated in Figure 1.
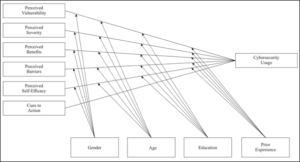
Figure 1: HBM based Conceptual Model (Geil , et al., 2018; Claar, 2011).
Research hypotheses
The following hypotheses were tested in this study. These are derived from the conceptual framework presented in Figure 1.
Perceived Vulnerability (PVL)
When individuals believe that their internet usage device (computer, tablet, or smartphone) is likely to be a victim of a security incident, they are more likely to implement a security technology to prevent it. As such, the following hypothesis was established.
H1: perceived susceptibility to cybersecurity incidents is positively related to cybersecurity usage.
The null hypothesis, H10: perceived susceptibility to cybersecurity incidents is not related to cybersecurity usage.
Perceived severity (PSV)
The perceived severity construct is the individual’s belief that if a cybersecurity incident were to occur, the event would have a negative effect on his/her lifestyle and financial health, and would disrupt their internet activities.
H2: perceived severity of cybersecurity incidents is positively related to cybersecurity usage.
The null hypothesis, H20: perceived severity of cybersecurity incidents is not related to cybersecurity usage.
Perceived benefits (PBN)
In the HBM, perceived benefits referred to an individual’s perceptions of the effectiveness of an action like using cybersecurity tools such as firewall and malware protection. The following hypothesis follows:
H3: perceived benefits of cybersecurity technology are positively related to cybersecurity usage.
The null hypothesis, H30: perceived benefits of cybersecurity technology are not related to cybersecurity usage.
Perceived barriers (PBR)
If an individual might feel action is beneficial in reducing a threat, certain easing activities might be unpleasant, too costly, or inconvenient to implement. Computer or cybersecurity software often inconveniences the users, causes difficulty in completing tasks and obstructs productivity while trying to secure a system. The following hypothesis follows:
H4: perceived barriers to implementing cybersecurity technology are negatively related to cybersecurity usage.
The null hypothesis, H40: perceived barriers to implementing cybersecurity technology are not related to cybersecurity usage.
Self-Efficacy (SEF)
Self-efficacy refers to the individual’s belief in his/her ability to perform an action (Claar, 2011). Individuals with greater confidence in their ability to perform an action are more likely to initiate and engage in that action (Geil et al., 2018). Cybersecurity self-efficacy refers to the individual’s ability to select, install, configure, and operate security technology, such as secure browsers, encryption software or encrypted transmission, anti-virus, anti-spyware, and network firewalls on his/her computer or internet-connected device. As such, the following hypothesis follows:
H5: cybersecurity self-efficacy is positively related to cybersecurity usage.
The null hypothesis, H50: cybersecurity self-efficacy is not related to cybersecurity usage.
Cue to action (CUA)
For example, an individual might be more likely to install anti-virus software if he/she sees news reports about computer malware spreading across the internet, just like individuals might also be more likely to engage in a preventive activity if their peers, neighbours, or other affiliates are affected by a disease (Geil et al., 2018). As such, the following hypothesis follows:
H6: cues to action are positively related to cybersecurity usage.
The null hypothesis, H60: cues to action are not related to cybersecurity usage.
Moderator constructs
Previous research indicates that higher levels of education and age have shown a positive relationship with cybersecurity and higher educational level and younger internet users are more likely to answer cybersecurity questions correctly (Smith, 2017). In addition to that, another study has also concluded that gender also has been shown to have some impact on cybersecurity practices thus needing further studies to check the relationship better (Anwar et al., 2017). Hence, the moderating effects of age, gender, education, and prior experience will be examined as follows:
Age (AGE)
H7a: age significantly moderates the relationship between Perceived Vulnerability and cybersecurity usage.
The null hypothesis, H7a0: age does not moderate the relationship between Perceived Vulnerability and cybersecurity usage.
H7b: age significantly moderates the relationship between Perceived Severity and cybersecurity usage.
The null hypothesis, H7b0: age does not moderate the relationship between Perceived Severity and cybersecurity usage.
H7c: age significantly moderates the relationship between Perceived Benefits and cybersecurity usage.
The null hypothesis, H7c0: age does not moderate the relationship between Perceived Benefits and cybersecurity usage.
H7d: age significantly moderates the relationship between Perceived Barriers and cybersecurity usage.
The null hypothesis, H7d0: age does not moderate the relationship between Perceived Barriers and cybersecurity usage.
H7e: age significantly moderates the relationship between Cybersecurity Self-efficacy and cybersecurity usage.
The null hypothesis, H7e0: age does not moderate the relationship between Cybersecurity Self-efficacy and cybersecurity usage.
Gender (GEN)
H8a: gender significantly moderates the relationship between Perceived Vulnerability and cybersecurity usage.
The null hypothesis, H8a0: gender does not moderate the relationship between Perceived Susceptibility and cybersecurity usage.
H8b: gender significantly moderates the relationship between Perceived Severity and cybersecurity usage.
The null hypothesis, H8b0: gender does not moderate the relationship between Perceived Severity and cybersecurity usage.
H8c: gender significantly moderates the relationship between Perceived Benefits and cybersecurity usage.
The null hypothesis, H8c0: gender does not moderate the relationship between Perceived Benefits and cybersecurity usage.
H8d: gender significantly moderates the relationship between Perceived Barriers and Cybersecurity usage.
The null hypothesis, H8d0: gender does not moderate the relationship between Perceived Barriers and Cybersecurity usage.
H8e: gender significantly moderates the relationship between Cybersecurity Self-efficacy and Cybersecurity usage.
The null hypothesis, H8e0: gender does not moderate the relationship between Cybersecurity Self-efficacy and Cybersecurity usage.
Education (EDU)
H9a: education significantly moderates the relationship between Perceived Vulnerability and cybersecurity usage.
The null hypothesis, H9a0: education does not moderate the relationship between Perceived Susceptibility and cybersecurity usage.
H9b: education significantly moderates the relationship between Perceived Severity and cybersecurity usage.
The null hypothesis, H9b0: education does not moderate the relationship between Perceived Severity and cybersecurity usage.
H9c: education significantly moderates the relationship between Perceived Benefits and Cybersecurity usage.
The null hypothesis, H9c0: education does not moderate the relationship between Perceived Benefits and Cybersecurity usage.
H9d: education significantly moderates the relationship between Perceived Barriers and Cybersecurity usage.
The null hypothesis, H9d0: education does not moderate the relationship between Perceived Barriers and Cybersecurity usage.
H9e: education significantly moderates the relationship between Cybersecurity Self-efficacy and Cybersecurity usage.
The null hypothesis, H9e0: education does not moderate the relationship between Cybersecurity Self-efficacy and Cybersecurity usage.
Prior Experience (PEX)
H10a: Prior Experience significantly moderates the relationship between Perceived Vulnerability and Cybersecurity usage.
The null hypothesis, H10a0: Prior Experience does not moderate the relationship between Perceived Vulnerability and Cybersecurity usage.
H10b: Prior Experience significantly moderates the relationship between Perceived Severity and Cybersecurity usage.
The null hypothesis, H10b0: Prior Experience does not moderate the relationship between Perceived Severity and Cybersecurity usage.
H10c: Prior Experience significantly moderates the relationship between Perceived Benefits and Cybersecurity usage.
The null hypothesis, H10c0: Prior Experience does not moderate the relationship between Perceived Benefits and Cybersecurity usage.
H10d: Prior Experience significantly moderates the relationship between Perceived Barriers and Cybersecurity usage.
The null hypothesis, H10d: Prior Experience does not moderate the relationship between Perceived Barriers and Cybersecurity usage.
H10e: Prior Experience significantly moderates the relationship between Information Cybersecurity Self-efficacy and Cybersecurity usage.
The null hypothesis, H10e: Prior Experience does not moderate the relationship between Cybersecurity Self-efficacy and Cybersecurity usage. These relationships are shown in Figure 1.
Research Methodology
There are many different types of research and most of them are either quantitative or qualitative in their approach (Kothari & Garg, 2019). The quantitative approach involves generating some form of quantitative data tested by rigorous methods of quantitative analysis and usually involves the researcher utilizing questionnaires to survey the sample of the population (Kothari & Garg, 2019). There are two different types of quantitative survey research, cross-sectional and longitudinal (Creswell, 2014). Both longitudinal and cross-sectional studies are observational studies in which the researcher collects data without manipulating the study environment, and in a cross-sectional study data is collected from different population groups at a single point in time, however, in a longitudinal study, the researcher collects data about of the same subjects over some time (Kothari & Garg, 2019).
Overall Approach
This research is based on the theoretical model provided by HBM. This study uses a quantitative approach with a cross-sectional survey design with a self-administered online survey that employed an invitation-only approach with Bulk SMS service using a systematic random sampling method.
Target Population
The target population for the proposed study is internet users of the Maldives who are aged from18 years and above. Since there does not exist any significant statistical study which clearly states the number of internet users in the Maldives, the sample size would be calculated based on the statistical method of calculating sample size from an unknown population. According to CAM (2018), there are 42,837 fixed broadband subscribers and 274,741 mobile broadband subscribers in the Maldives. Hence this research would be targeting those internet users using an invitation based online survey questionnaire.
Sampling technique
The most accurate list of the population above 18 years old can be selected based on the Voter’s registration list (Riyaz et al., 2020). The government publishes finalized voters registration lists for all local elections including the parliament election and the presidential election. The most recent such list was published by the Maldives government’s gazette in 2021 for the local council election. According to Krejcie and Morgan (1970) if the target population is between seventy-five thousand and one Million an appropriate sample size would be S=384, hence a random list of 2000 names was selected from the recent voters registry as a sampling frame. This method of using the voter’s registry as a sampling frame by generating random lists and then using other methods to find phone numbers to reach survey participants by an invitation-only approach has been used by Riyaz, et al (2020). The Maldivian voters’ registry includes full names and addresses of the eligible voters above 18 years of age and using this list it was possible to search ISPs’ directory services to find mobile numbers for the names. Sometimes the person might have requested to un-listing their mobile numbers from the online phone directory of ISPs, in this case, another selection was drawn from the voters’ registry to replace the previously selected individual. This process was repeated until a total of 2000 mobile numbers were identified.
Data Collection Method
An online survey instrument was used for data collection using Google forms based on the above invitation-only method. As this study is based on a quantitative approach with a set of defined hypotheses based on the conceptual framework, the best way to collect data from participants with varying degrees of information would be using the surveying method (Biggam, 2008). There are several different ways surveying could be employed, such as telephone surveys, mailed based surveys and online-based surveys (Biggam, 2011), for this study online survey has been employed as used by Geil, et al (2018). Initially, SurveyMonkey.com was the platform selected but later a decision was made to use Google forms as Riyaz et al. (2020) found them to be highly effective with invitation-only based online surveys for the Maldivian participants.
A Bulk SMS service was used to reach the list of 2000 mobile phone numbers which included a brief description of the survey and the survey link (See Appendix for more details of the survey instrument). The list of 2000 mobile phone numbers was divided into 2 lists of 1000 numbers each. This was done to accommodate for different timings to maximize the responses. Using this method of dividing the mobile numbers into two groups it took two days to reach all 2000 mobile numbers using the Bulk SMS service. Allowing a week to wait for any potential late responses the online survey was taken off-line at the end of the 7th day. A total of 206 completed surveys were recorded. As the first question in the Google form, it was asked “Do you want to participate in the survey?” and 3 responses were recorded as “No” for this question. Even though this does not exactly meet the S=384 sample size defined by (Krejcie & Morgan, 1970), in a Similar study Claar (Claar, 2011) used 184 responses that have been collected utilizing the snowball sampling method. Almost all responses were received within the 1-hour time frame of delivery of the SMSs to the intended participant and an attempt was not made to resend the SMSs again as there was no way to identify who responded and who have not responded or who would be responding to the same survey more than once if another batch of SMSs were to be sent to the same list of numbers. This could also mean that from the 2000 numbers not all of them were able to use mobile data to view the online survey. With many online surveys, the response always becomes a problem especially when the questions are related to something like user behaviour and information security. Claar (2011) reported sending 300,000 surveys by hiring a marketing firm to only receive 2 partially completed online surveys. Riyaz, et al (2020) also have mentioned challenges of reaching survey participants, especially concerning the Maldivian respondents, to address this issue they have made phone calls to the participants and persuaded them to complete the surveys before sending them the online survey instrument and to do that they employed 20 facilitators who were responsible for gathering mobile phone numbers and reaching to the participants in the list. This method was not employed in this research as recruiting facilitators would require funding and such funding has not been secured for the current study.
Data collection instrument
To collect data via an online survey, a survey instrument was developed. The survey instrument was mainly based on the works of (Claar, 2011; Ng et al., 2009) and (Geil et al., 2018) since these are the significant studies that have tested the HBM core constructs that relate to this study as well. Even though in self-reported cybersecurity behavioural surveys there exists a certain level of bias, surveys are still one of the most widely used methods of collecting behavioural data and with careful wording, the survey instrument could provide a level of reliability that is acceptable in the research community (Orehek et al., 2020).
The Pre-test
For any research, construct validity and content validity are essential (Creswell, 2012). Often researchers have been criticized for not pretesting or pilot testing even if they were using previously tested research instruments (Fowler, 2009). Some authors have differentiated between pre-test and pilot testing stating that pilot testing is like a dress rehearsal involving larger sample sizes than the pre-test whereas other authors have used the term pre-test and pilot tests interchangeably (Becker, 2019).
The developed online survey was put through a pre-test. A convenient sample of 64 participants was selected. These participants mainly were students of 3 local private colleges and the researcher’s contacts of people who were internet users above 18 years old and were willing to participate in the pre-test and to provide any constructive feedback. All 64 of the participants completed the survey and based on their feedback some minor changes were made to the wording of the questionnaire. The recommended minimum sample requirement of 100 responses (Hair et al., 2009) was not achieved to run a successful pilot study with factor analysis, hence, instead, a pre-test was conducted without a factor analysis. The following section represents details of the pre-test study. IBM SPSS version 26 was used for analysing the pre-test data.
Pre-test Respondent Demographics
Pre-test: Gender
Gender
Frequency
Percent
Male
35
54.7
Female
29
45.3
Total
64
100.0
Pre-test: Age
Age
Frequency
Percent
18
1
1.6
20
1
1.6
21
2
3.1
22
5
7.8
24
3
4.7
25
3
4.7
26
3
4.7
27
2
3.1
28
3
4.7
29
5
7.8
30
1
1.6
31
1
1.6
32
2
3.1
33
1
1.6
34
5
7.8
35
2
3.1
36
4
6.3
37
5
7.8
38
4
6.3
39
1
1.6
40
2
3.1
41
1
1.6
42
2
3.1
44
1
1.6
45
1
1.6
46
2
3.1
49
1
1.6
Total
64
100.0
Pre-test: Highest educational qualification.
Highest educational qualification
Frequency
Percent
10 or GCE O’ Level
4
6.3
A’ Level or Adv Cert
8
12.5
Diploma or Vendor Cert
21
32.8
First Degree or PGD
12
18.8
Masters
19
29.7
Total
64
100.0
Pre-test: Primary Operating system
Primary Operating system
Frequency
Percent
Valid
Win 10
34
53.1
Win 7
1
1.6
OSX
9
14.1
Linux
2
3.1
Android
11
17.2
iOS
7
10.9
Total
64
100.0
Pre-test Reliability
Constructs
N of Items
Cronbach’s Alpha
Perceived Vulnerability (PVL)
8
0.968
Perceived Severity (PSV)
7
0.960
Perceived Benefits (PBN)
8
0.975
Perceived Barriers (PBR)
4
0.873
Cues to Action (CUA)
4
0.877
Cybersecurity Usage (CSU)
3
0.948
Self-efficacy (SEF)
4
0.950
Prior Experience (PEX)
3
0.508
The above table shows the reliability coefficient Cronbach’s Alpha calculated for each of the sub-groups of the survey instrument. The reliability shows that except for the last sub-group, Prior Experience (PEX) which is at 0.508 (poor reliability), all the other sub-groups have excellent scores as indicated by George and Mallery (2013). The survey instrument was further modified to improve clarity for the PEX sub-group hoping that it might show better reliability for the actual data analysis with the real data collection.
Data Analysis
After the pre-test, data was collected for hypothesis testing and before hypotheses testing, first, reliability is tested and then construct validity is tested with exploratory factor analysis (EFA). The results of reliability and validity are discussed in detail before moving on with hypothesis testing.
Sample characteristics
The first four questions of the survey form Gender (GEN), Age (AGE), the Highest level of education achieved (EDU), and Primary operating system (OS) used by the user are demographic information.
Table 6, shows that Male participants account for 53.9 per cent adding to 111 and Female participants account for 46.1 per cent of the participants adding to 95 respondents.
GEN
Frequency
Percent
Male
111
53.9
Female
95
46.1
Total
206
100.0
Table 7 shows demographic information for Highest educational qualification reported. 34.4 per cent of the respondents responded having a first degree. A survey conducted in 2019 by the Ministry of Higher Education (MOHE) in the Maldives shows that first-degree enrolments are the highest level of qualification level enrolled by all the universities and colleges combined (MOHE, 2019).
EDU
Frequency
Percent
10 or GCE O’ Level
35
17.0
A’ Level or Adv Cert
24
11.7
Diploma or Vendor Cert
30
14.6
First Degree or PGD
71
34.5
Masters
43
20.9
Professional Degree
3
1.5
Total
206
100.0
Table 8 shows demographic information for the primary operating system (OS) reported. With 45.1 per cent, Microsoft Windows 10 is the most used operating system. 19.9 per cent reported using some version of Android as their primary operating system while 17.5 per cent reported iOS being their primary operating system. Considering the advancement of smartphone features these numbers reflect such a practice.
OS
Frequency
Percent
Win 10
93
45.1
Win 7
8
3.9
OSX
22
10.7
Linux
6
2.9
Android
41
19.9
iOS
36
17.5
Total
206
100.0
AGE
Statistic
Std. Error
AGE
Mean
33.33
.657
95% Confidence Interval for Mean
Lower Bound
32.04
Upper Bound
34.63
5% Trimmed Mean
33.05
Median
32.00
Variance
88.985
Std. Deviation
9.433
Minimum
18
Maximum
55
Range
37
Interquartile Range
15
Skewness
.411
.169
Kurtosis
-.703
.337
Table 9 shows descriptive statistics for age, which shows that for the reported 206 participants, the mean age is 34.63 with a standard deviation of 9.433, with a Skewness of 0.411 and Kurtosis of negative 0.703. Supporting these statistics, the histogram in
Figure 2 shows that age is fairly, and normally distributed, the age distribution shows that the efforts made to make the sampling a systematic random sampling did have a good impact on the age distribution histogram. A similar study conducted by Claar (2011) reported that with a snowball sampling technique the histogram did not show a normal distribution for age.
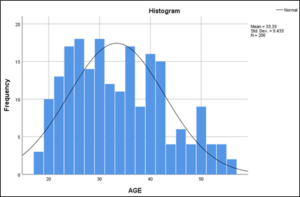
Figure 2: Age distribution Histogram.
Construct Validity and Reliability
The following section shows the construct reliability results for the core construct using Cronbach’s Alpha and the validity of the survey instrument with factor analysis. Cronbach’s Alpha determines the scale reliability for survey instruments that employ Likert scales. The reliability and validity steps are important steps before moving forward with the hypothesis testing (Fowler, 2009).
Descriptive Statistics: Core Construct
N
Minimum
Maximum
Mean
Std. Deviation
Skewness
Kurtosis
Statistic
Statistic
Statistic
Statistic
Statistic
Statistic
Std. Error
Statistic
Std. Error
Perceived Vulnerability (PVL)
PVL1
206
1
7
3.17
2.005
.566
.169
-1.092
.337
PVL2
206
1
7
2.95
1.894
.836
.169
-.529
.337
PVL3
206
1
7
3.14
1.962
.627
.169
-.903
.337
PVL4
206
1
7
3.10
1.953
.699
.169
-.831
.337
PVL5
206
1
7
3.25
1.978
.571
.169
-1.021
.337
PVL6
206
1
7
3.24
1.824
.532
.169
-.807
.337
PVL7
206
1
7
3.50
2.021
.381
.169
-1.232
.337
PVL8
206
1
7
3.62
2.020
.298
.169
-1.275
.337
Perceived Severity (PSV)
PSV1
206
1
7
4.07
2.130
-.062
.169
-1.465
.337
PSV2
206
1
7
4.35
2.203
-.237
.169
-1.486
.337
PSV3
206
1
7
4.71
2.329
-.453
.169
-1.460
.337
PSV4
206
1
7
4.42
2.180
-.282
.169
-1.456
.337
PSV5
206
1
7
4.26
2.088
-.161
.169
-1.418
.337
PSV6
206
1
7
4.13
2.009
-.109
.169
-1.335
.337
PSV7
206
1
7
4.14
2.011
-.086
.169
-1.349
.337
Perceived Benefits (PBN)
PBN1
206
1
7
4.25
1.849
-.399
.169
-1.058
.337
PBN2
206
1
7
4.03
1.744
-.145
.169
-.992
.337
PBN3
206
1
7
4.10
1.803
-.207
.169
-1.123
.337
PBN4
206
1
7
3.93
1.797
-.022
.169
-1.074
.337
PBN5
206
1
7
4.16
1.878
-.223
.169
-1.201
.337
PBN6
206
1
7
4.00
1.829
-.058
.169
-1.133
.337
PBN7
206
1
7
4.13
1.932
-.171
.169
-1.270
.337
PBN8
206
1
7
4.21
1.953
-.217
.169
-1.273
.337
Perceived Barriers (PBR)
PBR1
206
1
7
4.64
1.933
-.456
.169
-1.075
.337
PBR2
206
1
7
4.27
1.822
-.236
.169
-1.088
.337
PBR3
206
1
7
3.88
1.873
-.068
.169
-1.366
.337
PBR4
206
1
7
4.09
1.839
-.166
.169
-1.350
.337
Cues to Action (CUA)
CUA1
206
1
7
4.50
1.927
-.489
.169
-1.031
.337
CUA2
206
1
7
4.75
1.936
-.671
.169
-.805
.337
CUA3
206
1
7
4.63
1.864
-.497
.169
-.961
.337
CUA4
206
1
7
4.74
1.962
-.644
.169
-.866
.337
Cybersecurity Usage (CSU)
CSU1
206
1
6
2.73
1.806
.722
.169
-.862
.337
CSU2
206
1
6
2.49
1.690
.843
.169
-.545
.337
CSU3
206
1
6
2.55
1.776
.855
.169
-.690
.337
Self-efficacy (SEF)
SEF1
206
1
7
3.93
2.005
.178
.169
-1.251
.337
SEF2
206
1
7
4.01
2.122
.040
.169
-1.333
.337
SEF3
206
1
7
3.91
2.058
.163
.169
-1.269
.337
SEF4
206
1
7
4.00
2.035
.053
.169
-1.268
.337
Prior-Experience (PEX)
PEX1
206
1
6
1.94
.925
1.275
.169
2.342
.337
PEX2
206
1
7
1.89
1.068
1.794
.169
4.338
.337
PEX3
206
1
7
2.45
1.991
1.253
.169
.162
.337
Valid N (listwise)
206
The research framework consists of six independent variables, four moderating variables and the dependent variable. The independent variables are Perceived Vulnerability (PVL), Perceived Severity (PSV), Perceived Benefits (PBN), Perceived Barriers (PBN), Cues to Action (CUA) and Self-efficacy (SEF). Cybersecurity Usage (CSU) and Prior-Experience (PEX) are moderating variables. Other moderating variables such as demographic variables are not reflected in the core construct reliability analysis.
Reliability Analysis
Table 11 shows Cronbach’s alpha for all the constructs with an additional column stating alpha if an item is deleted. Except for the last sub-construct group, Prior-Experience (PEX), all the other items show excellent reliability (George & Mallery, 2013). Prior-Experience (PEX) shows 0.595, which depicts poor reliability. This was a problem observed with the pre-test analysis as well. Even after modifications to the wording of the questions, the problem persists. However, by removing the third item PEX3, the reliability of the sub-construct group could be improved to 0.723, which is acceptable according to George and Mallery (2013), hence that item PEX3 has been removed from the analysis. Removing that will have some impact on the overall study, however, the PEX1 and PEX2 would still measure the prior-experience construct and the rest of the research framework, making this a better option in terms of reliability.
Items
Cronbach’s Alpha
Cronbach’s Alpha if Item Deleted
Perceived Vulnerability (PVL)
0.955
PVL1
0.948
PVL2
0.949
PVL3
0.945
PVL4
0.950
PVL5
0.945
PVL6
0.950
PVL7
0.953
PVL8
0.952
Perceived Severity (PSV)
0.963
PSV1
0.960
PSV2
0.955
PSV3
0.959
PSV4
0.954
PSV5
0.959
PSV6
0.955
PSV7
0.955
Perceived Benefits (PBN)
0.975
PBN1
0.973
PBN2
0.972
PBN3
0.970
PBN4
0.973
PBN5
0.971
PBN6
0.973
PBN7
0.973
PBN8
0.972
Perceived Barriers (PBR)
0.897
PBR1
0.901
PBR2
0.864
PBR3
0.848
PBR4
0.852
Cues to Action (CUA)
0.936
CUA1
0.920
CUA2
0.917
CUA3
0.904
CUA4
0.925
Cybersecurity Usage (CSU)
0.925
CSU1
0.889
CSU2
0.922
CSU3
0.862
Self-efficacy (SEF)
0.969
SEF1
0.969
SEF2
0.951
SEF3
0.954
SEF4
0.962
Prior-Experience (PEX)
0.595
PEX1
0.438
PEX2
0.440
PEX3
0.723
Table 12 shows item reliability after PEX3 has been removed and the values indicate that the survey instrument’s scale is reliable with its subscales.
Items
No. of Items
Cronbach’s Alpha
Perceived Vulnerability (PVL)
8
0.955
Perceived Severity (PSV)
7
0.963
Perceived Benefits (PBN)
8
0.975
Perceived Barriers (PBR)
4
0.897
Cues to Action (CUA)
4
0.936
Cybersecurity Usage (CSU)
3
0.925
Self-efficacy (SEF)
4
0.969
Prior-Experience (PEX)
2
0.723
Construct Validity
Construct validity for quantitative studies consisting of Likert scale instruments could be performed with exploratory factor analysis (Garrett-Mayer, 2004) also known as EFA for short. However, EFA is a complex, multi-step process often not utilized most accurately by various researchers (Costello & Osborne, 2005). According to Costello and Osborne (2005) to get the best results the researcher should use either Maximum Likelihood or Principal Axis Factoring and the latter does not make assumptions about the sample being normally distributed. Osborne (2019) argues that with modern computing power it is not necessary to use an orthogonal rotation method such as varimax, rather it would be much better if an oblique rotation method such as Direct Oblimin be used. According to Costello and Osborne (2005), many researchers especially statistical professionals believe that when using factor analysis such as EFA for checking factor loadings for construct validity, the most used value of eigenvalue greater than 1 alone is not enough. Authors also have strongly pointed out the importance of identifying how many factors to include and have stressed that the most used statistical packages such as SPSS do not provide the best methods such as parallel analysis (Costello & Osborne, 2005).
For the reasons mentioned above, to get the best results from the factor analysis, first, it will be checked whether factoring exists for the application of EFA. To do that KMO and bartlett’s tests would be generated and evaluated.
Table 13 shows KMO and Bartlett’s Test, with a 0.899 scores for Kaiser-Meyer-Olkin (KMO) Measure of Sampling Adequacy. A score greater than 0.7 is a good score for proceeding with the factor analysis (Fowler, 2009).
KMO and Bartlett’s Test
Kaiser-Meyer-Olkin Measure of Sampling Adequacy.
.898
Bartlett’s Test of Sphericity
Approx. Chi-Square
9857.086
df
780
Sig.
.000
Using SPSS’s dimension reduction module, a factor analysis with Principal Axis Factoring extraction method with the rotation method as Direct Oblimin and delta 0 was used. In the Options, under coefficient display format, suppress small coefficient equal to or less than 0.4 parameters was used as suggested by many authors (Costello & Osborne, 2005).
When looking at the initial EFA output of SPSS, it was observed that PBR1 (“The expense of security software is a concern for me.”) and PEX3 (“The level of impact (in terms of time lost, data lost, monetary losses, etc.)I have experienced from a cybersecurity problem is:”) had factor loadings below 0.7, which at this stage must be removed to retain construct validity, hence the pattern matrix shown in
Table 14 shows the output after PBR1 removed. Even though PEX3 had a lower score it was retained because if it was removed there is a considerable threat to content validity as it is an important part of hypothesis testing. In a similar study Claar (2011) has retained prior experience stating that removing the item would threaten the content validity of the survey.
The number of factors loaded indicated by the Scree plot presented in
Figure 3 shows support for an 8-factor solution, however, the scree plot is a visual method for determining how many factors to retain, many authors suggest using a more accurate method such as parallel analysis in conjunction with scree plot to indicate how many factors to retain (Fabrigar et al., 1999). To perform the parallel analysis an online software tool developed by Patil, et al. (2017) was used and parameters were entered as 41 for the number of variables and 206 as the total sample size with the rest of the default settings. The output of the parallel analysis has been included in the appendix. The results of the parallel analysis show Eigenvalue of 1.18 as the highest number produced. Comparing this with the generated Eigenvalues shown in the variance table, a higher value than 1.18 is indicated as the cut-off point, in this case, the 8th factor has an Eigenvalue of 1.369 and after that, the values drop to 0.851 and below. This observation confirms the Scree plot results thereby confirming 8 factors solution is truly supported and factor loadings are consistent with the instrument.
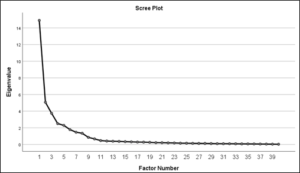 Figure 3: Scree Plot showing factor 8 factors.
Pattern Matrix
Factor
PSV
SEF
PVL
CUA
PBN
CSU
PBR
PEX
PSV4
.883
PSV6
.867
PSV7
.862
PSV2
.852
PSV3
.817
PSV5
.796
PSV1
.779
SEF3
.962
SEF2
.958
SEF4
.915
SEF1
.883
PVL1
.905
PVL3
.900
PVL5
.897
PVL2
.862
PVL6
.828
PVL8
.778
PVL4
.769
PVL7
.755
CUA3
.896
CUA2
.874
CUA4
.842
CUA1
.823
PBN7
-.930
PBN8
-.914
PBN3
-.901
PBN4
-.885
PBN6
-.882
PBN5
-.878
PBN2
-.875
PBN1
-.781
CSU3
.918
CSU1
.876
CSU2
.858
PBR3
.878
PBR4
.784
PBR2
.761
PBR1
.516 *
PEX1
.765
PEX2
.734
Note: * loadings less than 0.70. A good loading is indicated as above 0.70.
Table 16 shows a summary of the variance in the data and the cumulative total of the 8 factors solution explains 82.253% of the variance in the data.
Factor
Initial Eigenvalues
Total
% of Variance
Cumulative %
1
15.315
37.354
37.354
2
5.078
12.385
49.739
3
3.785
9.232
58.971
4
2.535
6.183
65.155
5
2.299
5.608
70.762
6
1.798
4.384
75.147
7
1.545
3.767
78.914
8
1.369
3.339
82.253
The results of reliability and validity show that results are acceptable to move forward with the next step, hypothesis testing. To get the overall idea of the data distribution, each item factor was combined to produce a combined score for each factor. The descriptive statistic for the combined score is presented in table 17, which shows that for most of the construct the data covered the entire range of possible values (1 to7). The exception was CSU (Cybersecurity usage) and PEX (Prior-Experience). CSU had a minimum range of 1 but a maximum range of 6. EXP had a minimum range of 1 but a maximum range of 5.33. Skewness ranged from -0.595 to 0.807 and Kurtosis ranged from -1.330 to -0.174, comparing with the more liberal standard of the range between -1 to 1, the data seems to be fairly, normally distributed.
Variable
Min
Max
Mean
Std. Dev
Skew
Std. Error
Kurtosis
Std. Error
Perceived Vulnerability (PVL)
1.00
7.00
3.2451
1.70829
.603
.169
-.737
.337
Perceived Severity (PSV)
1.00
7.00
4.2989
1.93249
-.305
.169
-1.330
.337
Perceived Benefits (PBN)
1.00
7.00
4.1001
1.70845
-.240
.169
-1.027
.337
Perceived Barriers (PBR)
1.00
7.00
4.2197
1.63125
-.230
.169
-1.130
.337
Cues to Action (CUA)
1.00
7.00
4.6553
1.76141
-.595
.169
-.834
.337
Cybersecurity Usage (CSU)
1.00
6.00
2.5906
1.63966
.759
.169
-.677
.337
Self-efficacy (SEF)
1.00
7.00
3.9648
1.96563
.104
.169
-1.247
.337
Prior-Experience (EXP)
1.00
5.33
2.0939
1.04782
.807
.169
-.174
.337
Before moving on with hypotheses testing with multiple linear regression, histograms were inspected for normal distribution, descriptive statistics show there are no missing values as N = 206 for all responses, scatterplots show relations are liner, the results of Cronbach’s alpha meet the standard, any items lower than 0.7 were excluded, exploratory factor analysis show factors were loading as expected and multicollinearity was maintained at an acceptable level, therefore, it is evident that all the main assumptions for multiple regression are met as recommended by researchers (Hancock et al., 2010), the next section presents the hypotheses testing for the study.
Hypothesis Testing
To test the hypotheses, all non-dichotomous variables have been mean-centred first and hierarchical multiple regression analysis has been performed. Using centred data is a good research strategy, and it is the process of selecting a reference value for each predictor so that each regression coefficient that is tested is relevant to the research question, using non-centred data often leads to inconsistent and misleading statistical inferences (Kraemer & Blasey, 2004).
The entire analysis apart from the parallel analysis was conducted using IBM’s SPSS version 26. The regression was conducted using a two-step hierarchical method. Hierarchical regression is an effective tool for analysis when variance on a criterion variable is being explained by predictor variables that are correlated with each other as indicated by the theoretical framework (Lewis, 2007), in this case, constructs of HBM are related to each other concerning the dependent variable, hence, the effect of a predictor variable is achieved after controlling for other variables, and this control is achieved by calculating the change in the adjusted R2 at each step of the analysis and provides certain advantages compared to other regression methods such as stepwise regression analysis (Lewis, 2007). In the first step, the dependent variable cybersecurity usage (CSU) was regressed on the independent variables of perceived vulnerability (PVL), perceived severity (PSV), perceived benefits (PBN), perceived barriers (PBR), self-efficacy (SEF) and cues to action (CUA) to investigate the main effects of the independent variables. The hypothesized moderating variables of gender (GEN), age (AGE), education (EDU) and prior experience (PEX) and the hypothesized two-way interactions between these moderating variables and the independent variables of perceived vulnerability, perceived severity, perceived benefits, perceived barriers, and self-efficacy were added to the regression in step two. Table 18 shows the overall fit of the regression model summary, and table 19 shows the results of the hierarchical regression analysis.
Model Summary
Model
R
R Square
Adjusted R Square
Std. The error of the Estimate
Change Statistics
R Square Change
F Change
df1
df2
Sig. F Change
1
0.355
0.126
0.100 ***
1.55566
.126
4.789
6
199
0.000
2
0.584
0.342
0.229 ***
1.43999
.215
2.386
24
175
0.001
Note: *p ≤ 0.05; **p ≤ 0.01; ***p ≤ 0.001
Coefficients
Model
Unstandardized Coefficients
Standardized Coefficients
Sig.
Collinearity Statistics
B
Std. Error
Beta
Tolerance
VIF
1
(Constant)
-5.601E-6
.108
1.000
Perceived Vulnerability
.123
.074
.128
.100
.732
1.367
Perceived Severity
-.196
.082
-.231
.018 *
.471
2.125
Perceived Benefits
.075
.089
.078
.403
.507
1.974
Perceived Barriers
-.047
.080
-.048
.559
.642
1.558
Self-Efficacy
.268
.061
.321
.000 ***
.816
1.225
Cues-to-Action
.059
.079
.064
.451
.615
1.625
2
(Constant)
-.074
.171
.667
Perceived Vulnerability
-.012
.105
-.013
.906
.317
3.159
Perceived Severity
-.384
.158
-.453
.016 *
.109
9.179
Perceived Benefits
.270
.162
.281
.097
.132
7.567
Perceived Barriers
.057
.128
.059
.655
.216
4.630
Self-Efficacy
.284
.094
.340
.003 **
.294
3.400
Cues-to-Action
.022
.077
.024
.777
.543
1.840
Gender
.121
.229
.037
.597
.770
1.299
Age
.023
.013
.131
.092
.631
1.584
Education
.137
.078
.120
.081
.800
1.251
Prior-Experience
.281
.113
.179
.014 *
.728
1.374
Gender x Vulnerability
.178
.149
.128
.234
.330
3.029
Gender x Severity
.193
.186
.160
.300
.158
6.341
Gender x Benefits
-.240
.197
-.185
.225
.162
6.177
Gender x Barriers
-.065
.157
-.048
.680
.275
3.633
Gender x Self-Efficacy
-.021
.124
-.018
.864
.332
3.011
Age_x Vulnerability
.010
.009
.092
.300
.483
2.070
Age x_Severity
-.005
.010
-.058
.601
.303
3.305
Age x_Benefits
-.013
.012
-.129
.277
.271
3.694
Age x _Barriers
.018
.010
.169
.079
.413
2.421
Age x_Self-Efficacy
.003
.008
.037
.666
.512
1.955
Education x Vulnerability
-.043
.062
-.070
.490
.371
2.696
Education x Severity
.196
.062
.337
.002 **
.333
3.006
Education x_Benefits
.013
.081
.021
.869
.238
4.210
Education x Barriers
-.209
.068
-.311
.002 **
.370
2.706
Education x Self-Efficacy
-.012
.043
-.021
.785
.658
1.520
Prior-Experience x_Vulnerability
-.096
.077
-.108
.217
.497
2.010
Prior-Experience x_Severity
-.027
.075
-.035
.717
.401
2.494
Prior-Experience x Benefits
.322
.092
.340
.001 **
.400
2.502
Prior-Experience x_Barriers
-.159
.090
-.171
.078
.404
2.474
Prior-Experience x_Self-Efficacy
.022
.067
.027
.747
.541
1.848
Note: Significant at *p < 0.05, **p <0.01, ***p <0.001
Collinearity diagnostics conducted during the regression show that the tolerance scores were all above 0.01 and VIF scores were all below 10, indicating there are no major concerns of multicollinearity present for the regression analysis (Hair et al., 2009).
Overall, the research model explains 34.2% (adj. R2 = 0.229) of the variance in the dependent variable, cybersecurity usage (CSU). The main effects of perceived vulnerability (PVL), perceived severity (PSV), perceived benefits (PBN), perceived barriers (PBR), self-efficacy (SEF), and cues to action (CUA) account for 12.6% (adj. R2 = 0.100) of the explained variance, while the moderating variables, gender (GEN), age (AGE), education (EDU), prior experience (PEX) and the hypothesized two-way effects account for 21.5% (adj. R2 = 0.129) of the variance in cybersecurity usage.
In the model 1 regression analysis, the main effects of perceived vulnerability, perceived severity, perceived benefits, perceived barriers, self-efficacy, and cues to action, were tested (H1-H6).
For a hypothesis to be supported with statistical significance, the p value should be less than 0.05, otherwise, the null hypothesis cannot be rejected (Hair et al., 2009) hence, it has been indicated if the hypothesis is supported or not supported.
H1, which predicted that perceived vulnerability would be positively related to cybersecurity usage, was not supported (β = 0.128, p = 0.100, n.s.). H2, which predicted that perceived severity would be positively related to cybersecurity usage, was supported (β = -0.231, p = 0.018). H3, which predicted that perceived benefits would be positively related to cybersecurity usage, was not supported (β = 0.078, p = 0.403, n.s.). H4, which predicted that perceived barriers would be negatively related to cybersecurity usage, was not supported (β = -0.480, p = 0.559, n.s.). H5, which predicted that self-efficacy of cybersecurity practices would be positively related to cybersecurity usage, was supported. (β = 0.321, p = 0.000). H6, which predicted that cues to action would be positively related to cybersecurity usage, was not supported (β = 0.064, p = 0.451, n.s.).
In model 2, the research hypotheses H7a-e, H8a-e, H9a-e, and H10a-e were tested along with the main effects of the moderating variables. These moderators were not hypothesized to be significantly related to cybersecurity usage.
Hypotheses H7a-e, which predicted that gender would have a significant moderating effect with perceived vulnerability, perceived severity, perceived benefits, perceived barriers, and self-efficacy were not supported (H7a, β = 0.133, p = 0.451, n.s.; H7b, β = 0.160, p = 0.300, n.s.; H7c, β = -0.185, p = 0.225, n.s.; H7d, β = -0.048, p = 0.680, n.s.; H7e, β = -0.018, p = 0.864, n.s.;). The general effect on gender (GEN) on cybersecurity usage (CSU) was also not significant (β = 0.037, p = 0.597, n.s.).
Hypotheses H8a-e, which predicted that age would have a significant moderating effect with perceived vulnerability, perceived severity, perceived benefits, perceived barriers, and self-efficacy was also not supported (H8a, β = 0.092, p = 0.300, n.s.; H8b, β = -0.058, p = 0.601, n.s.; H8c, β = -0.129, p = 0.277, n.s.; H8d, β = 0.169, p = 0.079, n.s.; H8e, β = 0.037, p = 0.666, n.s.;).
Hypotheses H9a-e, which predicted that education would have a significant moderating effect with perceived vulnerability, perceived severity, perceived benefits, perceived barriers, and self-efficacy, only H9b (β = 0.337, p = 0.002) and H9d (β = -0.311, p = 0.002) were supported. (H9a, β = -0.070, p = 0.490, n.s.; H9c, β = 0.021, p = 0.869, n.s.; H9e, β = -0.021, p = 0.785, n.s.). The main effect of education on cybersecurity usage was not significant (β = 0.120, p = 0.081, n.s.).
H9b predicted that education would have a significant moderating effect on perceived severity and the interaction of education with perceived severity on cybersecurity usage shows that when education is low (-2 SD), perceived severity has a negative effect on cybersecurity, this is not how the relationship has been predicted, however, when education is high (2 SD), perceived severity has a positive effect on cybersecurity usage, this agrees with the predicted hypothesis. This could be explained as that when an individual has a high educational qualification, that person’s overall understanding of perceived severity is also better, hence, this would have a positive impact on the person’s cybersecurity usage, however, when an individual does not have proper education or education is low, that person’s understanding of severity would not be as clear hence, the effect on this on cybersecurity usage is also not clear, thus having the negative effect depicted in the interaction diagram presented in Figure 4.
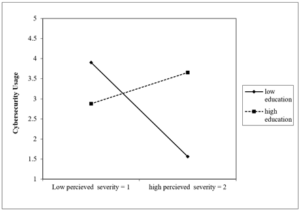
Figure 4: 2-Way Interaction: PSV and EDU on CSU.
H9d predicted that education would have a significant moderating effect on perceived barriers and the interaction of education with perceived barriers on cybersecurity usage shows that when education is low (-2 SD) perceived barriers have a positive effect on cybersecurity usage, this does not agree with the real understanding associated with the HBM constructs of the hypothesis, however, when education is high (2 SD) perceived barriers have a negative effect on cybersecurity usage, as per the general understanding of HBM construct. Perceived barriers are those things that become a problem to practising the intended behaviour, for example, when an individual believes that using security software such as anti-virus and firewalls, makes things too complicated for that individual and that person would not be able to practice cybersecurity. Thus, the intended practice should be to design interventions that could address this problem or this barrier so that the security practice would be adopted by the user. Therefore, when an individual has a high educational qualification, the 2-way interaction in
Figure 5 shows that it increases that person’s understanding of what could be barriers hence their perceived barriers are high having low cybersecurity usage. On the contrary, when an individual’s educational qualification is low, their understanding of barriers may not be clear, hence, they might perceive that there are no barriers hence which might show their cybersecurity usage is high with lower education. This might not be the intended understanding or outcome of the predicted hypothesis.
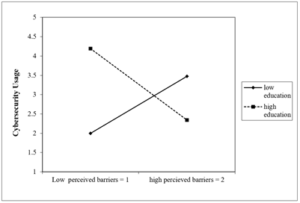
Figure 5: 2-way interaction: EDU with PBR on CSU.
Hypotheses H10a-e, which predicted that prior experience would have a significant moderating effect with perceived vulnerability, perceived severity, perceived benefits, and self-efficacy, only H10c, was supported (β = 0.340, p = 0.001). (H10a, β = -0.108, p = 0.217, n.s.; H10b, β = -0.035, p = 0.717, n.s.; H10d, β = -0.171, p = 0.078, n.s.; H10e, β = 0.027, p = 0.747, n.s.;). The main effect of prior experience (PEX) on cybersecurity usage was found to be significant (β = 0.179, p = 0.014).
H10c predicted that prior experience would have a significant moderating effect with perceived benefits on cybersecurity usage. The interaction plot in Figure 6, shows that when Prior-Experience is low (-2 SD), low-perceived benefits have a positive impact on cybersecurity usage, not supported by the predicted hypothesis. On the contrary, when Prior-Experience is high (2 SD), perceived benefits have a positive impact on cybersecurity usage, which is consistent with the intended prediction of the hypothesis. This could mean that when an individual has experienced more cybersecurity incidents, that individual’s perception of the benefits of practising cybersecurity usage is high, thereby adopting more secure behaviour. The intended understanding of the HBM construct agrees with this finding because it predicts the overall experience of the negative impact of some experiences such as getting sick would increase that person’s perception of the benefits of safer practices.
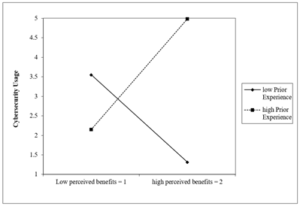
Figure 6: 2-way interaction: PEX with PBN on CSU.
Post-Hoc Power Analysis
Overall, only 5 of the 26 hypotheses were supported during the analysis of the research model. In the effect of non-significant results, some authors suggest that a post hoc power analysis could provide a meaningful answer (Lenth, 2007), however many authors oppose this view and state that once a study has been conducted with a particular sample size, doing a post hoc power analysis does not provide any additional information at all (Zhang et al., 2019). Using a statistical calculator provided at danielsoper.com, a post hoc power calculation was conducted for the hierarchical regression analysis using an alpha level of 0.05, 30 predictors in the model, an R2 of 0.342, and a sample size of 206. The result of the analysis indicated that the observed power for this research is 0.9997 (Soper, 2021), which indicates that this is significantly higher than the recommended minimum of 0.8, confirming that the sample size for testing the regression model was sufficient to find even the smallest effect size. This could add to the justification that even though only 5 hypotheses were supported this was not due to lower sample size as the sample size that is required for a 0.8 power has been calculated much lower than the 206 responses included in this study. The best practice for using post hoc power is instead of asking how much power is obtained by a specified available sample size, rather ask what sample size is needed to obtain a desired amount of power before planning for the required sample size (Dziak et al., 2020).
Conclusion
This research started with a very specific aim, to understand the cybersecurity behaviour of internet users of the Maldives with the help of the HBM. To achieve this aim, an extensive literature review was conducted, as a result, a conceptual framework was developed, and 26 hypotheses were put forward that address the relationships between six independent variables of the core HBM constructs known as perceived vulnerability, perceived severity, perceived benefits, perceived barriers, self-efficacy, cues to action, and one dependent variable known as cybersecurity usage. Apart from that, moderator constructs were also included in the model known as age, gender, education, prior experience, and their interaction with the independent variables excluding cues to action mentioned here. The model with all the hypothesised relationships together has been expected to provide an understanding of the cybersecurity behaviour of internet users of the Maldives.
Key contributions
The first original contribution of the current study is that this is the first attempt at using HBM to explore the cybersecurity behaviour of internet users of the Maldives. There does not exist any published research that has been utilized HBM in the domain of human aspects of cybersecurity concerning Maldivian internet users. Hence, this study would lay the foundation for conducting future cybersecurity research focusing on the human aspects of cybersecurity in the Maldivian context and provides insight to stakeholders to address the issue of proper awareness campaigns for improving and enhancing cybersecurity behaviour for the whole nation.
The second contribution is the use of HBM in human aspects of cybersecurity research targeting internet users. Previous studies have used several target populations, but internet users, in general, were not among the studied populations. Hence this research attempted to fill that gap by adding value to the body of knowledge.
The third key contribution is to produce findings that agree with previous health belief research that certain core constructs such as perceived severity and self-efficacy of the HBM contribute more strongly to explaining human behaviour than others.
Limitations of the study
Efforts have been made to minimize any sort of limitations associated with the study, however, all studies are faced with limitations. Hence the limitations of this study are as follows:
- One of the main limitations of this study could be attributed to the use of HBM itself because HBM could have some limitations in understanding human behaviour related to cybersecurity as HBM does not take used bad habits into consideration.
- Apart from that another limitation of this study would be the use of a self-administered survey approach. All self-administered surveys would have a certain level of bias associated with the nature of self-reporting; people might not tell the truth because they might not want to admit bad behaviour.
- Even though data collection was based on a systematic random sampling method, this study just got a moderate response rate with a total number of 206 responses out of the 2000 targeted individuals and failed to meet the intended sample size of S=384 as indicated by Krejcie & Morgan (1970), hence there could be unknown behaviour concerning cybersecurity usage simply because those individuals of the population were not reached.
- Sine the survey questionnaire was hosted online anonymously, there was no way to assure the individuals who responded were exactly the ones who got the invitation, someone other than the respondents could have answered the questionnaire such as a colleague or a family member.
- Finally, out of 26 hypotheses only 5 were statistically significant, this could be a major limitation of the study and one way to address this limitation would be to repeat the study with larger sample size and compare the results with the current study.
Directions for future research
The goal of understanding internet users’ cybersecurity behaviour is to create intervention plans that could try to address them positively, hence future research could use the significant constructs of the current study as a qualitative approach to explore these behaviours in-depth.
In addition to that, a longitudinal survey design with “intervention” as a moderator construct could help better understand how user behaviour changes over time. Moreover, this research could also be repeated with additional cybersecurity domains such as information handling, incident handling, social media attitudes and password management.
Finally, this research could be repeated with a stratified random sampling method with a larger sample size to understand how the behaviour reflects specific demographic groups.
References
- Addae J, Radenkovic M, Sun X, Towey D (2016). An Augmented Cybersecurity Behavioral Research Model. IEEE 40th Annual Computer Software and Applications Conference (COMPSAC), 2:602-603.
- Alkhalil Z, Hewage C, Nawaf L, Khan I (2021). Phishing Attacks: A Recent Comprehensive Study and a New Anatomy. Frontiers in Computer Science, 3, 6.
- Anwar M, He W, Ash I, Yuan X, Li L, et al. (2017). Gender difference and employees’ cybersecurity behaviors. Computers in Human Behavior, 69:437-443.
- Becker I (2019). Measuring and Understanding Security Behaviours [Doctoral, UCL (University College London)]. In Doctoral thesis, UCL (University College London). UCL (University College London).
- Biggam J (2011). Succeeding with Your Master’s Dissertation: A Step-by-Step Handbook. Open University Press.
- (2018). Telecom Statistics—June 2018. CAM Year Book.
- Carley K M (2020). Social cybersecurity: An emerging science. Computational and Mathematical Organization Theory, 26:365-381.
- Chandarman R, van Niekerk B (2017). Students’ cybersecurity awareness at a private tertiary educational institution. The African Journal of Information and Communication, 20:133-155.
- Claar C L (2011). The adoption of computer security: An analysis of home personal computer user behavior using the health belief model [PhD, Uta State University].
- Conteh N, Schmick P (2016). Cybersecurity:risks, vulnerabilities and countermeasures to prevent social engineering attacks. International Journal of Advanced Computer Research, 6:31-38.
- Costello A & Osborne J (2005). Best practices in exploratory factor analysis: Four recommendations for getting the most from your analysis. Practical Assessment, Research, and Evaluation, 10(1).
- Couce-Vieira A, Insua D R, Kosgodagan A (2020). Assessing and Forecasting Cybersecurity Impacts. Decision Analysis, 17:356-374.
- Creswell J W (2012). Educational Research: Planning, Conducting, and Evaluating Quantitative and Qualitative Research (4th Edition). Pearson.
- Creswell, J. W. (2014). Research design: Qualitative, quantitative, and mixed methods approaches (4th ed). SAGE Publications.
- Davinson N, Sillence E (2010). It won’t happen to me: Promoting secure behaviour among internet users. Computers in Human Behavior, 26:1739-1747.
- De Kimpe L, Walrave M, Verdegem P, Ponnet K (2021). What we think we know about cybersecurity: An investigation of the relationship between perceived knowledge, internet trust, and protection motivation in a cybercrime context. Behaviour & Information Technology, 0(0), 1-13.
- Dhamija R, Tygar J D, Hearst M (2006). Why phishing works. In Proceedings of the SIGCHI Conference on Human Factors in Computing Systems (pp. 581-590). Association for Computing Machinery.
- Duffy B, Duffy V (2020). Data Mining Methodology in Support of a Systematic Review of Human Aspects of Cybersecurity (pp. 242-253).
- Duić I, Cvrtila V, Ivanjko T (2017). International cyber security challenges. 2017 40th International Convention on Information and Communication Technology, Electronics and Microelectronics (MIPRO), 1309-1313.
- Dziak J J, Dierker L C, Abar B (2020). The Interpretation of Statistical Power after the Data have been Gathered. Current Psychology (New Brunswick, N.J.), 39:870-877.
- Fabrigar L R, Wegener D T, MacCallum R C, Strahan E J (1999). Evaluating the use of exploratory factor analysis in psychological research. Psychological Methods, 4:272-299.
- Fischer, E. A. (2009). Creating a national framework for cybersecurity: An analysis of issues and options. Nova Science Publishers.
- Fowler F (2009). Survey Research Methods (4th ed.). SAGE Publications, Inc.
- Garrett-Mayer E (2004). Scaling procedures: Issues and applications. Statistics in Medicine, 23:2480-2481.
- Geil A, Sagers G, Spaulding A, Wolf J (2018). Cyber security on the farm: An assessment of cyber security practices in the United States agriculture industry. International Food and Agribusiness Management Review, 21:1-18.
- George, D., & Mallery, P. (2013). IBM SPSS Statistics 21 Step by Step: A Simple Guide and Reference (13th Edition). Pearson.
- Gupta S, Singhal A, Kapoor A (2016). A literature survey on social engineering attacks: Phishing attack. 2016 International Conference on Computing, Communication and Automation (ICCCA), 537-540.
- Hair J F, Black W C, Babin B J, Anderson R E (2009). Multivariate Data Analysis (7th edition). Pearson.
- Hall M (2016). Why people are key to cyber-security. Network Security, 2016(6), 9-10.
- Hamburg I, Grosch K R (2017). Ethical Aspects in Cyber Security. Archives of Business Research, 5(10), Article 10.
- Hancock G R, Mueller R O, Stapleton L M (2010). The Reviewer’s Guide to Quantitative Methods in the Social Sciences. Routledge.
- Hughes-Lartey K, Li M, Botchey F E, Qin Z (2021). Human factor, a critical weak point in the information security of an organization’s Internet of things. Heliyon, 7(3), e06522.
- Humaidi N, Balakrishnan V, Shahrom M (2014). Exploring user’s compliance behavior towards Health Information System security policies based on extended Health Belief Model. 2014 IEEE Conference on E-Learning, e-Management and e-Services (IC3e), 30-35.
- Idika N, Mathur A (2007). A survey of malware detection techniques. Purdue University.
- Internetworldstats (2018). Asia Internet Stats by Country and 2021 Population Statistics.
- Jarrett M P (2017). Cybersecurity—A Serious Patient Care Concern. JAMA, 318(14), 1319.
- Khonji M, Iraqi Y, Jones A (2013). Phishing Detection: A Literature Survey. IEEE Communications Surveys Tutorials, 15(4), 2091-2121.
- Kothari C R, Garg G (2019). Research Methodology: Methods and Techniques. New Age International Publishers.
- Krejcie R V, Morgan D W (1970). Determining Sample Size for Research Activities. Educational and Psychological Measurement, 30:607-610.
- Lenth R (2007). Post Hoc Power: Tables and Commentary.
- Lewis M (2007). Stepwise versus Hierarchical Regression: Pros and Cons. In Online Submission.
- MandhuCollege (2016). Online Learning. Mandhu College.
- Maskun, Manuputty A, Noor S M, Sumardi J (2013). Cyber Security: Rule of Use Internet Safely? Procedia – Social and Behavioral Sciences, 103, 255-261.
- MOHE (2019). Higher Education Statistics Ministry of Higher Education.
- Muhirwe J, White N (2016). Cybersecurity Awareness and Practice of Next Generation Corporate Technology Users.
- Muniandy L, Muniandy B, Samsudin Z (2017). Cyber Security Behaviour among Higher Education Students in Malaysia. Journal of Information Assurance & Cybersecurity, 1-13.
- Ng B-Y, Kankanhalli A, Xu Y (Calvin). (2009). Studying users’ computer security behavior: A health belief perspective. Decision Support Systems, 46(4), 815-825.
- Ng, B.-Y, Xu Y (2007). Studying Users’ Computer Security Behavior Using the Health Belief Model. PACIS.
- Nobles C (2018). Botching Human Factors in Cybersecurity in Business Organizations. 9(3), 18.
- Orehek Š, Petrič G, Šinigoj J (2020). Assessing the Human Factor of Cybersecurity: Can Surveys Tell the Truth? In C. Stephanidis, A. Marcus, E. Rosenzweig, P.-L. P. Rau, A. Moallem, & M. Rauterberg (Eds.), HCI International 2020—Late Breaking Papers: User Experience Design and Case Studies (pp. 267-281). Springer International Publishing.
- Osborne J (2019). What is Rotating in Exploratory Factor Analysis? Practical Assessment, Research, and Evaluation, 20(1).
- Parent M, Cusack B (2016). Cybersecurity in 2016: People, technology, and processes. Business Horizons, 59(6), 567-569.
- Patil Vivek H, Surrendra N, Singh S M, Donavan D T (2017). Parallel Analysis Engine to Aid in Determining Number of Factors to Retain using R [Computer software].
- Pollini A, Callari T C, Tedeschi A, Ruscio D, Save L, et al. (2021). Leveraging human factors in cybersecurity: An integrated methodological approach. Cognition, Technology & Work.
- Rahman T, Rohan R, Pal D, Kanthamanon P (2021). Human Factors in Cybersecurity: A Scoping Review. The 12th International Conference on Advances in Information Technology, 1-11.
- Reid R, Van Niekerk J (2014). From information security to cyber security cultures. 2014 Information Security for South Africa, 1-7.
- Rieck K, Holz T, Willems C, Düssel P, Laskov P (2008). Learning and Classification of Malware Behavior. In D. Zamboni (Ed.), Detection of Intrusions and Malware, and Vulnerability Assessment (pp. 108-125). Springer.
- Riyaz A, Musthafa H, Abdul Raheem R, Moosa S (2020). Survey sampling in the time of social distancing: Experiences from a quantitative research in the wake of COVID-19 pandemic. 169-192.
- Rosenstock I M (1974). Historical Origins of the Health Belief Model. Health Education Monographs, 2(4), 328-335.
- Rosenstock I M, Strecher V J, Becker M H (1988). Social Learning Theory and the Health Belief Model. Health Education Quarterly, 15:175-183.
- Salahdine F, Kaabouch N (2019). Social Engineering Attacks: A Survey. Future Internet, 11(4), 89.
- Sawyer B D, Hancock P A (2018). Hacking the Human: The Prevalence Paradox in Cybersecurity. Human Factors, 60:597-609.
- Schatz D, Bashroush R, Wall J (2017). Towards a More Representative Definition of Cyber Security. Journal of Digital Forensics, Security and Law, 12(2).
- Schneier B (2000). Secrets & Lies: Digital Security in a Networked World (1st Edition). John Wiley & Sons.
- Schymik G, Du J (2018). Student Intentions and Behaviors Related to Email Security: An Application of the Health Belief Model. Journal of Information Systems Applied Research, 11(3), 14.
- Smith A (2017, March 22). What Americans Knows About Cybersecurity. Pew Research Center: Internet, Science & Tech.
- Soper, D. S. (2021). Post-hoc Statistical Power Calculator for Hierarchical Multiple Regression.
- Uma, M., & Padmavathi, G. (2013). A Survey on Various Cyber Attacks and their Classification. J. Netw. Secur.
- (2018). About us | UNDP in Maldives. UNDP. https://www.mv.undp.org/content/maldives/en/home/about-us.html
- Urbanska M, Roberts M, Ray I, Howe A, Byrne Z (2013). Accepting the inevitable: Factoring the user into home computer security. Proceedings of the Third ACM Conference on Data and Application Security and Privacy – CODASPY ’13, 325.
- von Solms R, van Niekerk J (2013). From information security to cyber security. Computers & Security, 38, 97-102.
- Williams C K, Wynn D, Madupalli R, Karahanna E, Duncan B K (2014). Explaining Users’ Security Behaviors with the Security Belief Model. Journal of Organizational and End User Computing (JOEUC), 26(3), 23-46.
- Zhang Y, Hedo R, Rivera A, Rull R, Richardson S, et al. (2019). Post hoc power analysis: Is it an informative and meaningful analysis? General Psychiatry, 32(4), e100069.
Appendix-01
Survey Instrument
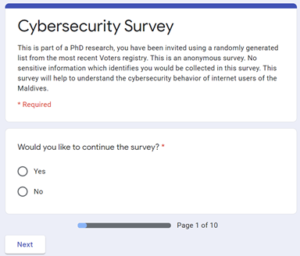
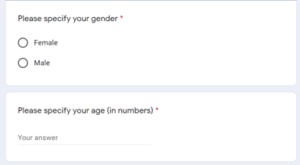

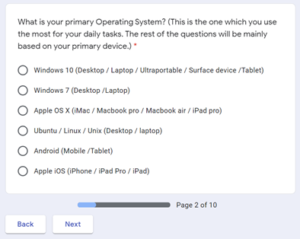
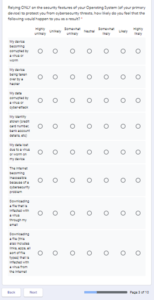
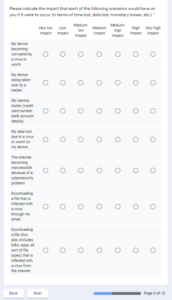
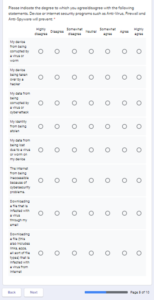
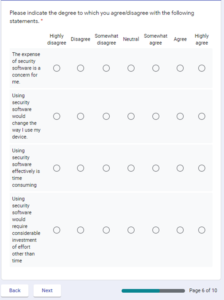
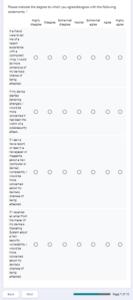
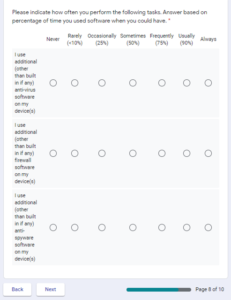
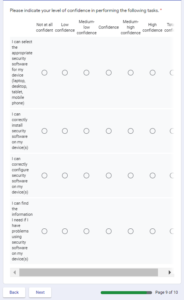
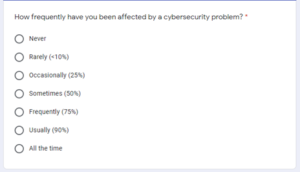
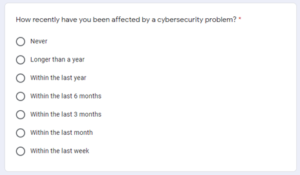
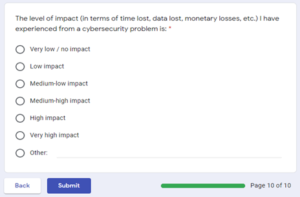
Appendix – 2
Parallel Analysis
Table 15 – Parallel Analysis
Component or Factor
Mean Eigenvalue
Percentile Eigenvalue
1
1.180692
1.283338
2
1.064689
1.145229
3
0.972584
1.051333
4
0.894809
0.967721
5
0.836457
0.910079
6
0.775081
0.835286
7
0.712599
0.769823
8
0.659550
0.715914
9
0.603454
0.658415
10
0.555646
0.609639
11
0.508117
0.558261
12
0.465775
0.514441
13
0.421654
0.468566
14
0.377412
0.418492
15
0.340653
0.380918
16
0.300103
0.342091
17
0.264312
0.311582
18
0.229269
0.267396
19
0.193077
0.233661
20
0.157835
0.188805
21
0.124030
0.155837
22
0.092186
0.120590
23
0.060296
0.086414
24
0.030630
0.058866
25
0.000154
0.034049
26
-0.027905
0.002234
27
-0.059061
-0.027367
28
-0.087203
-0.060528
29
-0.115107
-0.086031
30
-0.144432
-0.120199
31
-0.171294
-0.140842
32
-0.200596
-0.175036
33
-0.225252
-0.199237
34
-0.251978
-0.221979
35
-0.280015
-0.254735
36
-0.305568
-0.282476
37
-0.333894
-0.310625
38
-0.359935
-0.334675
39
-0.386825
-0.363259
40
-0.414962
-0.390525
41
-0.450030
-0.423064
